The Search for Dark Energy Just Got Easier

The Victor M. Blanco telescope at Cerro Tololo Interamerican Observatory (CTIO) in the Chilean Andes. Credit: Berkeley Lab

Since the early 20th century, scientists and physicists have been burdened with explaining how and why the Universe appears to be expanding at an accelerating rate. For decades, the most widely accepted explanation is that the cosmos is permeated by a mysterious force known as “dark energy”. In addition to being responsible for cosmic acceleration, this energy is also thought to comprise 68.3% of the universe’s non-visible mass.

Much like dark matter, the existence of this invisible force is based on observable phenomena and because it happens to fit with our current models of cosmology, and not direct evidence. Instead, scientists must rely on indirect observations, watching how fast cosmic objects (specifically Type Ia supernovae) recede from us as the universe expands.

This process would be extremely tedious for scientists – like those who work for the Dark Energy Survey (DES) – were it not for the new algorithms developed collaboratively by researchers at Lawrence Berkeley National Laboratory and UC Berkeley.

“Our algorithm can classify a detection of a supernova candidate in about 0.01 seconds, whereas an experienced human scanner can take several seconds,” said Danny Goldstein, a UC Berkeley graduate student who developed the code to automate the process of supernova discovery on DES images.

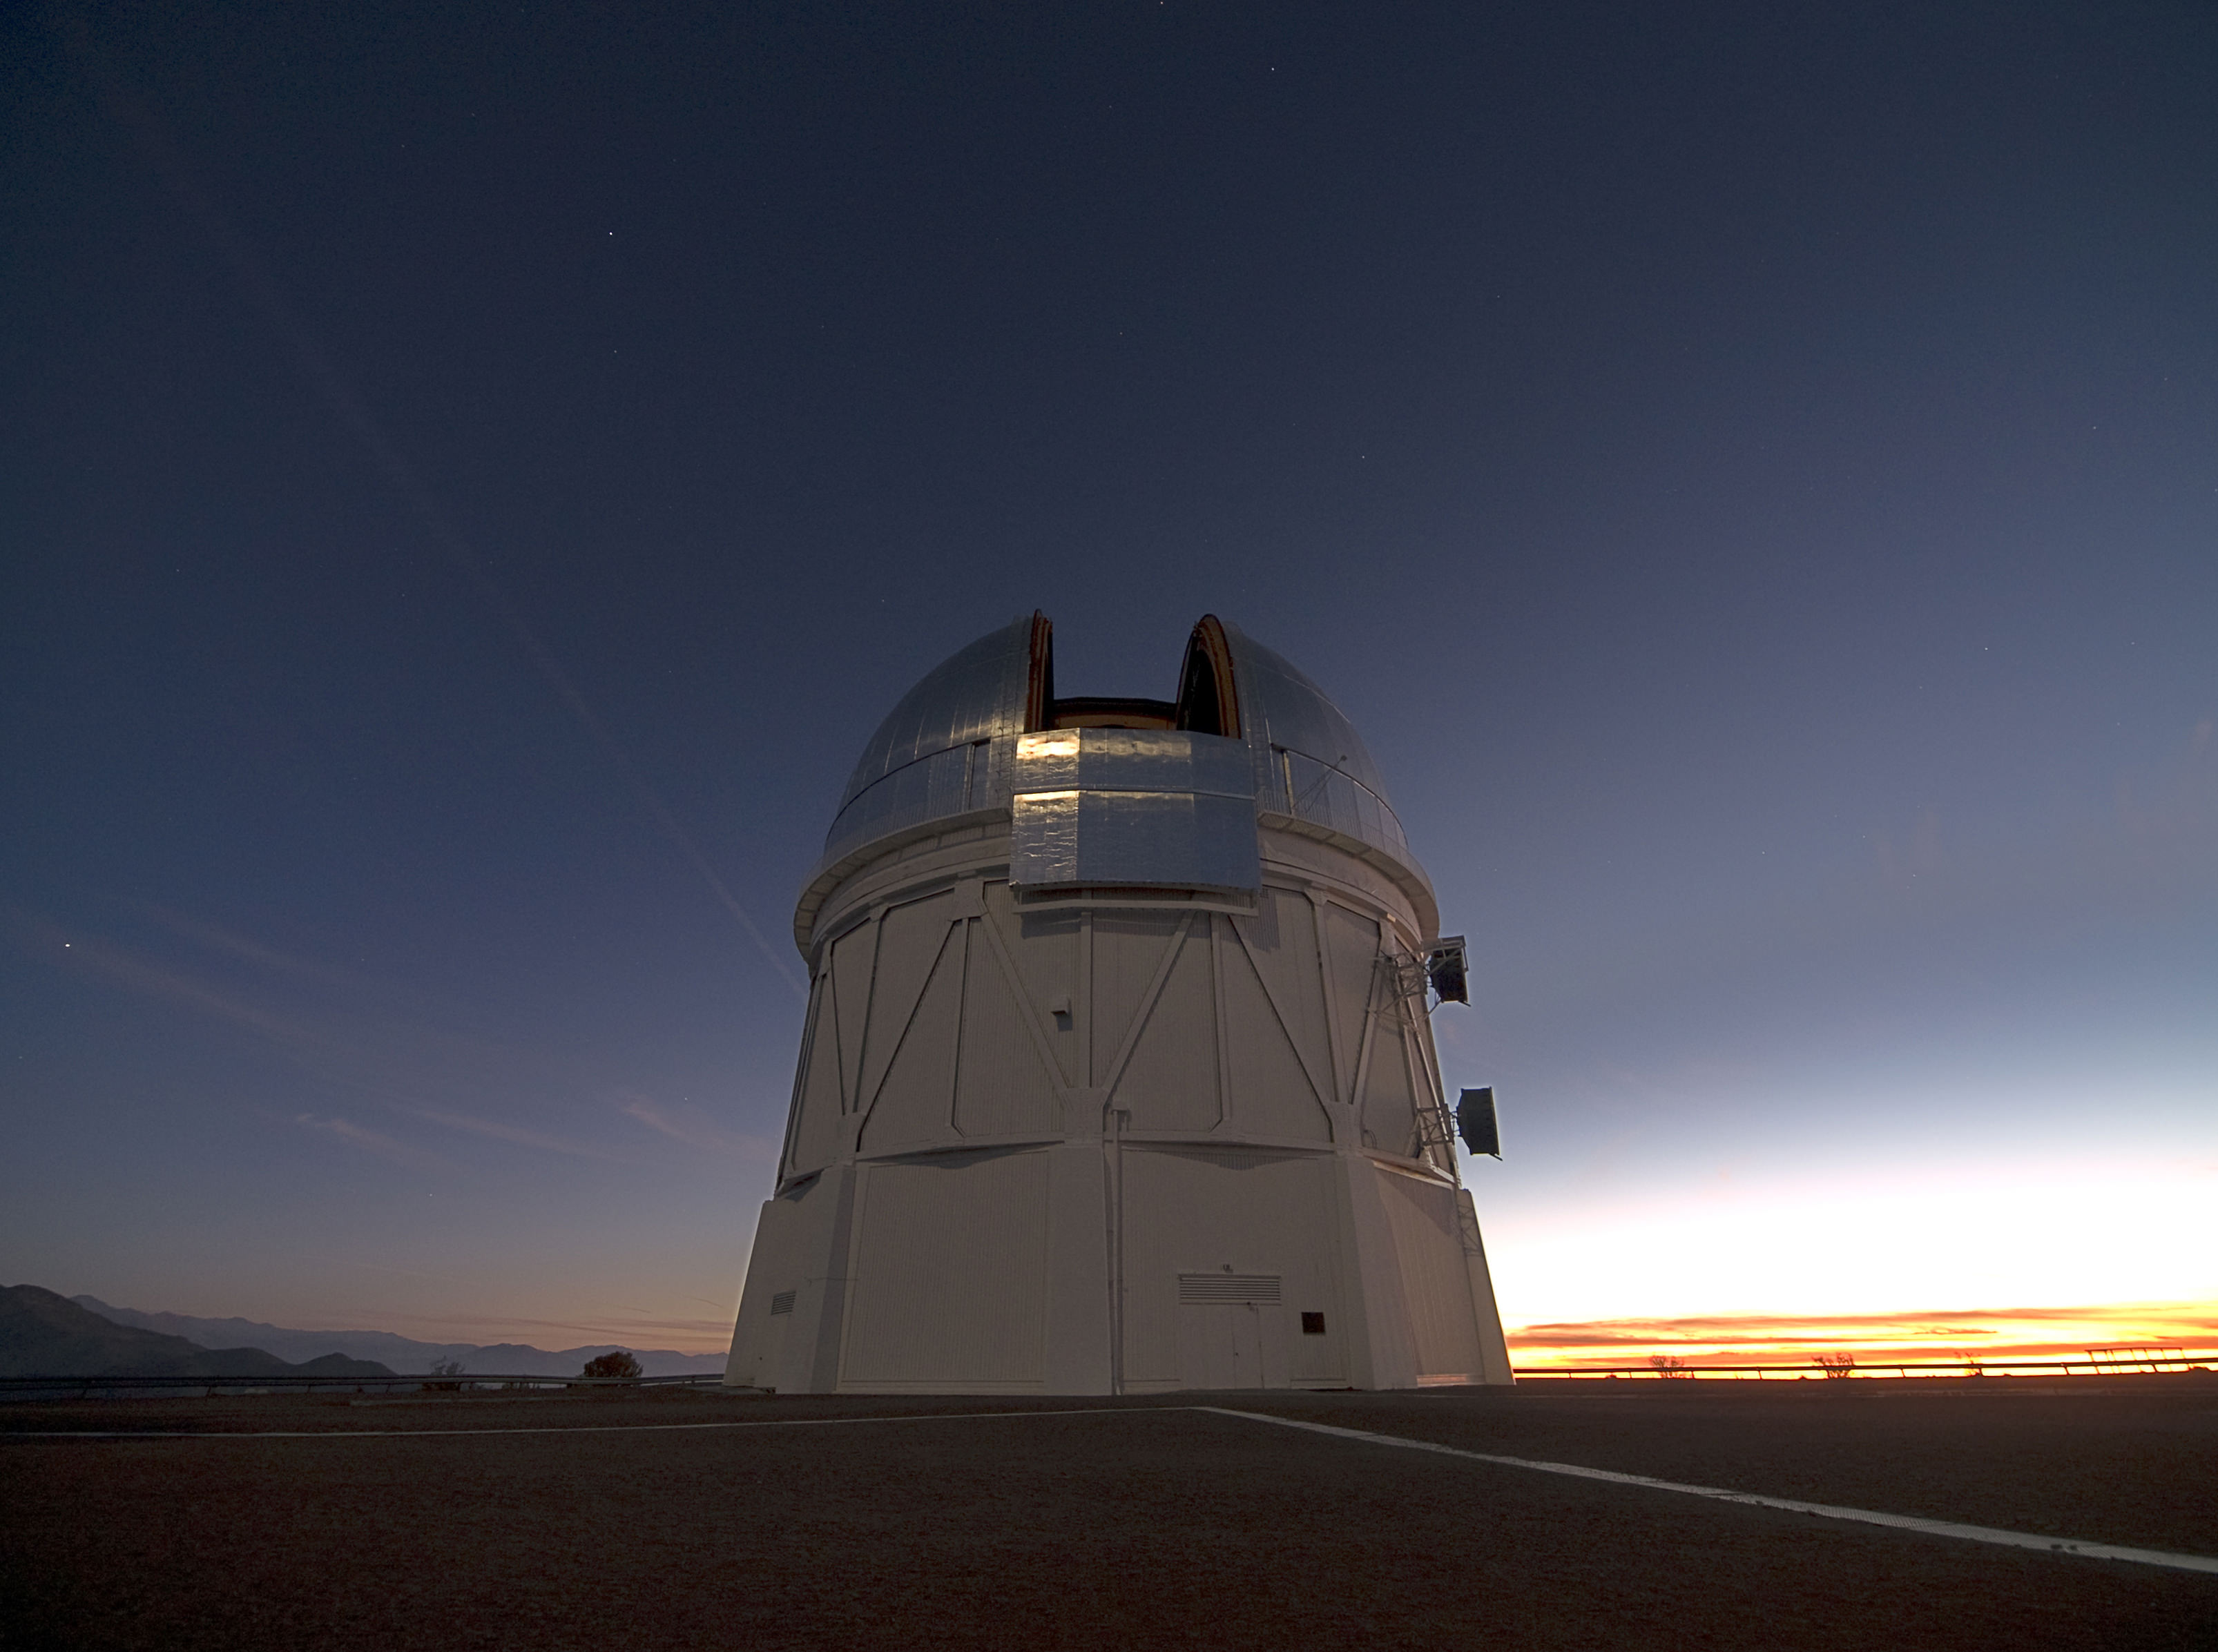
Currently in its second season, the DES takes nightly pictures of the Southern Sky with DECam – a 570-megapixel camera that is mounted on the Victor M. Blanco telescope at Cerro Tololo Interamerican Observatory (CTIO) in the Chilean Andes. Every night, the camera generates between 100 Gigabytes (GB) and 1 Terabyte (TB) of imaging data, which is sent to the National Center for Supercomputing Applications (NCSA) and DOE’s Fermilab in Illinois for initial processing and archiving.

A Type Ia supernova occurs when a white dwarf accretes material from a companion star until it exceeds the Chandrasekhar limit and explodes. By studying these exploding stars, astronomers can measure dark energy and the expansion of the universe. CfA scientists have found a way to correct for small variations in the appearance of these supernovae, so that they become even better standard candles. The key is to sort the supernovae based on their color.  Credit: NASA/CXC/M. Weiss
By studying Type Ia supernova, astronomers can measure dark energy and the expansion of the universe. Credit: NASA/CXC/M. Weiss

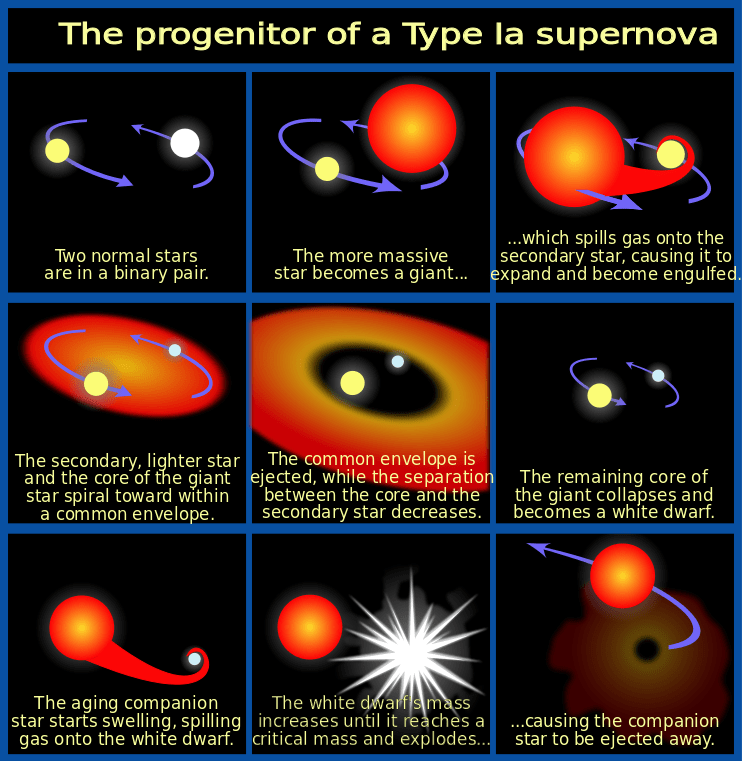
Object recognition programs developed at the National Energy Research Scientific Computing Center (NERSC) and implemented at NCSA then comb through the images in search of possible detections of Type Ia supernovae. These powerful explosions occur in binary star systems where one star is a white dwarf, which accretes material from a companion star until it reaches a critical mass and explodes in a Type Ia supernova.

“These explosions are remarkable because they can be used as cosmic distance indicators to within 3-10 percent accuracy,” says Goldstein.

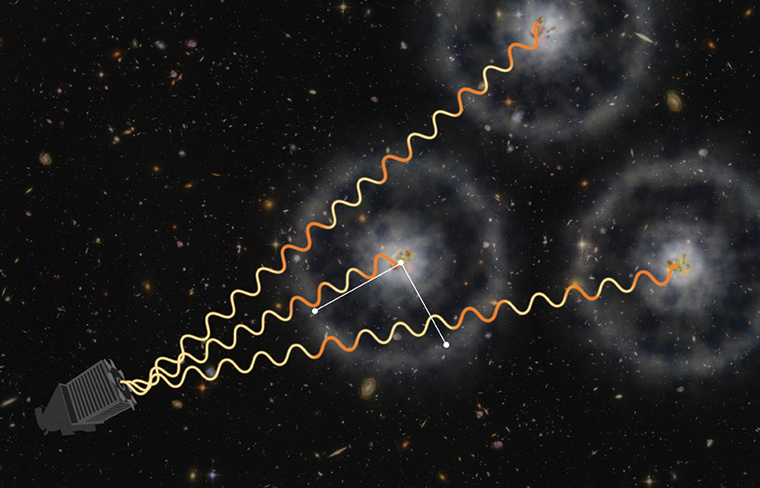
Distance is important because the further away an object is located in space, the further back in time it is. By tracking Type Ia supernovae at different distances, researchers can measure cosmic expansion throughout the universe’s history. This allows them to put constraints on how fast the universe is expanding and maybe even provide other clues about the nature of dark energy.

“Scientifically, it’s a really exciting time because several groups around the world are trying to precisely measure Type Ia supernovae in order to constrain and understand the dark energy that is driving the accelerated expansion of the universe,” says Goldstein, who is also a student researcher in Berkeley Lab’s Computational Cosmology Center (C3).

UC Berkeley / Berkeley Lab graduate student Danny Goldstein developed a new code using the machine learning technique Random Forest to vet detections of supernova candidates automatically, in real time, optimizing it for the Dark Energy Survey. Credit: Danny Goldstein, UC Berkeley / Berkeley Lab)
Goldstein’s new code uses machine learning techniques to vet detections of supernova candidates. Credit: Danny Goldstein, UC Berkeley/Berkeley Lab)

The DES begins its search for Type Ia explosions by uncovering changes in the night sky, which is where the image subtraction pipeline developed and implemented by researchers in the DES supernova working group comes in. The pipeline subtracts images that contain known cosmic objects from new images that are exposed nightly at CTIO.

Each night, the pipeline produces between 10,000 and a few hundred thousand detections of supernova candidates that need to be validated.

“Historically, trained astronomers would sit at the computer for hours, look at these dots, and offer opinions about whether they had the characteristics of a supernova, or whether they were caused by spurious effects that masquerade as supernovae in the data. This process seems straightforward until you realize that the number of candidates that need to be classified each night is prohibitively large and only one in a few hundred is a real supernova of any type,” says Goldstein. “This process is extremely tedious and time-intensive. It also puts a lot of pressure on the supernova working group to process and scan data fast, which is hard work.”

To simplify the task of vetting candidates, Goldstein developed a code that uses the machine learning technique “Random Forest” to vet detections of supernova candidates automatically and in real-time to optimize them for the DES. The technique employs an ensemble of decision trees to automatically ask the types of questions that astronomers would typically consider when classifying supernova candidates.

Evolution of a Type Ia supernova. Credit: NASA/ESA/A. Feild

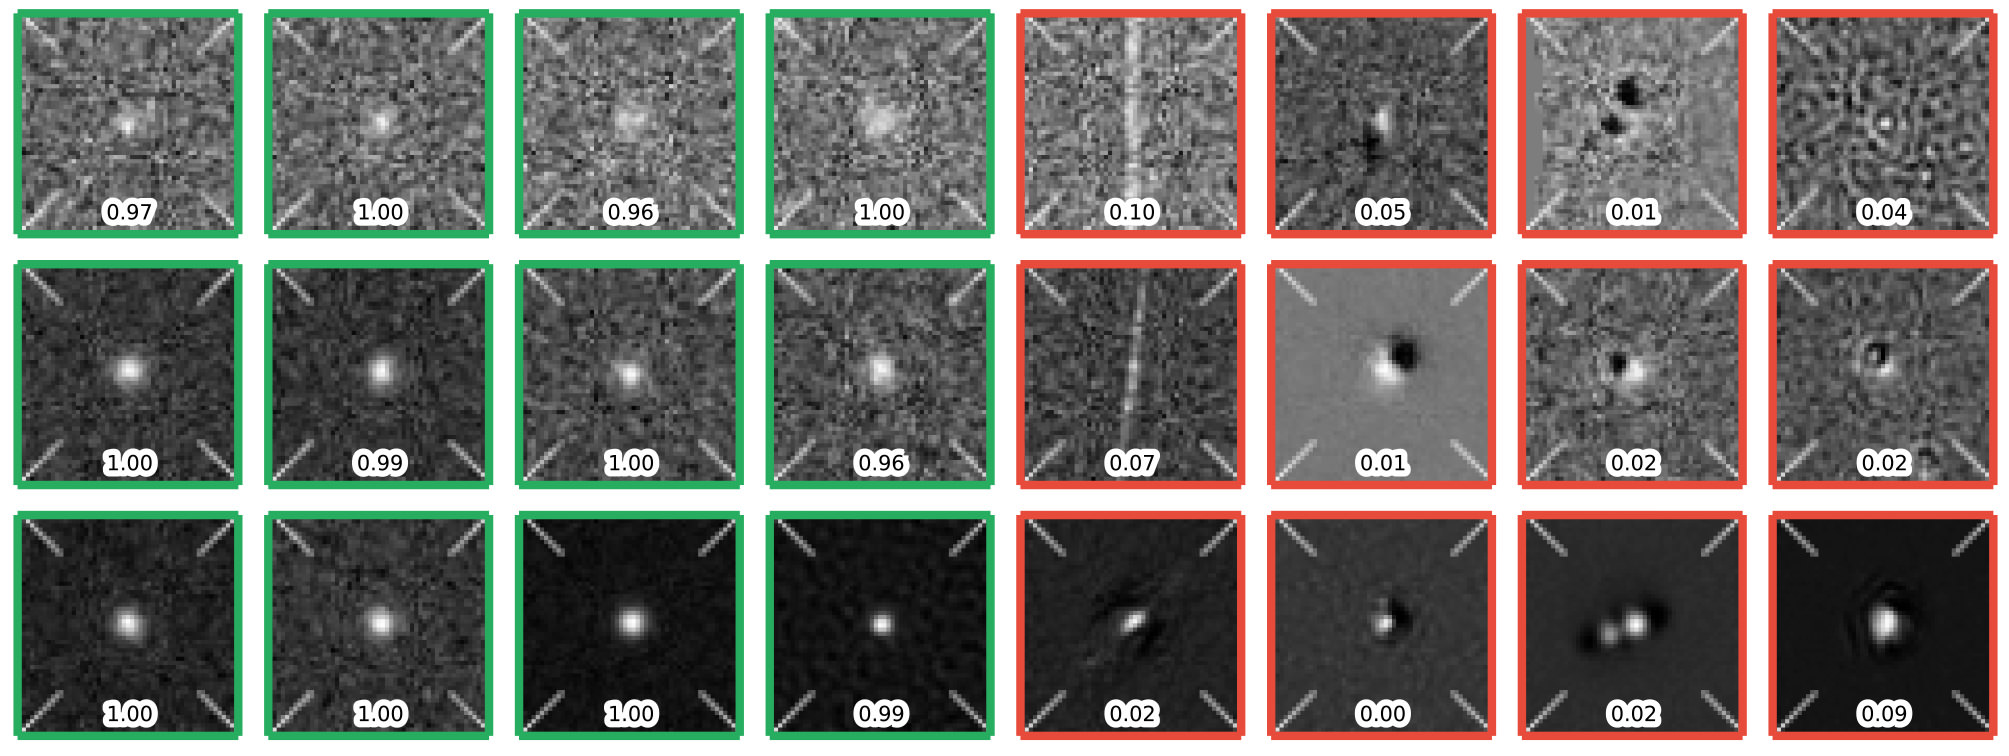
At the end of the process, each detection of a candidate is given a score based on the fraction of decision trees that considered it to have the characteristics of a detection of a supernova. The closer the classification score is to one, the stronger the candidate. Goldstein notes that in preliminary tests, the classification pipeline achieved 96 percent overall accuracy.

“When you do subtraction alone you get far too many ‘false-positives’ — instrumental or software artifacts that show up as potential supernova candidates — for humans to sift through,” says Rollin Thomas, of Berkeley Lab’s C3, who was Goldstein’s collaborator.

He notes that with the classifier, researchers can quickly and accurately strain out the artifacts from supernova candidates. “This means that instead of having 20 scientists from the supernova working group continually sift through thousands of candidates every night, you can just appoint one person to look at maybe few hundred strong candidates,” says Thomas. “This significantly speeds up our workflow and allows us to identify supernovae in real-time, which is crucial for conducting follow up observations.”

“Using about 60 cores on a supercomputer we can classify 200,000 detections in about 20 minutes, including time for database interaction and feature extraction.” says Goldstein.

Goldstein and Thomas note that the next step in this work is to add a second-level of machine learning to the pipeline to improve the classification accuracy. This extra layer would take into account how the object was classified in previous observations as it determines the probability that the candidate is “real.” The researchers and their colleagues are currently working on different approaches to achieve this capability.

Further Reading: Berkley Lab

Quasars Tell The Story Of How Fast The Young Universe Expanded

Artist's conception of how the Baryon Oscillation Spectroscopic Survey uses quasars to make measurements. The light these objects sends out gets absorbed by gas in between the receiver and the source. The gas is then "imprinted wiht a subtle ring-like pattern of known physical scale", the Sloan Digital Sky Survey stated. Credit: Zosia Rostomian (Lawrence Berkeley National Laboratory) and Andreu Font-Ribera (BOSS Lyman-alpha team, Berkeley Lab.)

For those who saw the Cosmos episode on William Herschel describing telescopes as time machines, here is a clear example of that. By examining 140,000 objects called quasars (galaxies with an active black hole at their centers), astronomers have charted the expansion rate of the universe — not now, but 10.8 billion years ago.

This is the most precise measurement ever of the universe’s expansion rate at any point in time, the science teams said, with the calculation showing the universe was expanding by 1% every 44 million years at that time. (That figure is to 2% precision, the researchers added.)

“If we look back to the Universe when galaxies were three times closer together than they are today, we’d see that a pair of galaxies separated by a million light-years would be drifting apart at a speed of 68 kilometers per second as the Universe expands,” stated Andreu Font-Ribera of the Lawrence Berkeley National Laboratory, who led one of the two analyses.

The researchers used a telescope called the Sloan Digital Sky Survey, a 2.5-meter telescope at Apache Point Observatory in New Mexico. The discovery was made during Sloan’s Baryon Oscillation Spectroscopic Survey, or BOSS, whose aim has been to figure out the expansion and acceleration of the universe.

The accelerating, expanding Universe. Credit: NASA/WMAP

“BOSS determines the expansion rate at a given time in the Universe by measuring the size of baryon acoustic oscillations (BAO), a signature imprinted in the way matter is distributed, resulting from sound waves in the early Universe,” the Sloan Digital Sky Survey stated. “This imprint is visible in the distribution of galaxies, quasars, and intergalactic hydrogen throughout the cosmos.”

Font-Ribera and his collaborators examined how quasars are distributed compared to hydrogen gas to calculate distance. The other analysis, led by Timothée Delubac (Centre de Saclay, France), examined the hydrogen gas to see patterns and measure mass distribution.

You can read more about Font-Ribera’s team’s research in preprint version on Arxiv. Delubac’s research does not appear to be available online, but the title is “Baryon Acoustic Oscillations in the Ly-alpha forest of BOSS DR11 quasars” and it has been submitted to Astronomy & Astrophysics.

Source: Sloan Digital Sky Survey

What Is The Cosmic Microwave Background Radiation?

What Is The Cosmic Microwave Background Radiation?

The Cosmic Microwave Background Radiation is the afterglow of the Big Bang; one of the strongest lines of evidence we have that this event happened. UCLA’s Dr. Ned Wright explains.

“Ok, I’m Ned Wright, and I’m a professor of physics and astronomy at UCLA, and I work on infrared astronomy and cosmology.”

How useful is the cosmic microwave background radiation?

“Well, the most important information we get is from the cosmic microwave background radiation come from, at the lowest level, is it’s existence. When I started in astronomy, it wasn’t 100 percent certain that the Big Bang model was correct. And so with the prediction of a cosmic microwave background from the Big Bang and the prediction of no cosmic microwave background from the competing theory, the steady state, that was a very important step in our knowledge.”

“And then the second aspect of the cosmic microwave background that is very important, is that it’s spectrum is extremely similar to a black body. And so, by being a black body means that universe relatively smoothly transitioned from being opaque to being transparent, and then we actually see effectively an isothermal cavity when we look out, so it looks very close to a black body.”

“And the fact that we are moving through the universe can be measured very precisely by looking at what is called the dipole anisotropy of the microwave background. So one side of the sky is slightly hotter (about 3 millikelvin hotter) and one side of the sky – the opposite side of the sky – is slightly colder (about 3 millikelvin colder), so that means that we are moving at approximately a tenth of a percent of the speed of light. And in fact we now know very precisely what that value is – it’s about 370 kilometers per second. So that’s our motion, the solar system’s motion, through the universe.”

“An then the final piece of information we’re getting from the microwave background now, in fact the Planck satellite just gave us more information along these lines is measurement of the statistical pattern of the very small what I call anisotropies or little bumps and valleys in the temperature. So in addition to the 3 millikelvin difference, we actually have plus or minus 100 microkelvin difference in the temperature from different spots. And so, when you look at these spots, and look at their detailed pattern, you can actually see a very prominent feature, which is there’s about a one and a half degree preferred scale, and that’s what’s caused by the acoustic
waves that are set up by the density perturbations early in the history of the universe, and how far they could travel before the universe became transparent. And that’s a very strong indicator about the universe.”

What does it tell us about dark energy?

“The cosmic microwave background actually has this pattern on a half degree scale, and that gives you effectively a line of position, as you have with celestial navigation where you get a measurement of one star with a sextant, then you get a line on the map where you are. But you can look at the same pattern – the acoustic wave setup in the universe, and you see that in the galaxy’s distribution a lot more locally. We’re talking about galaxies, so it might be a billion light years away, but to cosmologists, that’s local. And these galaxies also show the same wave-like pattern, and you can measure that angle at scale locally and compare it to what you see in history and that gives you the crossing line of position. And that really tells us where we are in the universe, and how much stuff there is and it tells us that we have this dark energy which nobody really understands what it is, but we know what it’s doing. It’s making the universe accelerate in it’s expansion.”