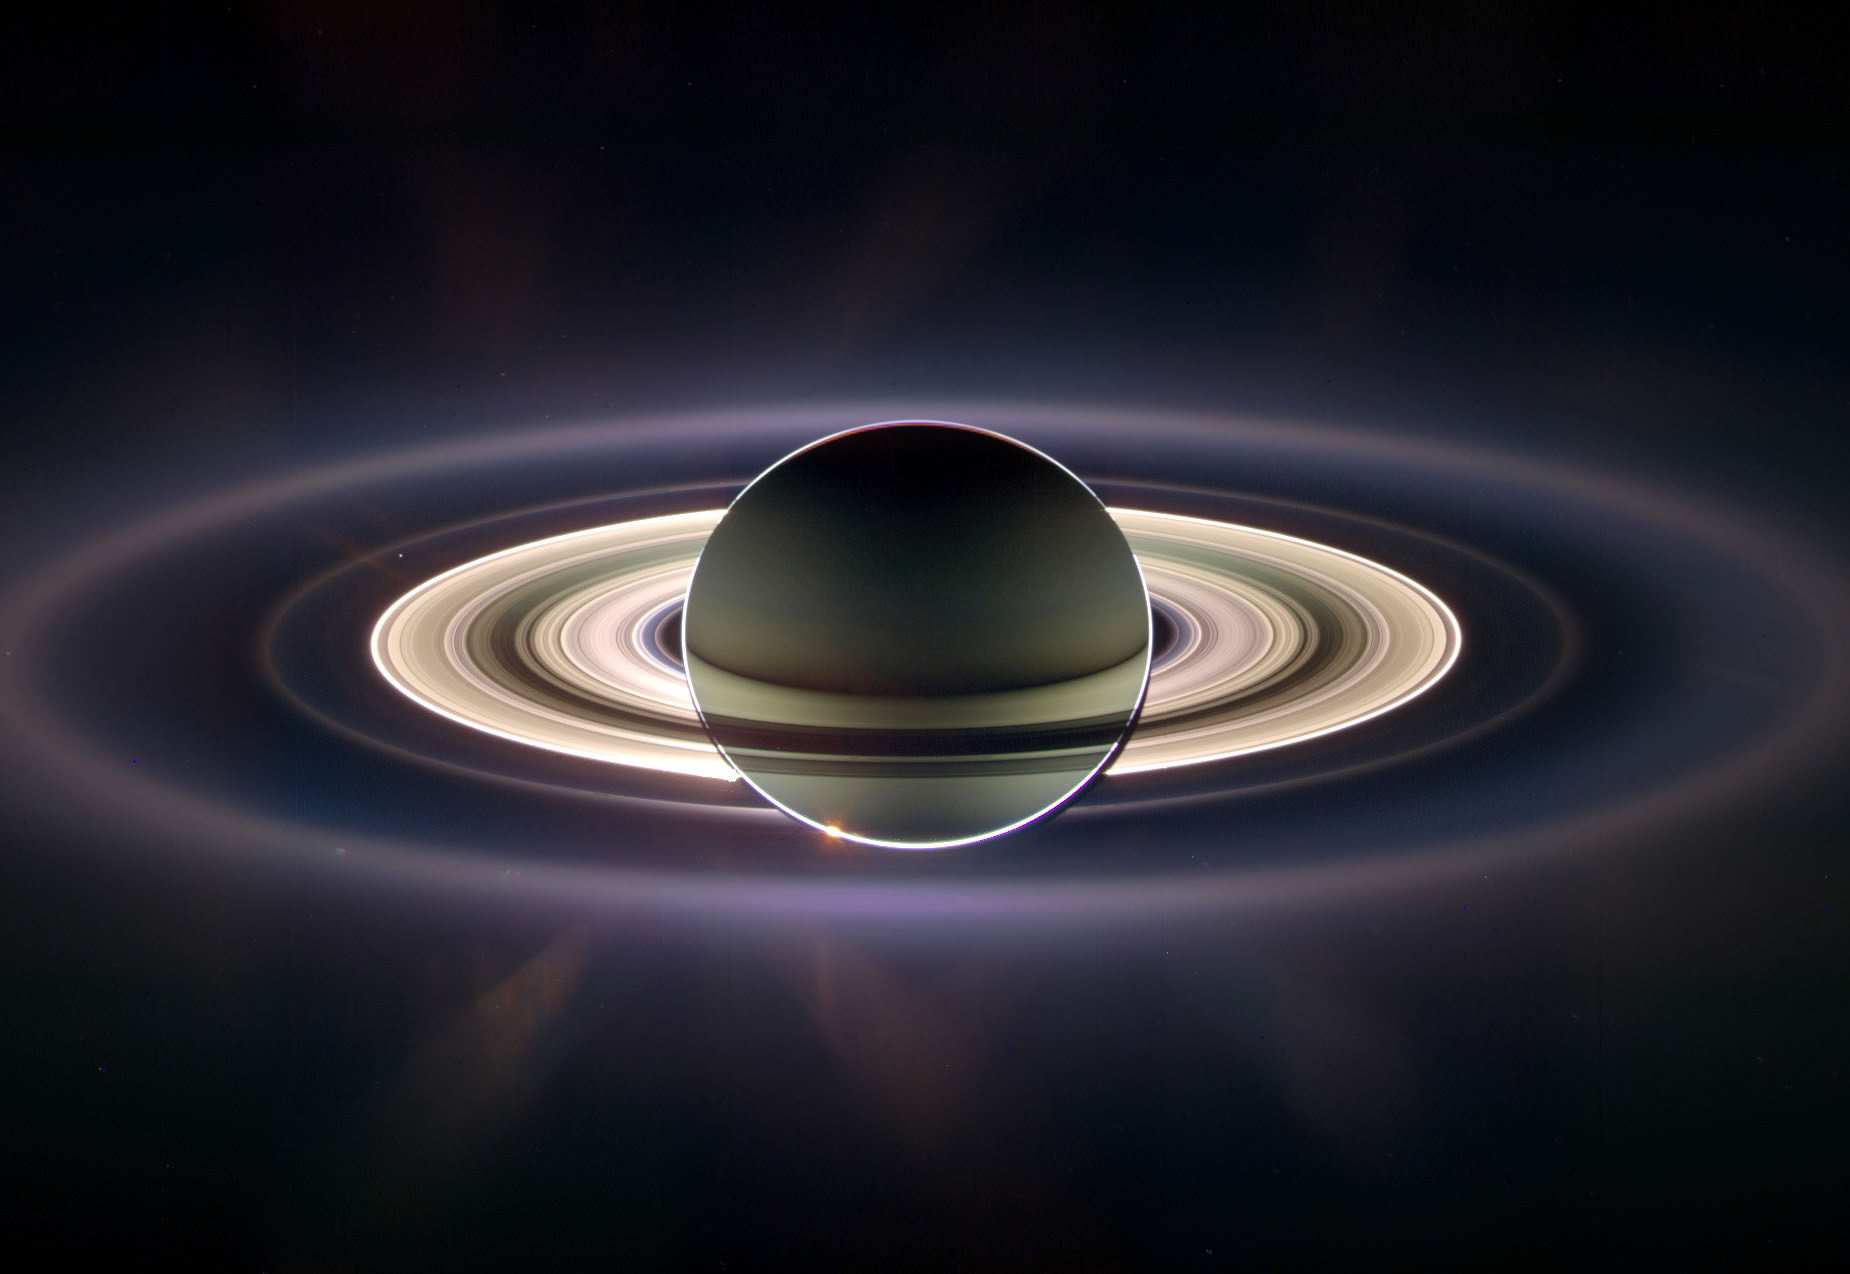
Mosaic of Saturn seen in eclipse in September 2006. Earth is the bright dot just inside the F ring at upper left. (CICLOPS/NASA/JPL-Caltech/SSI)
Citizens of Earth, get ready for your Cassini close-up: once again the spacecraft is preparing to capture images of Saturn positioned between it and the Sun, allowing for incredible views of the ring system and its atmosphere — and also a tiny “pale blue dot” in the distance we call home.
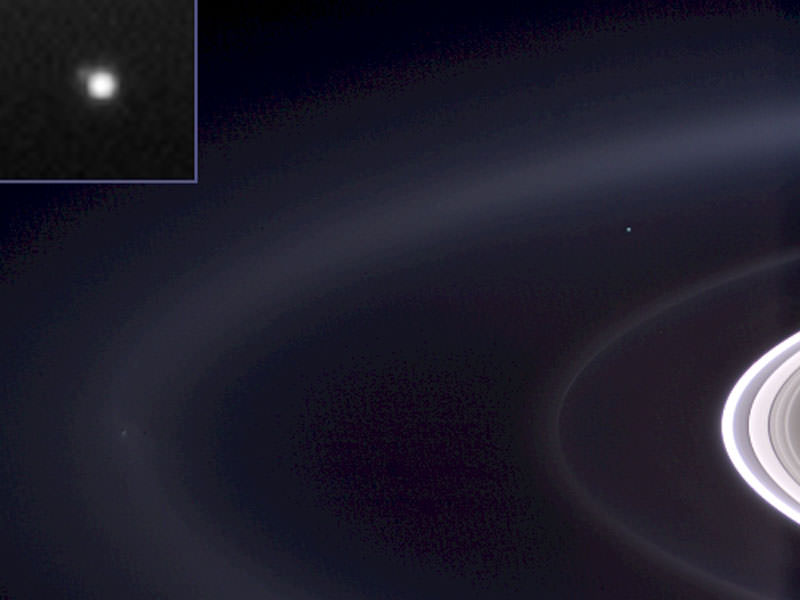
Earth seen from Cassini (NASA/JPL/SSI)
The mosaic above was composed of images captured during such an eclipse event in September 2006, and quickly became an astronomical sensation. It’s not often we get an idea of what we look like from so far away, and seeing our entire world represented as a small speck of light nestled between Saturn’s rings is, to me anyway, both impressive and humbling.
Humbling because of how small we look, but impressive because as a species we have found a way to do it.
And next month, on Friday, July 19 between 21:27 and 21:42 UTC (5:27 – 5:42 p.m. EDT) Cassini will do it again.
“Ever since we caught sight of the Earth among the rings of Saturn in September 2006 in a mosaic that has become one of Cassini’s most beloved images, I have wanted to do it all over again, only better,” said Cassini imaging team leader, Carolyn Porco. “And this time, I wanted to turn the entire event into an opportunity for everyone around the globe, at the same time, to savor the uniqueness of our beautiful blue-ocean planet and the preciousness of the life on it.”
Porco was involved in co-initiating and executing the famous “Pale Blue Dot” image of Earth taken by NASA’s Voyager 1 from beyond the orbit of Neptune in 1990.
“It will be a day for all the world to celebrate,” she said.
The intent for the upcoming mosaic is to capture the whole scene, Earth and Saturn’s rings from one end to the other, in Cassini’s red, green and blue filters that can be composited to form a natural color view of what our eyes might see at Saturn. Earth and the Moon will also be imaged with a high resolution camera — something not yet done by Cassini.
We can all consider ourselves pretty lucky, too… this is the first time in history that we humans will know in advance that our picture is going to be taken from nearly a billion miles away.
“While Earth will be only about a pixel in size from Cassini’s vantage point 898 million miles [1.44 billion kilometers] away, the Cassini team is looking forward to giving the world a chance to see what their home looks like from Saturn,” said Linda Spilker, Cassini project scientist at NASA’s Jet Propulsion Laboratory. “With this advance notice, we hope you’ll join us in waving at Saturn from Earth, so we can commemorate this special opportunity.”
So on July 19, remember to look up and wave… Cassini will be watching!
Read more on the CICLOPS news release here and on the NASA/JPL Cassini mission site here.
“That’s here. That’s home. That’s us. On it everyone you love, everyone you know, everyone you ever heard of, every human being who ever was, lived out their lives… There is perhaps no better demonstration of the folly of human conceits than this distant image of our tiny world.”
New topography map of Antarctica by the British Antarctic Survey's Bedmap2 (NASA/GSFC)
Although it sits isolated at the “bottom of the world” Antarctica is one of the most influential continents on Earth, affecting weather, climate, and ocean current patterns over the entire planet. But Antarctica is also one of the most enigmatic landmasses too, incredibly remote, extremely harsh, and covered by a layer of ice over 2 km thick. And as Earth’s global temperature continues to climb steadily higher, the future of ice in Antarctica — a continent half again as large as the contiguous United States — is a big concern for scientists… but in order to know exactly how its ice will behave to changing conditions, they need to know what’s under it.
This is where the British Antarctic Survey — using data gathered by NASA’s ICESat and Operation IceBridge missions — comes in, giving us a better view of what lies beneath the southern continent’s frozen veil.
A new dataset called Bedmap2 gives a clearer picture of Antarctica from the ice surface down to the bedrock below. Bedmap2 is a significant improvement on the previous collection of Antarctic data — known as Bedmap — that was produced more than 10 years ago. The product was a result of work led by the British Antarctic Survey, where researchers compiled decades worth of geophysical measurements, such as surface elevation measurements from NASA’s Ice, Cloud and Land Elevation Satellite (ICESat) and ice thickness data collected by Operation IceBridge.
Bedmap2, like the original Bedmap, is a collection of three datasets—surface elevation, ice thickness and bedrock topography. Both Bedmap and Bedmap2 are laid out as grids covering the entire continent, but with a tighter grid spacing Bedmap2 includes many surface and sub-ice features too small to be seen in the previous dataset. Additionally, the extensive use of GPS data in more recent surveys improves the precision of the new dataset.
Improvements in resolution, coverage and precision will lead to more accurate calculations of ice volume and potential contribution to sea level rise.
Ice sheet researchers use computer models to simulate how ice sheets will respond to changes in ocean and air temperatures. An advantage of these simulations is that they allow testing of many different climate scenarios, but the models are limited by how accurate the data on ice volume and sub-ice terrain are.
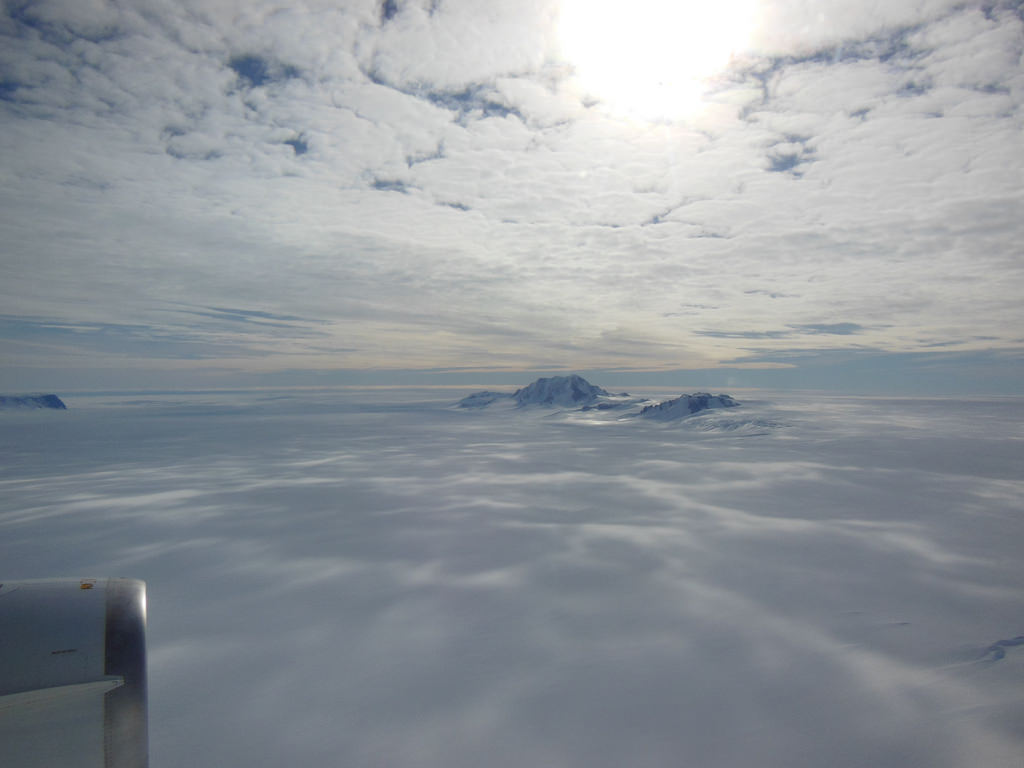
Only the tips of many of Antarctica’s mountains are visible above thousands of feet of ice. (Oct. 2012 IceBridge photo. Credit: NASA / Christy Hansen)
“In order to accurately simulate the dynamic response of ice sheets to changing environmental conditions, such as temperature and snow accumulation, we need to know the shape and structure of the bedrock below the ice sheets in great detail,” said Michael Studinger, IceBridge project scientist at NASA Goddard.
Knowing what the bedrock looks like is important for ice sheet modeling because features in the bed control the ice’s shape and affect how it moves. Ice will flow faster on a downhill slope, while an uphill slope or bumpy terrain can slow an ice sheet down or even hold it in place temporarily. “The shape of the bed is the most important unknown, and affect how ice can flow,” said Nowicki. “You can influence how honey spreads on your plate, by simply varying how you hold your plate.” The vastly improved bedrock data included in Bedmap2 should provide the level of detail needed for models to be realistic.
Bedmap2 data of Antarctica’s bedrock. Verical elevation has been exaggerated by 17x. (NASA/GSFC)
“It will be an important resource for the next generation of ice sheet modelers, physical oceanographers and structural geologists,” said Peter Fretwell, BAS scientist and lead author.
The BAS’ work was published recently in the journal The Cryosphere. Read more on the original release by George Hale here.
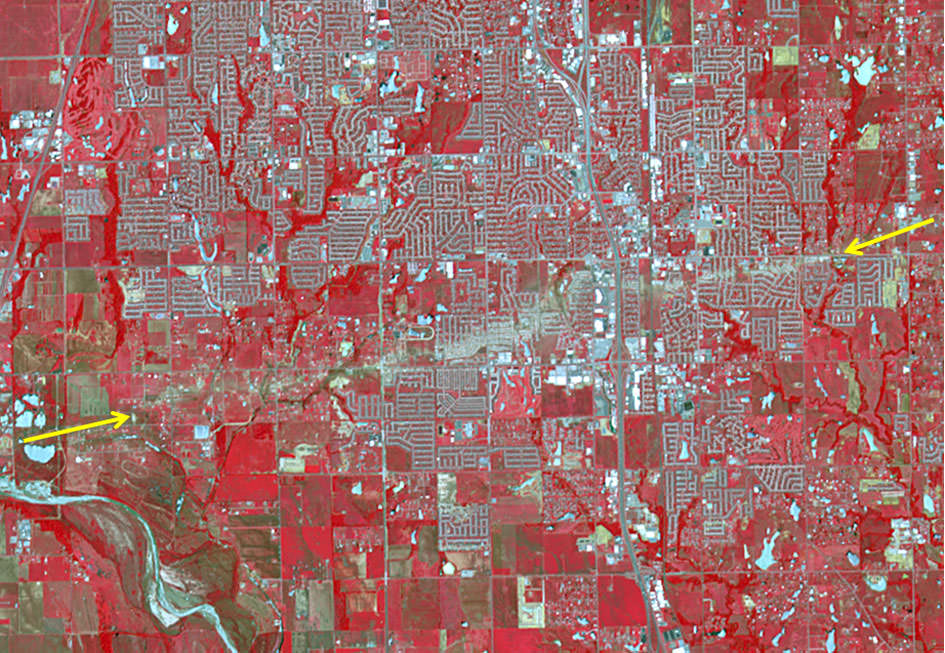
The track of the tornado that struck Moore, Oklahoma on May 20, 2013 is visible from space in this false color image taken on June 2, 2013 by the Advanced Spaceborne Thermal Emission and Reflection Radiometer (ASTER) on NASA’s Terra satellite.
The tornado that devastated the region around Moore and Newcastle, Oklahoma on May 20, 2013 has been determined to be an EF-5 tornado, the most severe on the enhanced Fujita scale, and has been called one of the most powerful and destructive tornadoes ever recorded. In this new image taken by the Advanced Spaceborne Thermal Emission and Reflection Radiometer (ASTER) on NASA’s Terra satellite, the scar of destruction on the Oklahoma landscape is clearly visible from space. In this false-color infrared image, red highlights vegetation, and the tornado track appears as a beige strip running west to east across this image; the color reveals the lack of vegetation in the wake of the storm.
According to the National Weather Service, the tornado was on the ground for 39 minutes, ripping across 17 miles (27 kilometers) from 4.4 miles west of Newcastle to 4.8 miles east of Moore. At its peak, the funnel cloud was 1.3 miles (2.1 kilometers) wide and wind speeds reached 210 miles (340 km) per hour. The storm killed at least 24 people, injured 377, and affected nearly 33,000 in some way.
In this image, infrared, red, and green wavelengths of light have been combined to better distinguish between water, vegetation, bare ground, and human developments. Water is blue. Buildings and paved surfaces are blue-gray.
You can also see an interactive satellite map from Google and Digital Globe, showing detail of every building that was damaged or destroyed. Satellite data like this are helping to assist in the recovery and rebuilding of the area. Satellite imagery can provide a systematic approach to aiding, monitoring and evaluating the process.
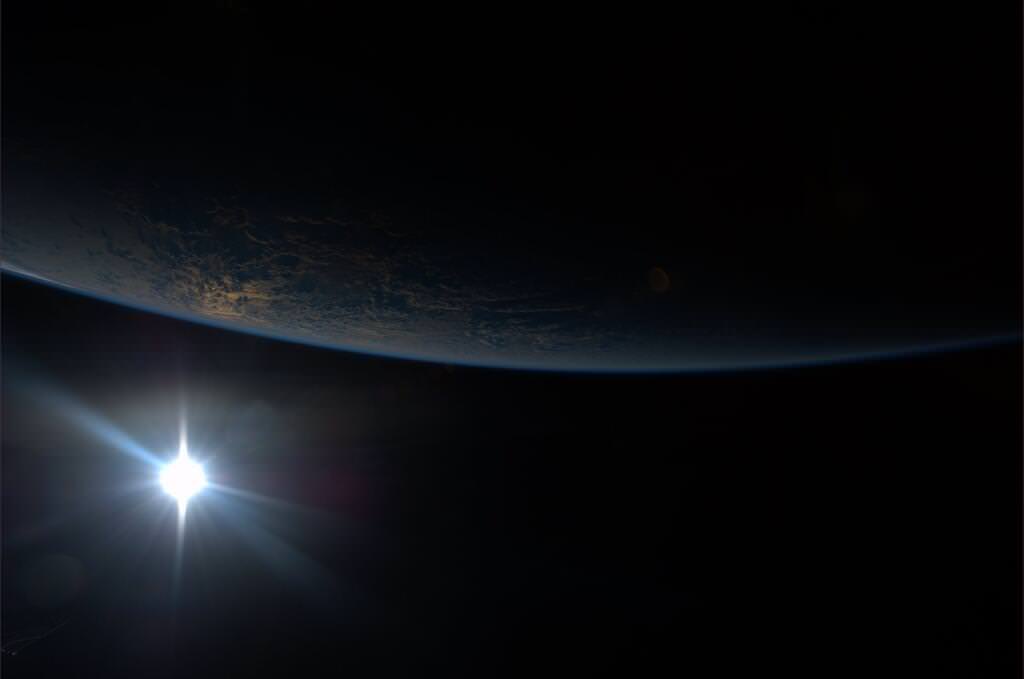
An orbital sunset puts Earth in a unique light, as seen from the International Space Station. Credit: NASA, via astronaut Karen Nyberg.
This is just a gorgeous shot of our home planet from the International Space Station, shared by astronaut Karen Nyberg via Twitter. While many pictures of Earth from space show a bright view of our planet, this view of the world plunging into darkness provides a unique, not-often-seen view. If a picture can be this beautiful, imagine what must look like in person.
Nyberg is sharing her experiences via Twitter and also — I believe she is the first astronaut sharing on Pinterest. She describes herself as “Aspiring quilter, crafter, artist” (perfect for the Pinterest crowd) in addition to being an astronaut by day, and said she hopes to do some crafting in space if she has any spare time. Nyberg has a special board for “Hair in Space” (which includes both bald pates and gravity defying hair,) hoping to inspire the younger generation of women to get interested in space exploration. “When girls see pictures of ponytails, don’t you think it stirs something inside them that says, that could be ME up there!” Nyberg writes.
This article comes from the Universe Today archive, but was updated with this spiffy video.
How old is the Earth? Scientists think that the Earth is 4.54 billion years old. Coincidentally, this is the same age as the rest of the planets in the Solar System, as well as the Sun. Of course, it’s not a coincidence; the Sun and the planets all formed together from a diffuse cloud of hydrogen billions of years ago.
In the early Solar System, all of the planets formed in the solar nebula; the remnants left over from the formation of the Sun. Small particles of dust collected together into larger and larger objects – pebbles, rocks, boulders, etc – until there were many planetoids in the Solar System. These planetoids collided together and eventually enough came together to become Earth-sized.
At some point in the early history of Earth, a planetoid the size of Mars crashed into our planet. The resulting collision sent debris into orbit that eventually became the Moon.
How do scientists know Earth is 4.54 billion years old? It’s actually difficult to tell from the surface of the planet alone, since plate tectonics constantly reshape its surface. Older parts of the surface slide under newer plates to be recycled in the Earth’s core. The oldest rocks ever found on Earth are 4.0 – 4.2 billion years old.
Scientists assume that all the material in the Solar System formed at the same time. Various chemicals, and specifically radioactive isotopes were formed together. Since they decay in a very known rate, these isotopes can be measured to determine how long the elements have existed. And by studying different meteorites from different locations in the Solar System, scientists know that the different planets all formed at the same time.
Failed Methods for Calculating the Age of the Earth
Our current, accurate method of measuring the age of the Earth comes at the end of a long series of estimates made through history. Clever scientists discovered features about the Earth and the Sun that change over time, and then calculated how old the planet Earth is from that. Unfortunately, they were all flawed for various reasons.
Declining Sea Levels – Benoit de Maillet, a French anthropologist who lived from 1656-1738 and guessed (incorrectly) that fossils at high elevations meant Earth was once covered by a large ocean. This ocean had taken 2 billion years to evaporate to current sea levels. Scientists abandoned this when they realized that sea levels naturally rise and fall.
Cooling of the Earth – William Thompson, later known as Lord Kelvin, assumed that the Earth was once a molten ball of rock with the same temperature of the Sun, and then has been cooling ever since. Based on these assumptions, Thompson calculated that the Earth took somewhere between 20 and 400 million years to cool to its current temperature. Of course, Thompson made several inaccurate assumptions, about the temperature of the Sun (it’s really 15 million degrees Kelvin at its core), the temperature of the Earth (with its molten core) and how the Sun is made of hydrogen and the Earth is made of rock and metal.
Cooling of the Sun – In 1856, the German physicist Hermann Ludwig Ferdinand von Helmholtz attempted to calculate the age of the Earth by the cooling of the Sun. He calculated that the Sun would have taken 22 million years to condense down to its current diameter and temperature from a diffuse cloud of gas and dust. Although this was inaccurate, Helmholtz correctly identified that the source of the Sun’s heat was driven by gravitational contraction.
Rock Erosion – In his book, The Origin of Species by Means of Natural Selection, Charles Darwin proposed that the erosion of chalk deposits might allow for a calculation of the minimum age of the planet. Darwin estimated that a chalk formation in the Weald region of England might have taken 300 million years to weather to its current form.
Orbit of the Moon – George Darwin, the son of Charles Darwin, guessed that the Moon might have been formed out of the Earth, and drifted out to its current location. The fission theory proposed that the Earth’s rapid rotation caused a chunk of the planet to spin off into space. Darwin calculated that it had taken the Moon at least 56 million years to reach its current distance from Earth. We now know the Moon was probably formed when a Mars-sized object smashed into the Earth billions of years ago.
Salinity of the Ocean – In 1715, the famous astronomer Edmund Halley proposed that the salinity of the oceans could be used to estimate the age of the planet. Halley observed that oceans and lakes fed by streams were constantly receiving more salt, which then stuck around as the water evaporated. Over time, the water would be come saltier and saltier, allowing an estimate of how long this process has been going on. Various geologists used this method to guess that the Earth was between 80 and 150 million years old. This method was flawed because scientists didn’t realize that geologic processes are extracting salt out of the water as well.
Radiometric Dating Provides an Accurate Method to Know the Age of the Earth
In 1896, the French chemist A. Henri Becquerel discovered radioactivity, the process where materials decay into other materials, releasing energy. Geologists realized that the interior of the Earth contained a large amount of radioactive material, and this would be throwing off their calculations for the age of the Earth. Although this discovery revealed flaws in the previous methods of calculating the age of the Earth, it provided a new method: radiometric dating.
Geologists discovered that radioactive materials decay into other elements at a very predictable rate. Some materials decay quickly, while others can take millions or even billions of years to fully decay. Ernest Rutherford and Frederick Soddy, working at McGill University, determined that half of any isotope of a radioactive element decays into another isotope at a set rate. For example, if you have a set amount of Thorium-232, half of it will decay over a billion years, and then half of that amount will decay in another billion years. This is the source of the term “half life”.
By measuring the half lives of radioactive isotopes, geologists were able to build a measurement ladder that let them accurately calculate the age of geologic formations, including the Earth. They used the decay of uranium into various isotopes of lead. By measuring the amount of three different isotopes of lead (Pb-206, Pb-207, and Pb-208 or Pb-204), geologists can calculate how much Uranium was originally in a sample of material.
If the Solar System formed from a common pool of matter, with uniformly distributed Pb isotopes, then all objects from that pool of matter should show similar amounts of the isotopes. Also, over time, the amounts of Pb-206 and Pb-207 will change because as these isotopes are end-products of uranium decay. This makes the amount of lead and uranium change. The higher the uranium-to-lead ratio of a rock, the more the Pb-206/Pb-204 and Pb-207/Pb-204 values will change with time. Now, supposing that the source of the Solar system was also uniformly distributed with uranium isotopes, then you can draw a data line showing a lead-to-uranium plot and, from the slope of the line, the amount of time which has passed since the pool of matter became separated into individual objects can be computed.
Bertram Boltwood applied this method of dating to 26 different samples of rocks, and discovered that they had been formed between 92 and 570 million years old, and further refinements to the technique gave ages between 250 million to 1.3 billion years.
Geologists set about exploring the Earth, seeking the oldest rock formations on the planet. The oldest surface rock is found in Canada, Australia and Africa, with ages ranging from 2.5 to 3.8 billion years. The very oldest rock was discovered in Canada in 1999, and estimated to be just over 4 billion years old.
This set a minimum age for the Earth, but thanks to geologic processes like weathering and plate tectonics, it could still be older.
Meteorites as the Final Answer to the Age of the Earth
The problem with measuring the age of rocks on Earth is that the planet is under constant geological change. Plate tectonics constantly recycle portions of the Earth, blending it up and forever hiding the oldest regions of the planet. But assuming that everything in the Solar System formed at the same time, meteorites in space have been unaffected by weathering and plate tectonics here on Earth.
Geologists used these pristine objects, such as the Canyon Diablo meteorite (the fragments of the asteroid that impacted at Barringer Crater) as a way to get at the true age of the Solar System, and therefore the Earth. By using the radiometric dating system on these meteorites, geologists have been able to determine that the Earth is 4.54 billion years old within a margin of error of about 1%.
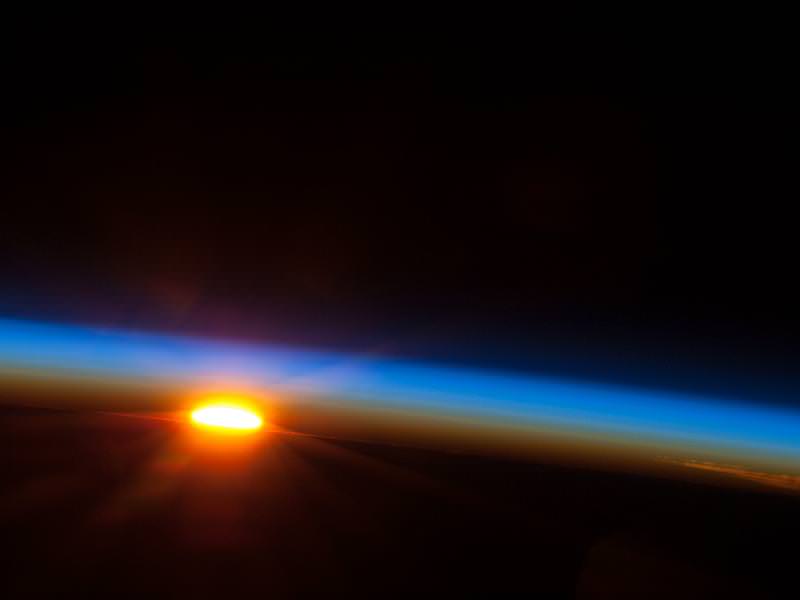
The Sun is about to come up over the South Pacific Ocean in this colorful scene photographed by one of the Expedition 35 crew members aboard the International Space Station between 4 and 5 a.m. local time, May 5, 2013. Credit: NASA
Today’s NASA Image of the Day is just plain pretty; pretty as a postcard. All it is missing is the “Wish you were here!” sentiments.
If you couldn’t tell, we love time-lapse videos… whether they’re made of photos looking up at the sky from Earth or looking down at Earth from the sky! This latest assembly by photographer Bruce W. Berry takes us on a tour around the planet from orbit, created from images taken by astronauts aboard the International Space Station and expertly de-noised, stabilized and smoothed to 24 frames per second. The result is — like several others before — simply stunning, a wonderful reminder of our place in space and the beauty of our living world.
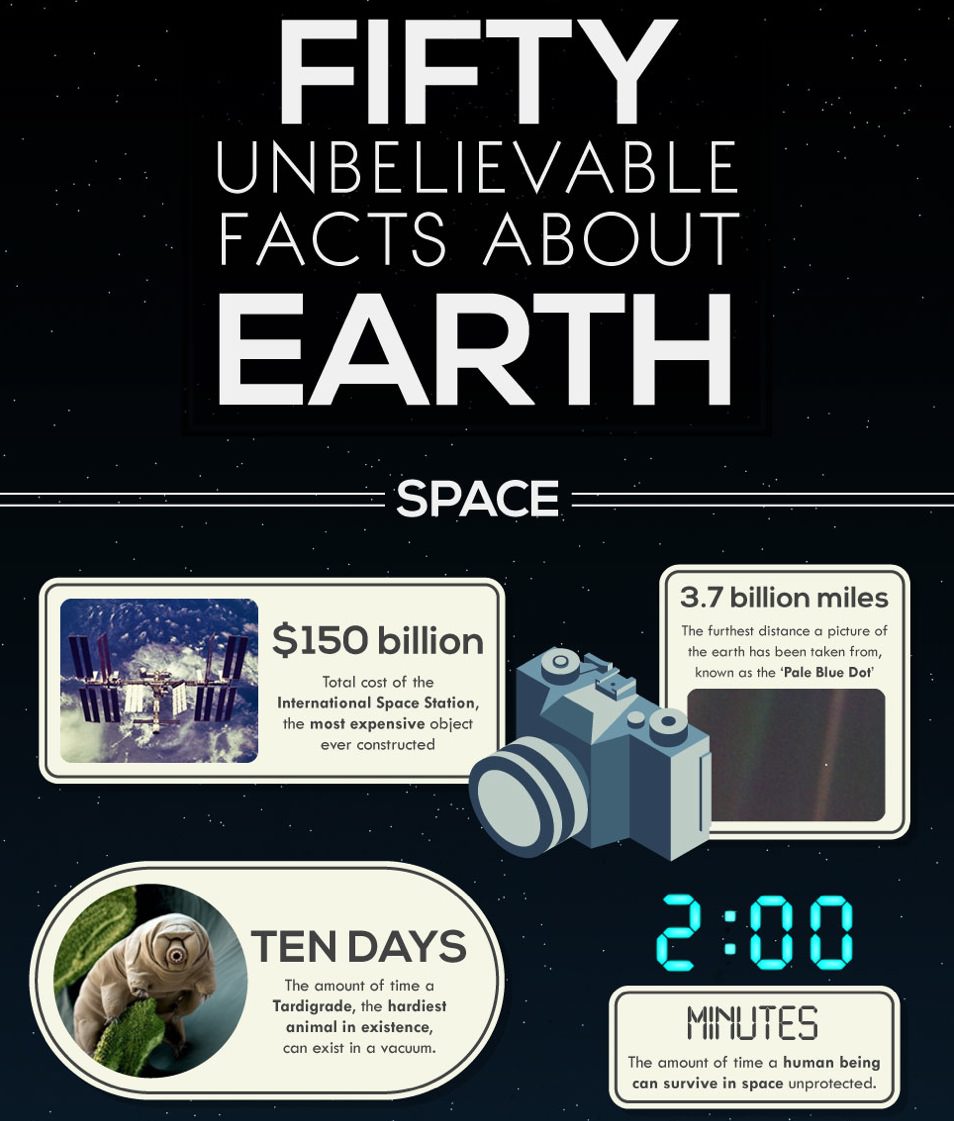
Do you know how much material falls onto Earth from space every day? How many different species there are in the ocean? How far the continents move every year? In honor of Earth Day here’s a very cool infographic that answers those questions about our planet — and 47 more!
Check out the full version below:
And for more interesting information about our planet, click here and here.
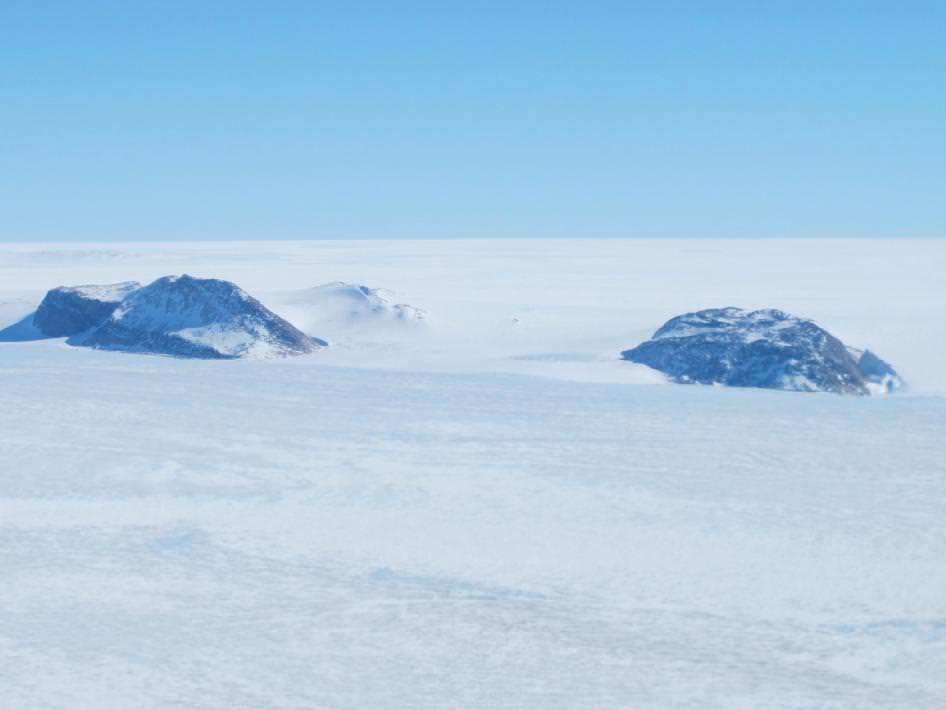
Nunataks in the western portion of the Greenland ice sheet seen from the NASA P-3B during an IceBridge survey of southwestern Greenland on Apr. 8, 2013. Nunataks are areas of exposed rock in an ice sheet such as ridges or mountain peaks. These jagged rock formations are sometimes used as landmarks on an ice sheet. Credit: NASA / Jim Yungel.
Here’s a view you don’t often see: Greenland’s glaciers from 500 meters above the ice. But this new video from NASA’s Operation IceBridge — recorded on April 9, 2013 — shows areas of southeast Greenland using a cockpit camera, revealing what the pilots see as they fly NASA’s P-3B airborne laboratory low over the Arctic. Following a glacier’s sometimes winding flow line gives IceBridge researchers a perspective on the ice not possible from satellites which pass in straight lines overhead. By gathering such data, IceBridge is helping to build a continuous record of change in the polar regions.
The plane allows researchers to images Earth’s polar ice in unprecedented detail to better understand processes that connect the polar regions with the global climate system. IceBridge utilizes a highly specialized fleet of research aircraft and the most sophisticated suite of innovative science instruments ever assembled to characterize annual changes in thickness of sea ice, glaciers, and ice sheets. In addition, IceBridge collects critical data used to predict the response of earth’s polar ice to climate change and resulting sea-level rise. IceBridge also helps bridge the gap in polar observations between NASA’s ICESat satellite missions.
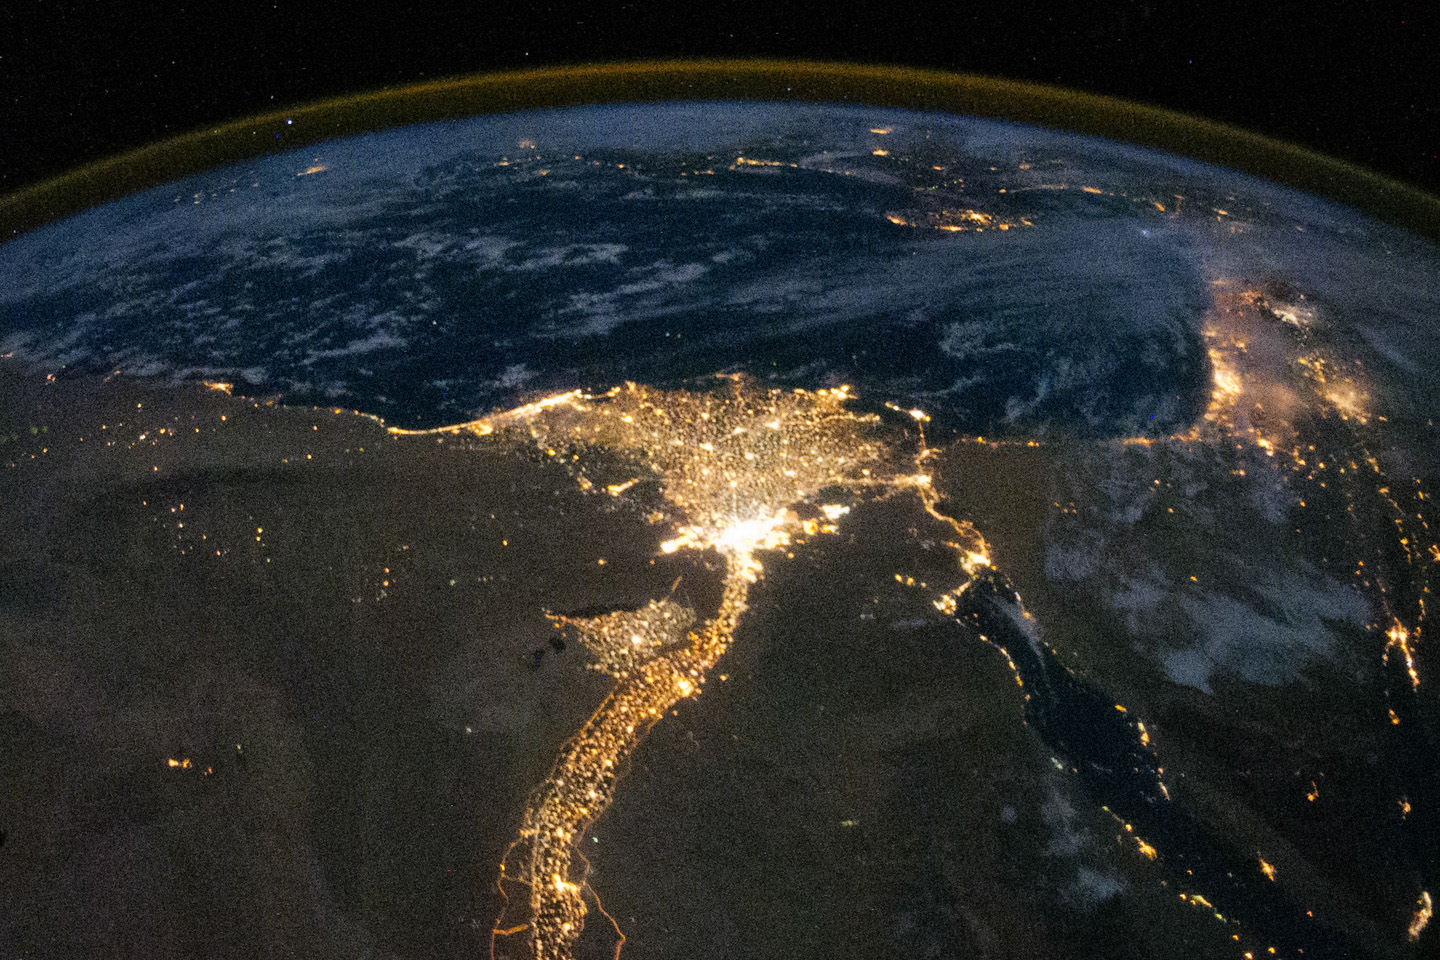
Nighttime photo of the Nile delta region taken from the ISS (NASA)
Enjoy some great views of our home planet from images taken from the orbiting Earth-observing satellites and taken by astronauts on the International Space Station. The satellites and scientists are cranking out data 24/7 to help us all better understand and sustain our home planet.
Above is a video created for Earth Month, and specifically Earth Day (April 22) from ISS imagery, and below is another video from satellite imagery. These are unique looks at the beauty and wonder of our home planet.


 William Thompson, later known as Lord Kelvin, assumed that the Earth was once a molten ball of rock with the same temperature of the Sun, and then has been cooling ever since. Based on these assumptions, Thompson calculated that the Earth took somewhere between 20 and 400 million years to cool to its current temperature. Of course, Thompson made several inaccurate assumptions, about the temperature of the Sun (it’s really 15 million degrees Kelvin at its core), the temperature of the Earth (with its molten core) and how the Sun is made of hydrogen and the Earth is made of rock and metal.