Is the Sun More Active Than it Looks? An Innovative Method to Characterize the Solar Cycle

A solar cycle montage from August 1991 to September 2001 in X-rays courtesy of the Yohkoh Solar Observatory. (Credit: David Chenette, Joseph B. Gurman, Loren W. Acton, image in the public Domain).

The Sun has provided no shortage of mysteries thus far during solar cycle #24.

And perhaps the biggest news story that the Sun has generated recently is what it isn’t doing. As Universe Today recently reported, this cycle has been an especially weak one in terms of performance. The magnetic polarity flip signifying the peak of the solar maximum is just now upon us, as the current solar cycle #24 got off to a late start after a profound minimum in 2009…

Or is it?

Exciting new research out of the University of Michigan in Ann Arbor’s Department of Atmospheric, Oceanic and Space Sciences published in The Astrophysical Journal this past week suggests that we’re only looking at a portion of the puzzle when it comes to solar cycle activity.

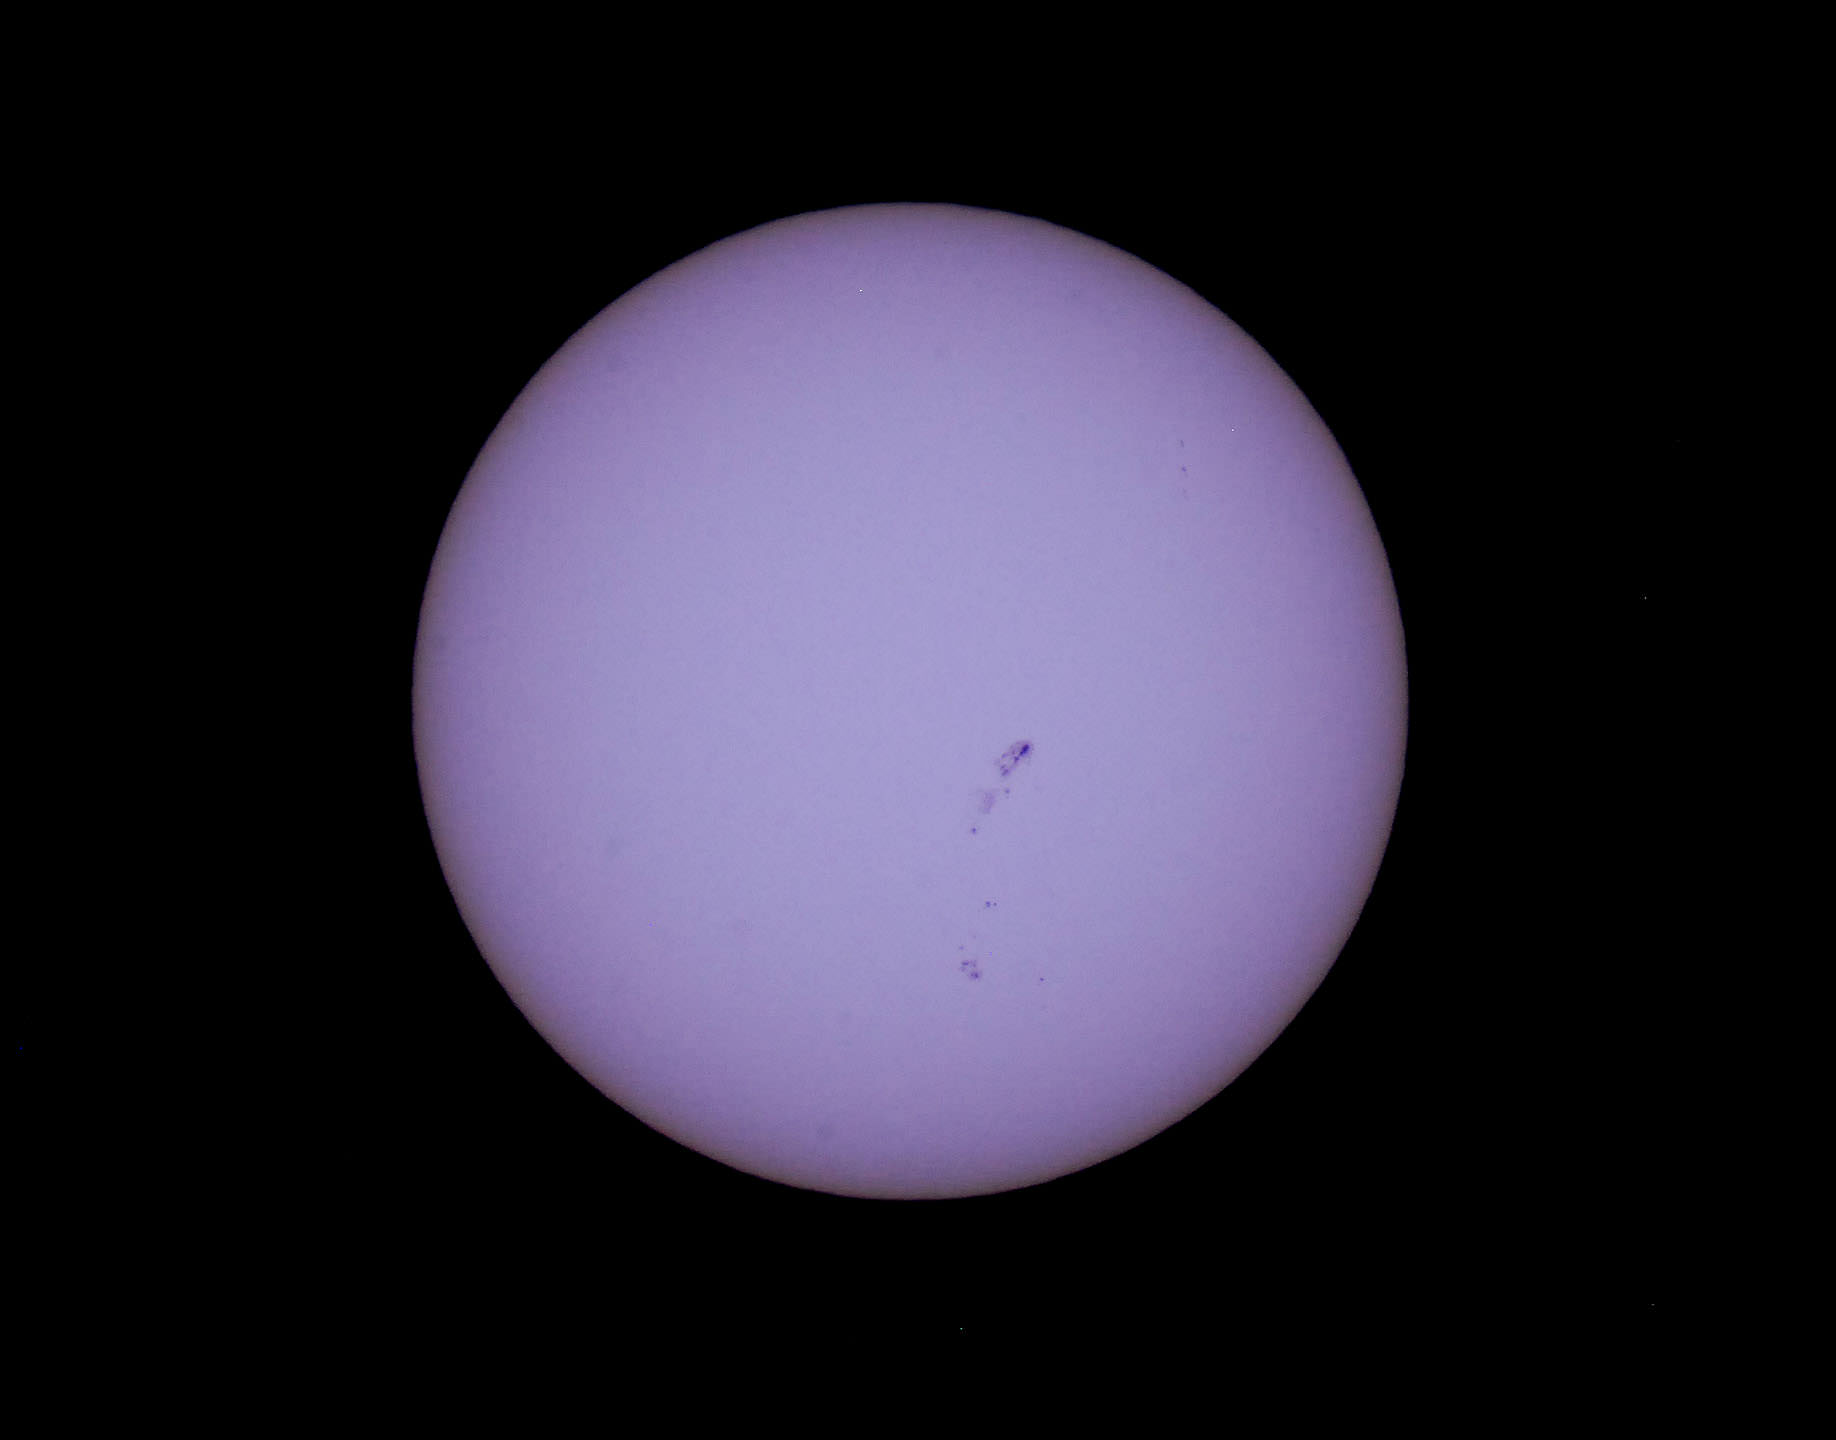
Traditional models rely on the monthly averaged sunspot number. This number correlates a statistical estimation of the number of sunspots seen on the Earthward facing side of the Sun and has been in use since first proposed by Rudolf Wolf in 1848. That’s why you also hear the relative sunspot number sometimes referred to as the Wolf or Zürich Number.

But sunspot numbers may only tell one side of the story. In their recent paper titled Two Novel Parameters to Evaluate the Global Complexity of the Sun’s Magnetic Field and Track the Solar Cycle, researchers Liang Zhao, Enrico Landi and Sarah E. Gibson describe a fresh approach to model solar activity via looking at the 3-D dynamics heliospheric current sheet.

The spiralling curve of the heliospheric current sheet through the inner solar system. (Graphic credit: NASA).
The spiraling curve of the heliospheric current sheet through the inner solar system. (Graphic credit: NASA).

The heliospheric current sheet (or HCS) is the boundary of the Sun’s magnetic field separating the northern and southern polarity regions which extends out into the solar system. During the solar minimum, the sheet is almost flat and skirt-like. But during solar maximum, it’s tilted, wavy and complex.

Two variables, known as SD & SL were used by researchers in the study to produce a measurement that can characterize the 3-D complexity of the HCS.  “SD is the standard deviation of the latitudes of the HCS’s position on each of the Carrington maps of the solar surface, which basically tells us how far away the HCS is distributed from the equator. And SL is the integral of the slope of HCS on that map, which can tell us how wavy the HCS is on each of the map,” Liang Zhao told Universe Today.

Ground and space-based observations of the Sun’s magnetic field exploit a phenomenon known as the Zeeman Effect, which was first demonstrated during solar observations conducted by George Ellery Hale using his new fangled invention of the spectrohelioscope in 1908. For the recent study, researchers used data covering a period from 1975 through 2013 to characterize the HCS data available online from the Wilcox Solar Observatory.

SD and SL perameters juxtaposed against the tradional monthly sunspot number.
SD and SL parameters juxtaposed against the traditional monthly sunspot number (SSN). Note the smooth fit until the end of solar cycle #23 around 2003. (Credit: Liang Zhao/The Astrophysical Journal).

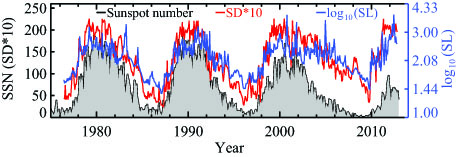
Comparing the HCS value against previous sunspot cycles yields some intriguing results. In particular, comparing the SD and SL values with the monthly sunspot  number provide a “good fit” for the previous three solar cycles— right up until cycle #24.

“Looking at the HCS, we can see that the Sun began to act strange as early as 2003,” Zhao said. “This current cycle as characterized by the monthly sunspot number started a year late, but in terms of HCS values, the maximum of cycle #24 occurred right on time, with a first peak in late 2011.”

“Scientists believe there will be two peaks in the sunspot number in this solar maximum as in the previous maximum (in ~2000 and ~2002),” Zhao continued, “since the Sun’s magnetic fields in the north and south hemispheres look asymmetric, and the north evolved faster than the south recently. But so far as I can see, the highest value of monthly-averaged sunspot number in this cycle 24 is still the one in the November 2011. So we can say the first peak of cycle 24 could be in November of 2011, since it is the highest monthly sunspot number so far in this cycle. If there is a second peak, we will see it sooner or later.”

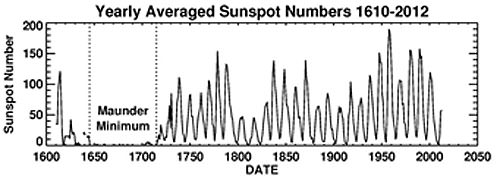
The paper also notes that although cycle 24 is especially weak when compared to recent cycles, its range of activity is not unique when compared with solar cycles over the past 260 years.

HCS curves plotted on the surface of the Sun.
HCS curves plotted on the surface of the Sun. Comparisons are made for the solar maximum on October 2000 (CR 1968), descending phase on April 2005 (2029), solar minimum on September 2009 (CR 2087), and ascending phase on March 2010 (CR2094). CR=Carrington Rotation. (Credit: Liang Zhao, The Astrophysical Journal).

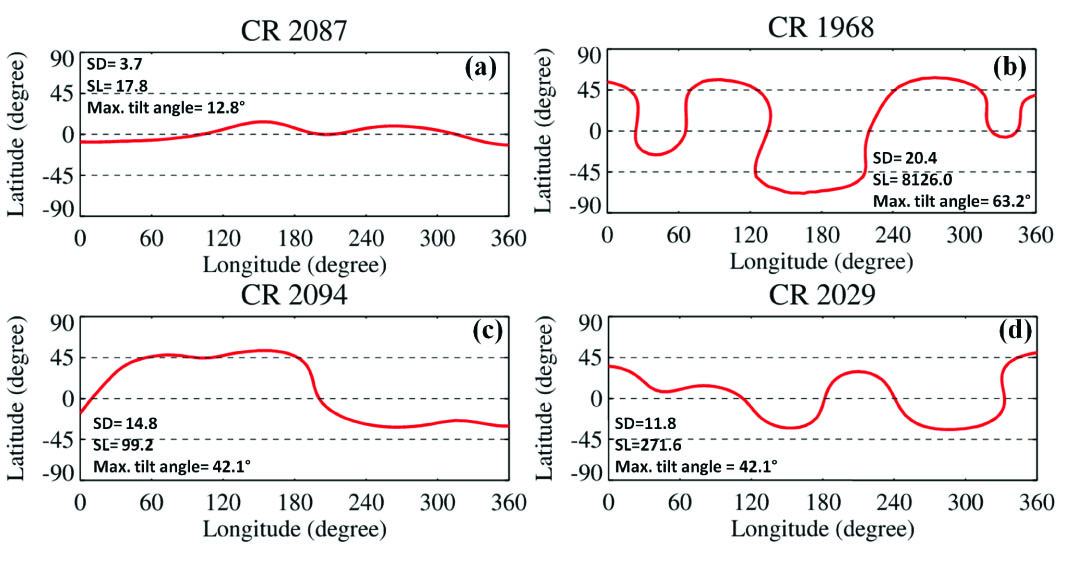
The HCS value characterizes the Sun over one complete Carrington Rotation of 27 days. This is an averaged value for the rotation of the Sun, as the poles rotate slower than the equatorial regions.

The approximately 22 year span of time that it takes for the poles to reverse back to the same polarity again is equal to two average 11 year sunspot cycles. The Sun’s magnetic field has been exceptionally asymmetric during this cycle, and as of this writing, the Sun has already finished its reversal of the north pole first.

This sort of asymmetry during an imminent pole reversal was first recorded during solar cycle 19, which spanned 1954-1964. Solar cycles are numbered starting from observations which began in 1749, just four decades after the end of the 70-year Maunder Minimum.

“This is an exciting time to study the magnetic field of the Sun, as we may be witnessing a return to a less-active type of cycle, more like those of 100 years ago,” NCAR/HAO senior scientist and co-author Sarah Gibson said.

A massive sunspot group that rotated into view in early July, 2013... one of the largest seen for solar cycle #24 thus far. (Credit: NASA/SDO).
A massive sunspot group that rotated into view in early July, 2013, one of the largest seen for solar cycle #24 thus far. (Credit: NASA/SDO).

But this time, an armada of space and ground-based observatories will scrutinize our host star like never before. The SOlar Heliospheric Observatory (SOHO) has already followed the Sun through the equivalent of one complete solar cycle— and it has now been joined in space by STEREO A & B, JAXA’s Hinode, ESA’s Proba-2 and NASA’s Solar Dynamics Observatory. NASA’s Interface Region Imaging Spectrograph (IRIS) was also launched earlier this year and has just recently opened for business.

Will there be a second peak following the magnetic polarity reversal of the Sun’s south pole, or is Cycle #24 about to “leave the building?” And will Cycle #25 be absent all together, as some researchers suggest? What role does the solar cycle play in the complex climate change puzzle? These next few years will prove to be exciting ones for solar science, as the predictive significance of HCS SD & SL values are put to the test… and that’s what good science is all about!

-Read the abstract with a link to the full paper in The Astrophysical Journal by University of Michigan researchers here.

Solar Cycle #24: On Track to be the Weakest in 100 Years

Projected vs observed sunspot numbers for solar cycles #23 & #24. (Credit: Hathaway/NASA/MSFC).

Our nearest star has exhibited some schizophrenic behavior thus far for 2013.

By all rights, we should be in the throes of a solar maximum, an 11-year peak where the Sun is at its most active and dappled with sunspots.

Thus far though, Solar Cycle #24 has been off to a sputtering start, and researchers that attended the meeting of the American Astronomical Society’s Solar Physics Division earlier this month are divided as to why.“Not only is this the smallest cycle we’ve seen in the space age, it’s the smallest cycle in 100 years,” NASA/Marshall Space Flight Center research scientist David Hathaway said during a recent press teleconference conducted by the Marshall Space Flight Center.

Cycle #23 gave way to a profound minimum that saw a spotless Sol on 260 out of 365 days (71%!) in 2009. Then, #Cycle 24 got off to a late start, about a full year overdue — we should have seen a solar maximum in 2012, and now that’s on track for the late 2013 to early 2014 time frame. For solar observers, both amateur, professional and automated, it seems as if the Sun exhibits a “split-personality” this year, displaying its active Cycle #24-self one week, only to sink back into a blank despondency the next.

This new cycle has also been asymmetrical as well. One hallmark heralding the start of a new cycle is the appearance of sunspots at higher solar latitudes on the disk of the Sun. These move progressively toward the Sun’s equatorial regions as the cycle progresses, and can be mapped out in what’s known as a Spörer’s Law.

The sunspot number "butterfly" graph, illustrating Spörer's Law that susnpots gradually migrate towards the equator of the Sun as the solar cycle progresses. (Credit: NASA/MSFC).
The sunspot number “butterfly” graph, illustrating Spörer’s Law that susnpots gradually migrate towards the equator of the Sun as the solar cycle progresses. (Credit: NASA/MSFC).

But the northern hemisphere of the Sun has been much more active since 2006, with the southern hemisphere experiencing a lag in activity. “Usually this asymmetry lasts a year or so, and then the hemispheres synchronize,” said Giuliana de Toma of the High Altitude Observatory.

So far, several theories have been put forth as to why our tempestuous star seems to be straying from its usual self. Along with the standard 11-year cycle, it’s thought that there may be a longer, 100 year trend of activity and subsidence known as the Gleissberg Cycle.

The Sun is a giant ball of gas, rotating faster (25 days) at the equator than at the poles, which rotate once every 34.5 days. This dissonance sets up a massive amount of torsion, causing the magnetic field lines to stretch and snap, releasing massive amounts of energy. The Sun also changes polarity with every sunspot cycle, another indication that a new cycle is underway.

But predictions have run the gamut for Cycle #24. Recently, solar scientists have projected a twin peaked solar maximum for later this year, and thus far, Sol seems to be following this modified trend.  Initial predictions by scientists at the start of Cycle #24 was for the sunspot number to have reached 90 by August 2013; but here it is the end of July, and we’re sitting at 68, and it seems that we’ll round out the northern hemisphere Summer at a sunspot number of 70 or so.

Some researchers predict that the following sunspot Cycle #25 may even be absent all together.

“If this trend continues, there will be almost no spots in Cycle 25,” Noted Matthew Penn of the National Solar Observatory, hinting that we may be on the edge of another Maunder Minimum.

Looking back over solar cycles for the past 500 years. (Credit: D. Hathaway/NASA/MSFC).

The Maunder Minimum was a period from 1645 to 1715 where almost no sunspots were seen. This span of time corresponded to a medieval period known as the Little Ice Age. During this era, the Thames River in London froze, making Christmas “Frost Fairs” possible on the ice covered river. Several villages in the Swiss Alps were also consumed by encroaching glaciers, and the Viking colony established in Greenland perished. The name for the period comes from Edward Maunder, who first noted the minimum in papers published in the 1890s. The term came into modern vogue after John Eddy published a paper on the subject in the journal of Science in 1976. Keep in mind, the data from the period covered by the Maunder Minimum is far from complete— Galileo had only started sketching sunspots via projection only a few decades prior to the start of the Maunder Minimum. But tellingly, there was a span of time in the early 18th century when many researchers supposed that sunspots were a myth! They were really THAT infrequent…

Just what role a pause in the solar cycle might play in the climate change debate remains to be seen. Perhaps, humanity is getting a brief (and lucky) reprieve, a chance to get serious about controlling our own destiny and doing something about anthropogenic climate-forcing. On a more ominous note, however, an extended cooling phase may give us reason to stall on preparing for the inevitable while giving ammunition to deniers, who like to cite natural trends exclusively.

Down but not out? Sol looking more like its solar max-self earlier this month on July 8th. (Photo by author).

Whatever occurs, we now have an unprecedented fleet of solar monitoring spacecraft on hand to watch the solar drama unfold. STEREO A & B afford us a 360 degree view of the Sun. SOHO has now monitored the Sun for the equivalent of more than one solar cycle, and NASA’s Solar Dynamics Observatory has joined it in its scrutiny. NASA’s Interface Region Imaging Spectrograph (IRIS)  just launched earlier this year, and has already begun returning views of the solar atmosphere in unprecedented detail. Even spacecraft such as MESSENGER orbiting Mercury can give us vital data from other vantage points in the solar system.

Cycle #24 may be a lackluster performer, but I’ll bet the Sun has a few surprises in store. You can always get a freak cloud burst, even in the middle of a drought. Plus, we’re headed towards northern hemisphere Fall, a time when aurora activity traditionally picks up.

Be sure to keep a (safely filtered) eye on ol’ Sol— it may be the case over these next few years that “no news is big news!”