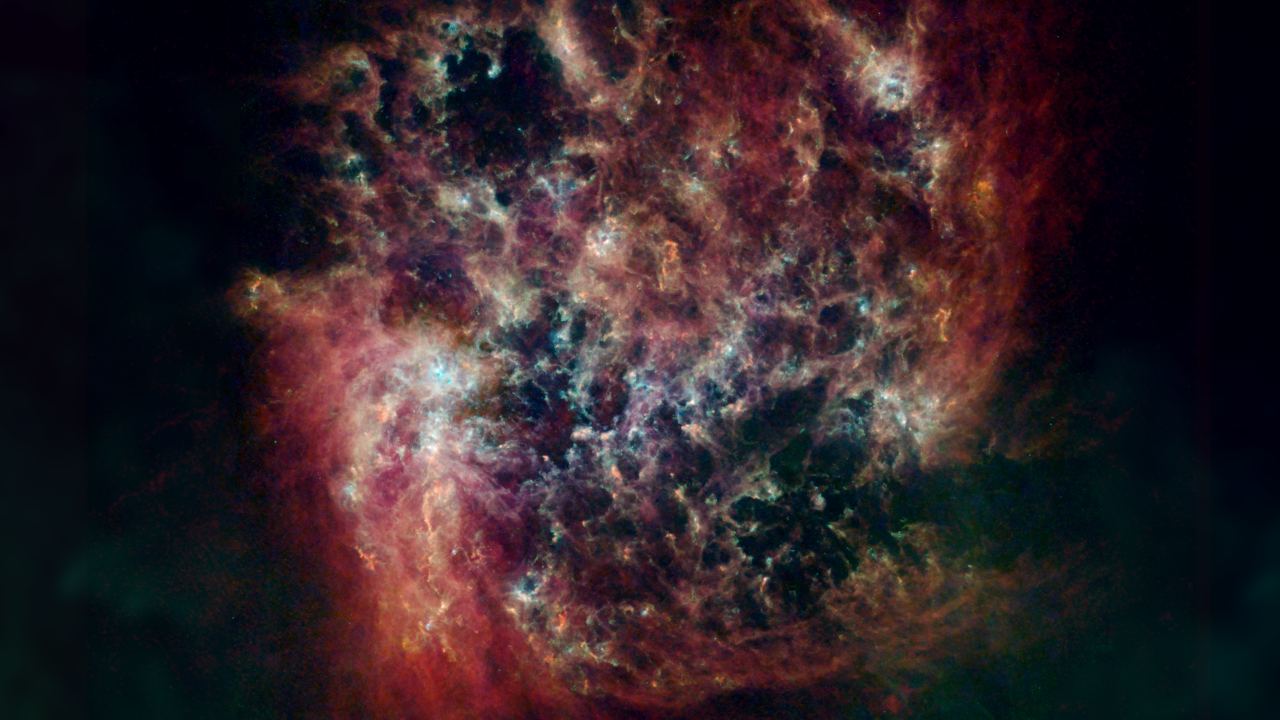
The Large Magellanic Cloud, as seen by the Herschel Space Telescope, Planck, COBE and IRAS. Credit: ESA and NASA.
ESA and NASA dusted off some old data from four retired space telescopes and combined forces to reveal new images of the four galaxies that our closest to our own Milky Way galaxy. One thing is common among the four new images: they are full of dust!
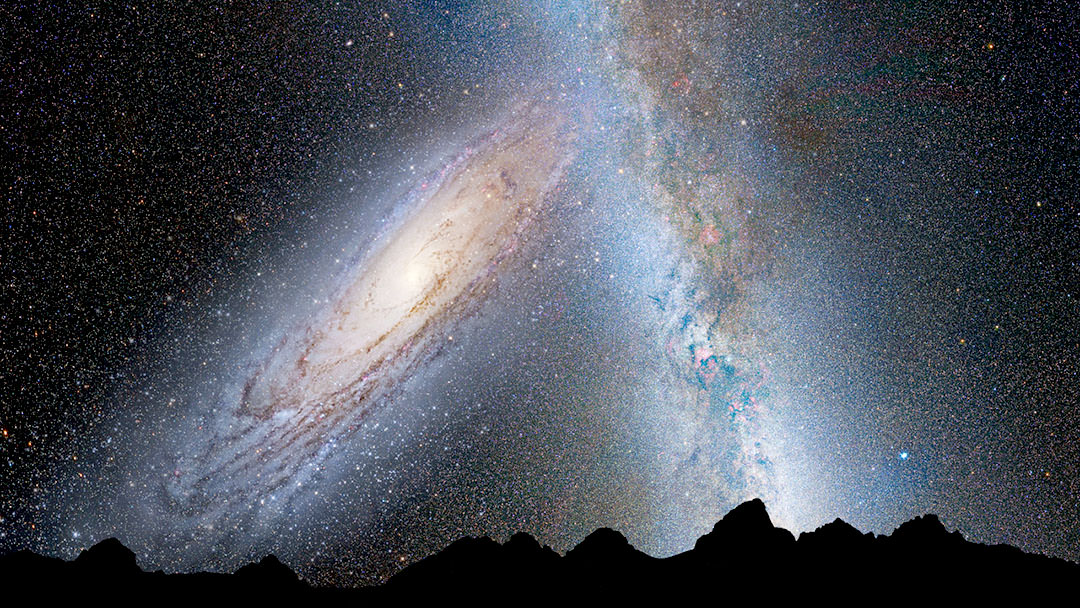
Is there an up out there? New research says no. Out there in the universe, one direction is much like another. Credit: NASA; ESA; Z. Levay and R. van der Marel, STScI; T. Hallas; and A. Mellinger
Direction is something we humans are pretty accustomed to. Living in our friendly terrestrial environment, we are used to seeing things in term of up and down, left and right, forwards or backwards. And to us, our frame of reference is fixed and doesn’t change, unless we move or are in the process of moving. But when it comes to cosmology, things get a little more complicated.
For a long time now, cosmologists have held the belief that the universe is homogeneous and isotropic – i.e. fundamentally the same in all directions. In this sense, there is no such thing as “up” or “down” when it comes to space, only points of reference that are entirely relative. And thanks to a new study by researchers from the University College London, that view has been shown to be correct.
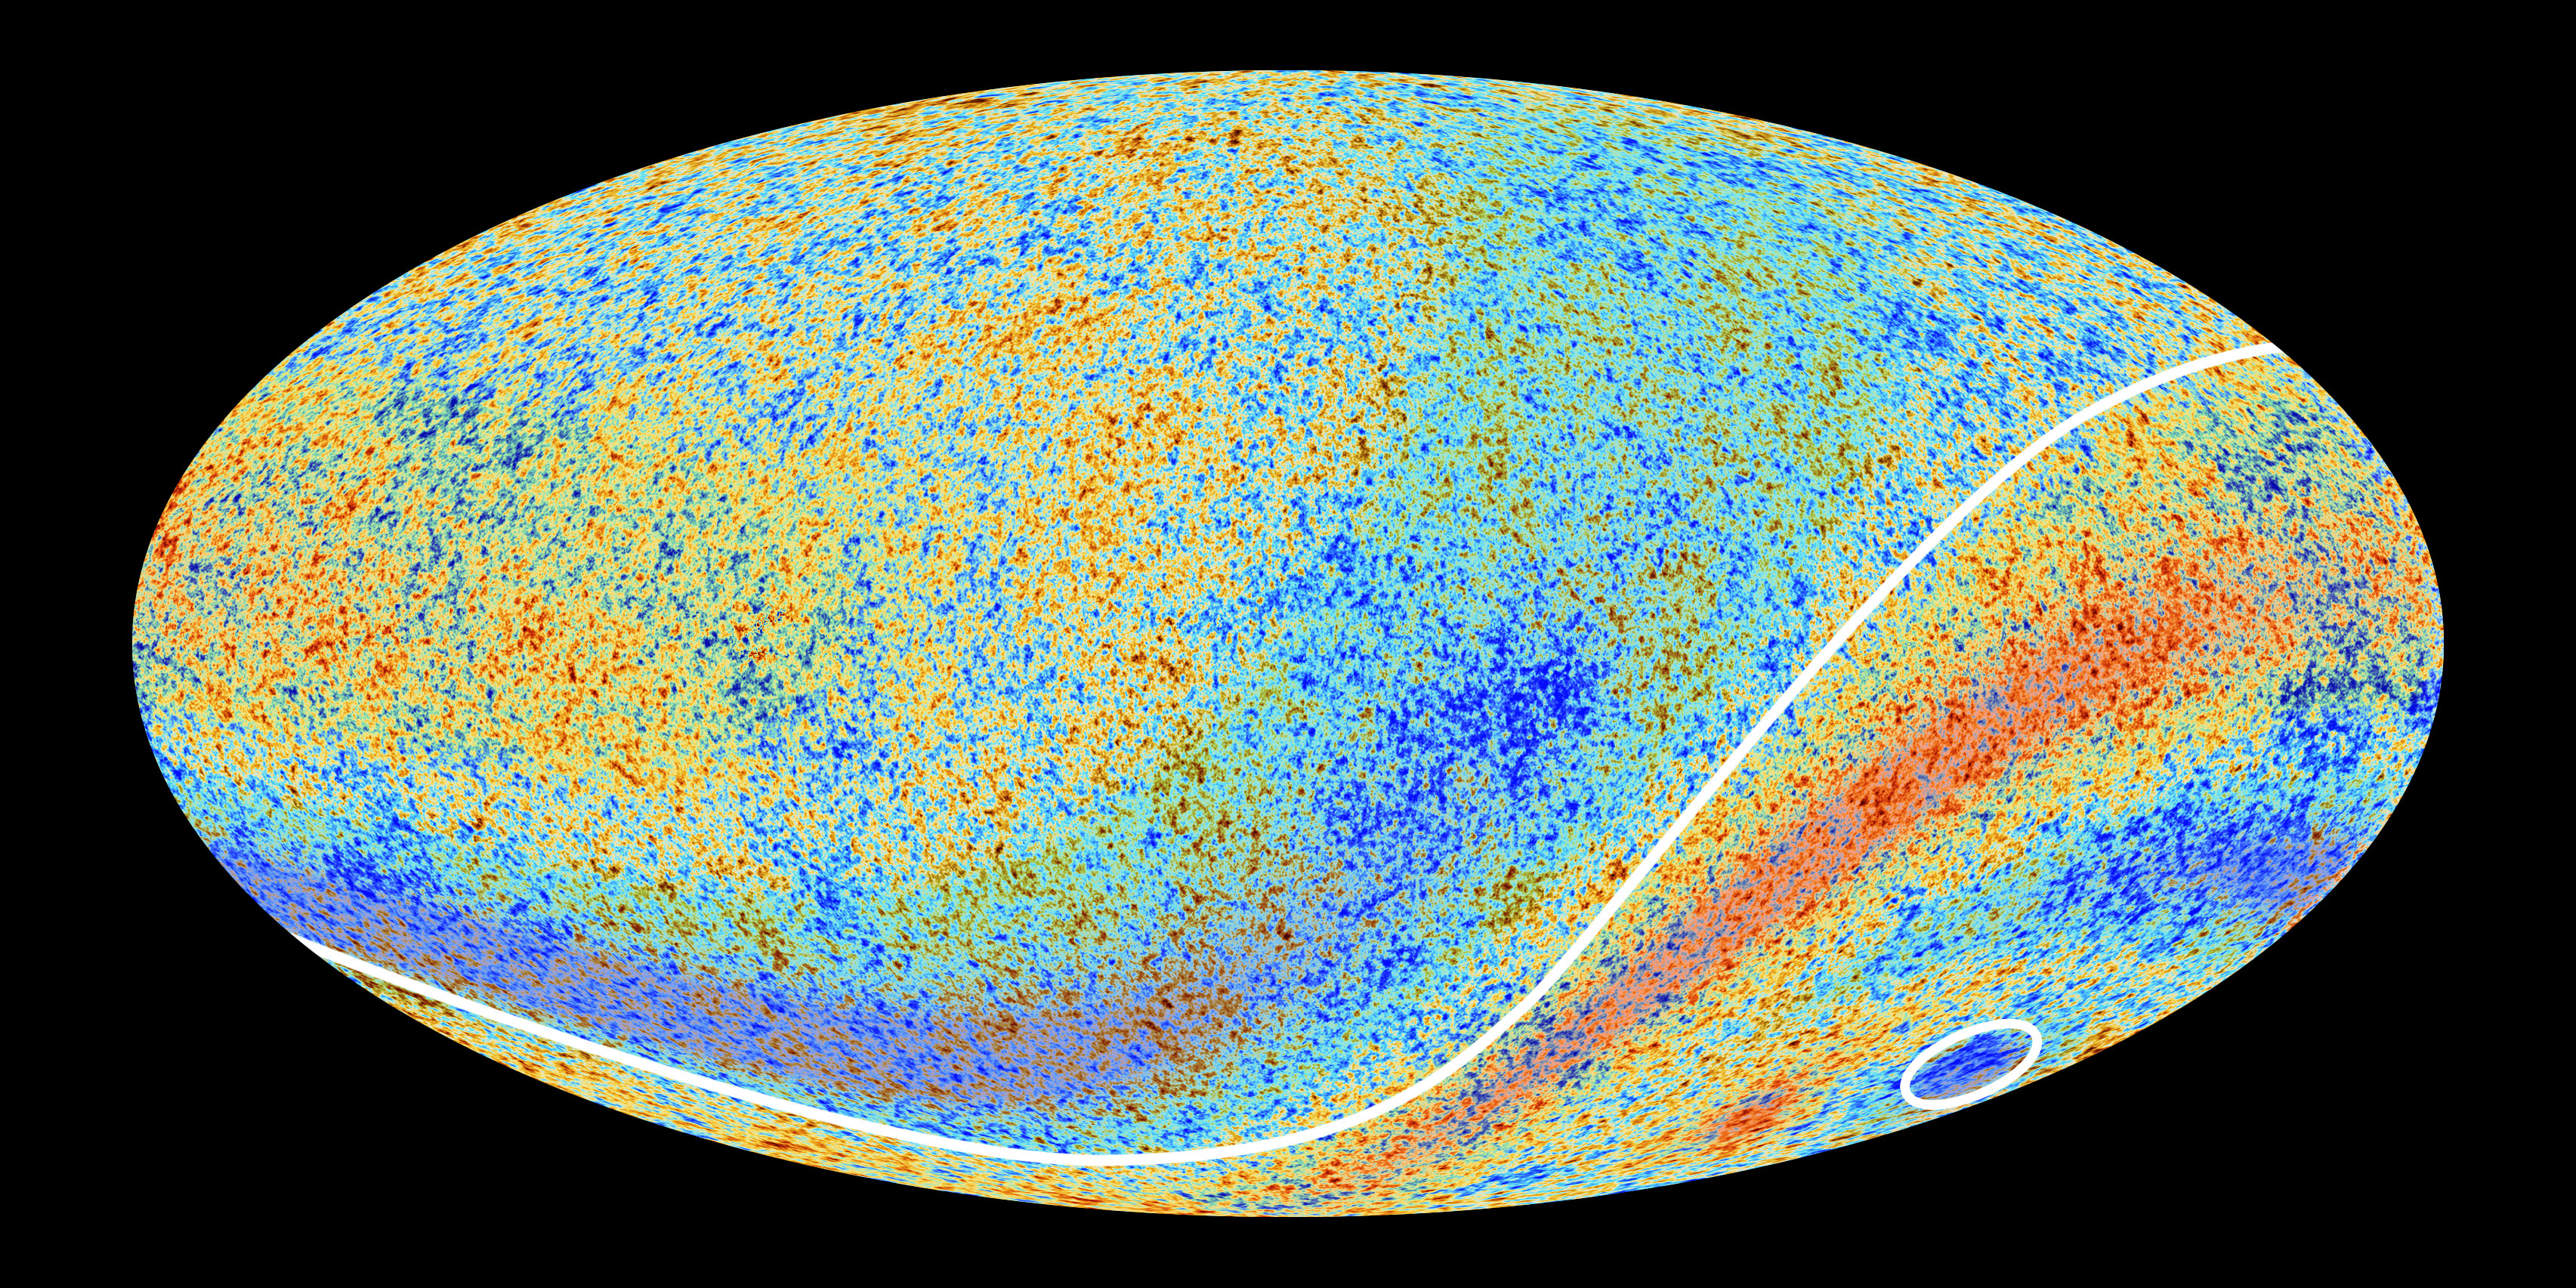
For the sake of their study, titled “How isotropic is the Universe?“, the research team used survey data of the Cosmic Microwave Background (CMB) – the thermal radiation left over from the Big Bang. This data was obtained by the ESA’s Planck spacecraft between 2009 and 2013.
The cosmic microwave background radiation, enhanced to show the anomalies. Credit: ESA and the Planck Collaboration
The team then analyzed it using a supercomputer to determine if there were any polarization patterns that would indicate if space has a “preferred direction” of expansion. The purpose of this test was to see if one of the basic assumptions that underlies the most widely-accepted cosmological model is in fact correct.
The first of these assumptions is that the Universe was created by the Big Bang, which is based on the discovery that the Universe is in a state of expansion, and the discovery of the Cosmic Microwave Background. The second assumption is that space is homogenous and istropic, meaning that there are no major differences in the distribution of matter over large scales.
This belief, which is also known as the Cosmological Principle, is based partly on the Copernican Principle (which states that Earth has no special place in the Universe) and Einstein’s Theory of Relativity – which demonstrated that the measurement of inertia in any system is relative to the observer.
This theory has always had its limitations, as matter is clearly not evenly distributed at smaller scales (i.e. star systems, galaxies, galaxy clusters, etc.). However, cosmologists have argued around this by saying that fluctuation on the small scale are due to quantum fluctuations that occurred in the early Universe, and that the large-scale structure is one of homogeneity.
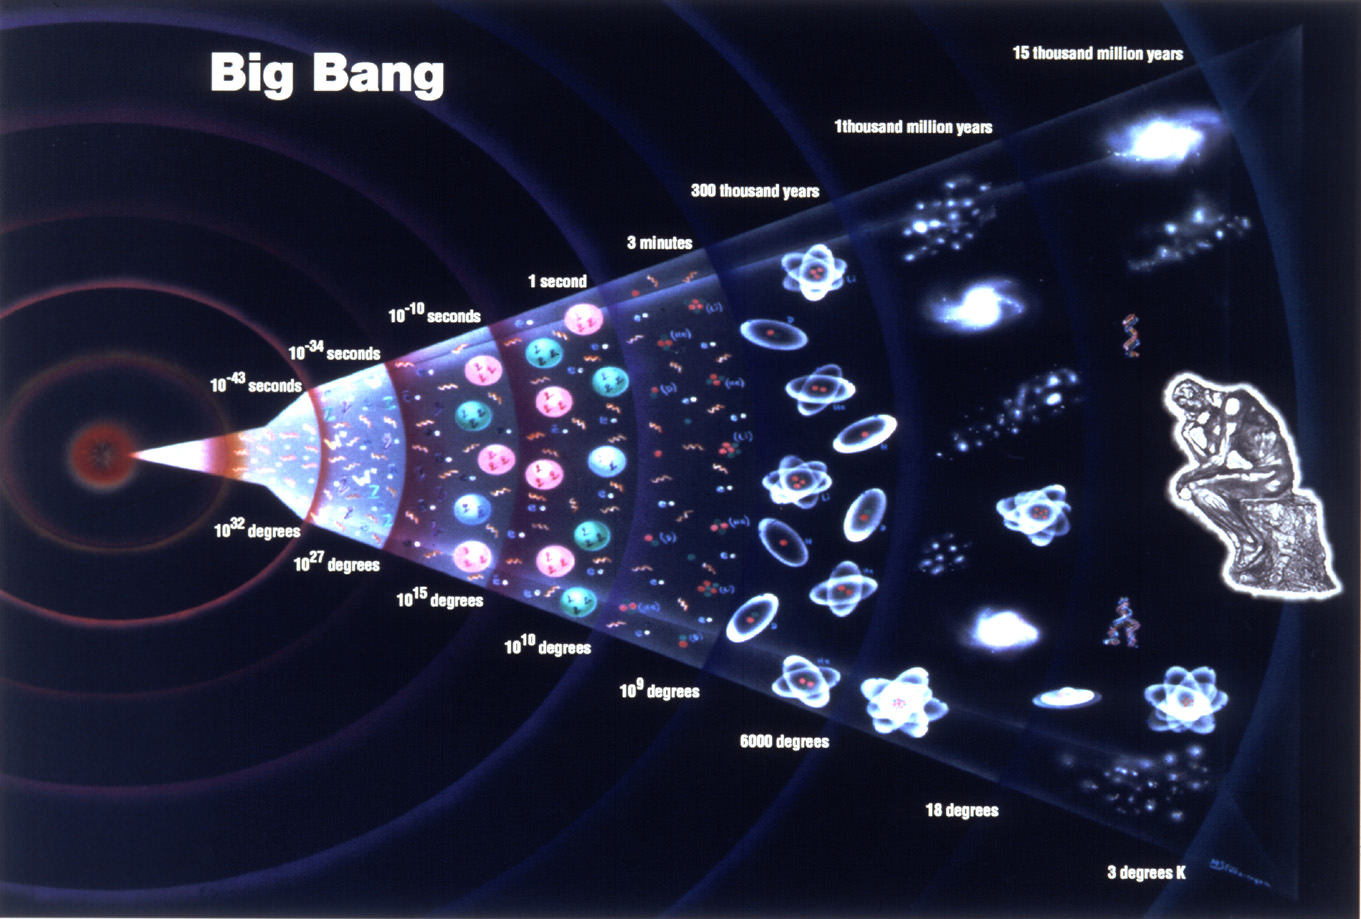
Timeline of the Big Bang and the expansion of the Universe. Credit: NASA
By looking for fluctuations in the oldest light in the Universe, scientists have been attempting to determine if this is in fact correct. In the past thirty years, these kinds of measurements have been performed by multiple missions, such as the Cosmic Background Explorer (COBE) mission, the Wilkinson Microwave Anisotropy Probe (WMAP), and the Planck spacecraft.
For the sake of their study, the UCL research team – led by Daniela Saadeh and Stephen Feeney – looked at things a little differently. Instead of searching for imbalances in the microwave background, they looked for signs that space could have a preferred direction of expansion, and how these might imprint themselves on the CMB.
As Daniela Saadeh – a PhD student at UCL and the lead author on the paper – told Universe Today via email:
“We analyzed the temperature and polarization of the cosmic microwave background (CMB), a relic radiation from the Big Bang, using data from the Planck mission. We compared the real CMB against our predictions for what it would look like in an anisotropic universe. After this search, we concluded that there is no evidence for these patterns and that the assumption that the Universe is isotropic on large scales is a good one.”
Basically, their results showed that there is only a 1 in 121 000 chance that the Universe is anisotropic. In other words, the evidence indicates that the Universe has been expanding in all directions uniformly, thus removing any doubts about their being any actual sense of direction on the large-scale.
A “now and then” all-sky image captured by the Planck spacecraft, simultaneously showing our galaxy and its structures seen as in recent history; and ‘then’ – the red afterglow of the Big Bang seen as it was just 380,000 years later. Credit: ESA
And in a way, this is a bit disappointing, since a Universe that is not homogenous and the same in all directions would lead to a set of solutions to Einstein’s field equations. By themselves, these equations do not impose any symmetries on space time, but the Standard Model (of which they are part) does accept homogeneity as a sort of given.
These solutions are known as the Bianchi models, which were proposed by Italian mathematician Luigi Bianchi in the late 19th century. These algebraic theories, which can be applied to three-dimensional spacetime, are obtained by being less restrictive, and thus allow for a Universe that is anisotropic.
On the other hand, the study performed by Saadeh, Feeney, and their colleagues has shown that one of the main assumptions that our current cosmological models rest on is indeed correct. In so doing, they have also provided a much-needed sense of closer to a long-term debate.
“In the last ten years there has been considerable discussion around whether there were signs of large-scale anisotropy lurking in the CMB,” said Saadeh. “If the Universe were anisotropic, we would need to revise many of our calculations about its history and content. Planck high-quality data came with a golden opportunity to perform this health check on the standard model of cosmology and the good news is that it is safe.”
So the next time you find yourself looking up at the night sky, remember… that’s a luxury you have only while you’re standing on Earth. Out there, its a whole ‘nother ballgame! So enjoy this thing we call “direction” when and where you can.
And be sure to check out this animation produced by the UCL team, which illustrates the Planck mission’s CMB data:
The Big Bang Theory: A history of the Universe starting from a singularity and expanding ever since. Credit: grandunificationtheory.com
How was our Universe created? How did it come to be the seemingly infinite place we know of today? And what will become of it, ages from now? These are the questions that have been puzzling philosophers and scholars since the beginning the time, and led to some pretty wild and interesting theories. Today, the consensus among scientists, astronomers and cosmologists is that the Universe as we know it was created in a massive explosion that not only created the majority of matter, but the physical laws that govern our ever-expanding cosmos. This is known as The Big Bang Theory.
For almost a century, the term has been bandied about by scholars and non-scholars alike. This should come as no surprise, seeing as how it is the most accepted theory of our origins. But what exactly does it mean? How was our Universe conceived in a massive explosion, what proof is there of this, and what does the theory say about the long-term projections for our Universe?
The basics of the Big Bang theory are fairly simple. In short, the Big Bang hypothesis states that all of the current and past matter in the Universe came into existence at the same time, roughly 13.8 billion years ago. At this time, all matter was compacted into a very small ball with infinite density and intense heat called a Singularity. Suddenly, the Singularity began expanding, and the universe as we know it began.
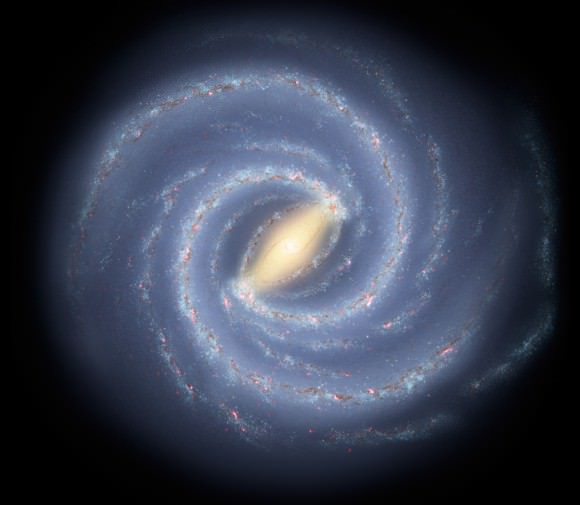
Artist's impression of The Milky Way Galaxy. Based on current estimates and exoplanet data, it is believed that there could be tens of billions of habitable planets out there. Credit: NASA
When you look up into the night sky, it seems like you can see a lot of stars. There are about 2,500 stars visible to the naked eye at any one point in time on the Earth, and 5,800-8,000 total visible stars (i.e. that can be spotted with the aid of binoculars or a telescope). But this is a very tiny fraction of the stars the Milky Way is thought to have!
So the question is, then, exactly how many stars are in the Milky Way Galaxy? Astronomers estimate that there are 100 billion to 400 billion stars contained within our galaxy, though some estimate claim there may be as many as a trillion. The reason for the disparity is because we have a hard time viewing the galaxy, and there’s only so many stars we can be sure are there.
Structure of the Milky Way:
Why can we only see so few of these stars? Well, for starters, our Solar System is located within the disk of the Milky Way, which is a barred spiral galaxy approximately 100,000 light years across. In addition, we are about 30,000 light years from the galactic center, which means there is a lot of distance – and a LOT of stars – between us and the other side of the galaxy.
Artist’s impression of the Milky Way Galaxy. Credit: NASA
To complicate matter further, when astronomers look out at all of these stars, even closer ones that are relatively bright can be washed out by the light of brighter stars behind them. And then there are the faint stars that are at a significant distance from us, but which elude conventional detection because their light source is drowned out by brighter stars or star clusters in their vicinity.
The furthest stars that you can see with your naked eye (with a couple of exceptions) are about 1000 light years away. There are quite a few bright stars in the Milky Way, but clouds of dust and gas – especially those that lie at the galactic center – block visible light. This cloud, which appears as a dim glowing band arching across the night sky – is where our galaxy gets the “milky” in its name from.
It is also the reason why we can only really see the stars in our vicinity, and why those on the other side of the galaxy are hidden from us. To put it all in perspective, imagine you are standing in a very large, very crowded room, and are stuck in the far corner. If someone were to ask you, “how many people are there in here?”, you would have a hard time giving them an accurate figure.
Now imagine that someone brings in a smoke machine and begins filling the center of the room with a thick haze. Not only does it become difficult to see clearly more than a few meters in front of you, but objects on the other side of the room are entirely obscured. Basically, your inability to rise above the crowd and count heads means that you are stuck either making guesses, or estimating based on those that you can see.
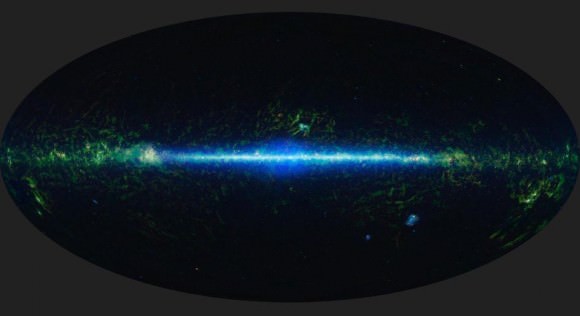
A mosaic of the images covering the entire sky as observed by the Wide-field Infrared Survey Explorer (WISE), part of its All-Sky Data Release. Credit: NASA/JPL
Imaging Methods:
Infrared (heat-sensitive) cameras like the Cosmic Background Explorer (aka. COBE) can see through the gas and dust because infrared light travels through it. And there’s also the Spitzer Space Telescope, an infrared space observatory launched by NASA in 2003; the Wide-field Infrared Survey Explorer (WISE), deployed in 2009; and the Herschel Space Observatory, a European Space Agency mission with important NASA participation.
All of these telescopes have been deployed over the past few years for the purpose of examining the universe in the infrared wavelength, so that astronomers will be able to detect stars that might have otherwise gone unnoticed. To give you a sense of what this might look like, check out the infrared image below, which was taken by COBE on Jan. 30th, 2000.
However, given that we still can’t seem them all, astronomers are forced to calculate the likely number of stars in the Milky Way based on a number of observable phenomena. They begin by observing the orbit of stars in the Milky Way’s disk to obtain the orbital velocity and rotational period of the Milky Way itself.
Estimates:
From what they have observed, astronomers have estimated that the galaxy’s rotational period (i.e. how long it takes to complete a single rotation) is apparently 225-250 million years at the position of the Sun. This means that the Milky Way as a whole is moving at a velocity of approximately 600 km per second, with respect to extragalactic frames of reference.
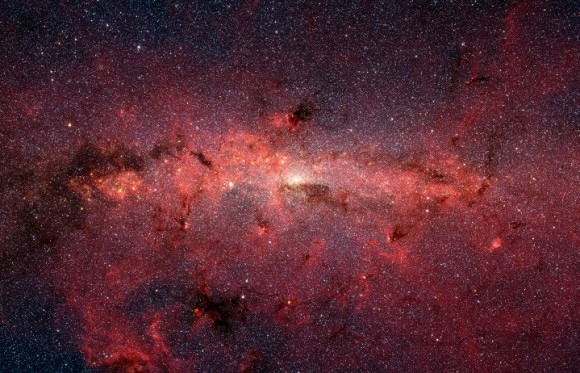
Infrared image of the Milky Way taken by NASA’s Spitzer Space Telescope. Credit: NASA/JPL-Caltech
Then, after determining the mass (and subtracting out the halo of dark matter that makes up over 90% of the mass of the Milky Way), astronomers use surveys of the masses and types of stars in the galaxy to come up with an average mass. From all of this, they have obtained the estimate of 200-400 billion stars, though (as stated already) some believe there’s more.
Someday, our imaging techniques may become sophisticated enough that are able to spot every single star through the dust and particles that permeate our galaxy. Or perhaps will be able to send out space probes that will be able to take pictures of the Milky Way from Galactic north – i.e. the spot directly above the center of the Milky Way.
Until that time, estimates and a great deal of math are our only recourse for knowing exactly how crowded our local neighborhood is!
We have written many great articles on the Milky Way here at Universe Today. For example, here are 10 Facts About the Milky Way, as well as articles that answer other important questions.
Astronomy Cast did a podcast all about the Milky Way, and the Students for the Exploration and Development of Space (SEDS) have plenty of information about the Milky Way here.
And if you’re up for counting a few of the stars, check out this mosaic from NASA’s Astronomy Picture of the Day. For a more in-depth explanation on the subject, go to How the Milky Way Galaxy Works.