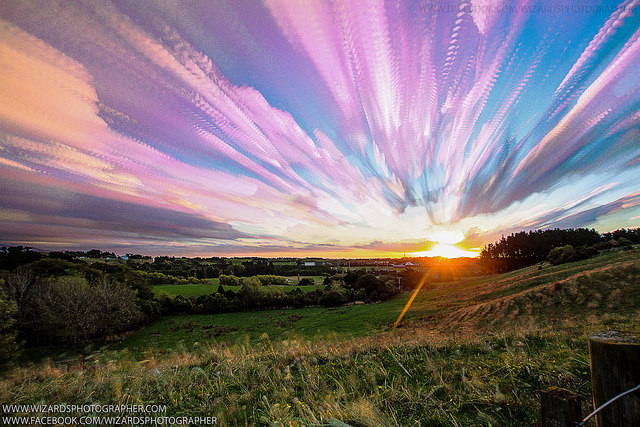
Composite of 300 images of the sky at sunset over Palmerston North, New Zealand. Credit and copyright: Manoj Kesavan.
Here’s a great – and beautiful! – example of what you can do with image stacking. Manoj Kesavan, an avid astrophotographer based at Massey University, New Zealand shot 300 images during 45 minutes at sunset (6:45 pm to 7.30 pm local time) from Palmerston North, New Zealand. “It’s a stack of 300 images, which means virtually putting all 300 photos on top of each other,” Kesavan explained via email. “So the cloud formation, movement and the transformation of sky color from blue to purple to red are captured on one single final image. And the saturation has been pumped up during the post processing.”
Kesavan said he shot this as part of an upcoming timelapse, using a Canon 7D using SIgma 10-20mm at 10mm, iso 100 & f8.
It’s a beautiful result and we look forward to seeing the timelapse! See more of Kesavan’s photography at his Facebook page or Flickr stream.
Want to get your astrophoto featured on Universe Today? Join our Flickr group or send us your images by email (this means you’re giving us permission to post them). Please explain what’s in the picture, when you took it, the equipment you used, etc.
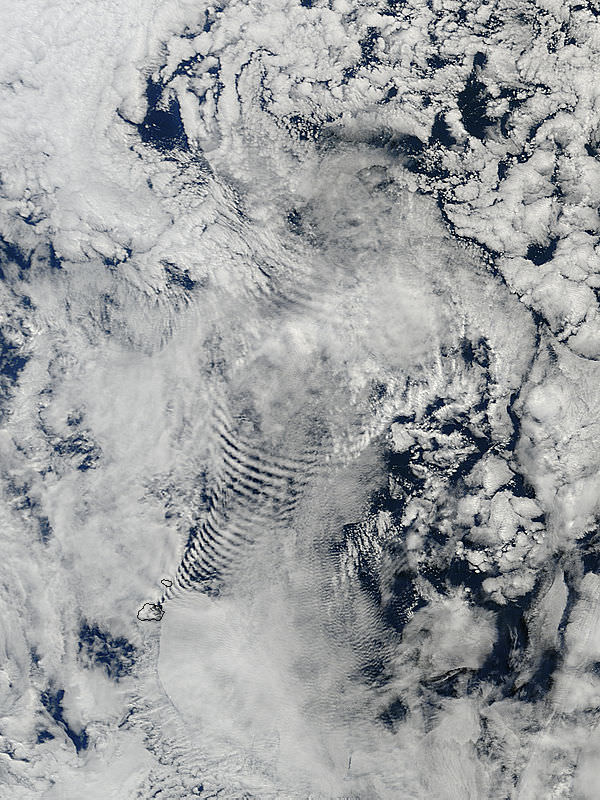
Coil-like shapes in clouds, created by their passage over the Prince Edward Islands in the south Indian Ocean. Credit: NASA/Terra/MODIS.
These are some of the strangest looking clouds I’ve seen from the fleet of Earth-observing satellites. These coil-like or bow-wave-shaped clouds were created by the clouds passing over the Prince Edward Islands, in the south Indian Ocean. It was taken by the Terra satellite with the MODIS instrument (Moderate Resolution Imaging Spectroradiometer) on March 26, 2013.
Update: Vitaliy Egorov from the Russian website allmars.net has sent us an animation of these coil clouds as seen by the Russian satellite Elektro-L:
Animation is made up of 17 frames made satellite “Electro-L” from 12:30 to 20:30 GMT March 26, 2013 at 1 frame per 30 minutes. Photo: Roscosmos / NTSOMZ / Electro-L / allmars.net.
The images are taken from a different angle than the Terra satellite. You can see more at Egorov’s website.
NASA says MODIS is playing a vital role in the development of validated, global, interactive Earth system models able to predict global change accurately enough to assist policy makers in making sound decisions concerning the protection of our environment.
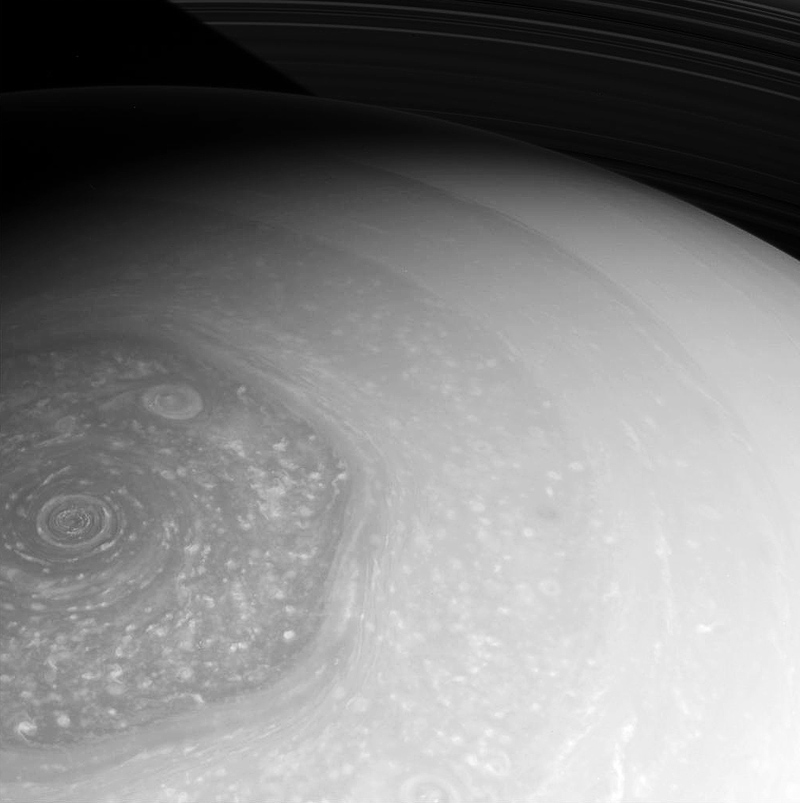
Raw Cassini image captured on 26 Feb. 2013 (NASA/JPL/SSI)
Freshly delivered from Cassini’s wide-angle camera, this raw image gives us another look at Saturn’s north pole and the curious hexagon-shaped jet stream that encircles it, as well as the spiraling vortex of clouds at its center.
Back in November we got our first good look at Saturn’s north pole in years, now that Cassini’s orbit is once again taking it high over the ringplane. With spring progressing on Saturn’s northern hemisphere the upper latitudes are getting more and more sunlight — which stirs up storm activity in its atmosphere.
The bright tops of upper-level storm clouds speckle Saturn’s skies, and a large circular cyclone can be seen near the north pole, within the darker region contained by the hexagonal jet stream. This could be a long-lived storm, as it also seems to be in the images captured on November 27.
About 25,000 km (15,500 miles) across, Saturn’s hexagon is wide enough to fit nearly four Earths inside!
The Saturn hexagon as seen by Voyager 1 in 1980 (NASA)
The hexagon was originally discovered in images taken by the Voyager spacecraft in the early 1980s. It encircles Saturn at about 77 degrees north latitude and is estimated to whip around the planet at speeds of 354 km/h (220 mph.)
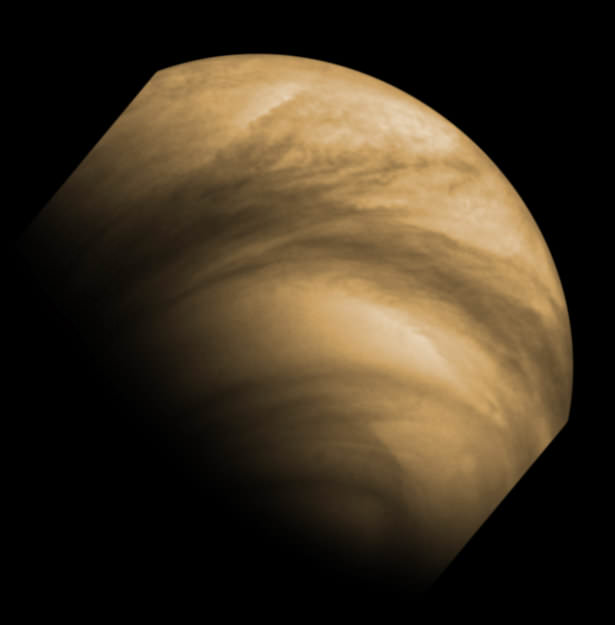
If you’ve ever wanted to see what it’s like to buzz Venus like only a spacecraft can, here’s your chance: this is a video animation of images taken by ESA’s Venus Express as it makes a pole-to-pole orbit of our neighboring world.
Captured in ultraviolet wavelengths, the images were acquired by the spacecraft’s Venus Monitoring Camera last January over a period of 18 hours. It’s truly a “day in the life” of Venus Express!
From ESA’s description of the video:
We join the spacecraft from a staggering 66,000 km above the south pole, staring down into the swirling south polar vortex. From this bird’s-eye view, half of the planet is in darkness, the ‘terminator’ marking the dividing line between the day and night sides of the planet.
Intricate features on smaller and smaller scales are revealed as Venus Express dives to just 250 km above the north pole and clouds flood the field of view, before regaining a global perspective as it climbs away from the north pole.
The observed pattern of bright and dark markings is caused by variations in an unknown absorbing chemical at the Venus cloud tops.
False-color image of cloud features on Venus. Captured by Venus Express from a distance of 30,000 km (18,640 miles) on December 8, 2011. (ESA/MPS/DLR/IDA)
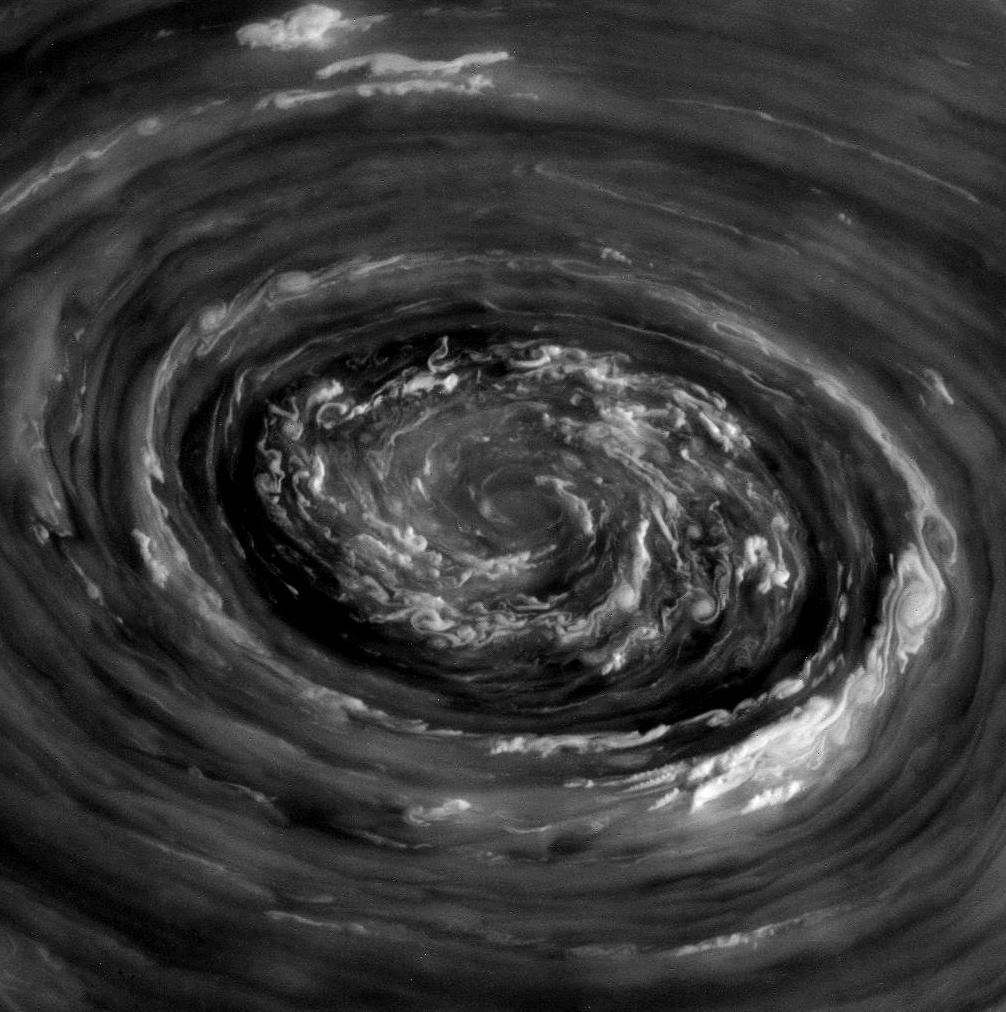
This swirling maelstrom of clouds is what was seen over Saturn’s north pole earlier today, November 27, by NASA’s Cassini spacecraft. This is a raw image, acquired in polarized light, from a distance of 238,045 miles (383,097 kilometers)… all I did was remove some of the hot pixels that are commonly found on Cassini images taken with longer exposures.
Again… WOW.
My attempt at a color composite can be seen below, plus another treat:
It’s rough, and a little muddy because the clouds were moving between image channels (not to mention the blue channel image was rather underexposed) but here’s a color-composite of the same feature, made from images taken from a slightly different perspective:
The images above show an approximately 3,000-4,000-km-wide cyclone above Saturn’s north pole. Saturn is also known to have a long-lived hexagonal jet stream feature around its north pole as well, but that is not shown in those images as it runs along a lower latitude. Instead, you can see that HERE:
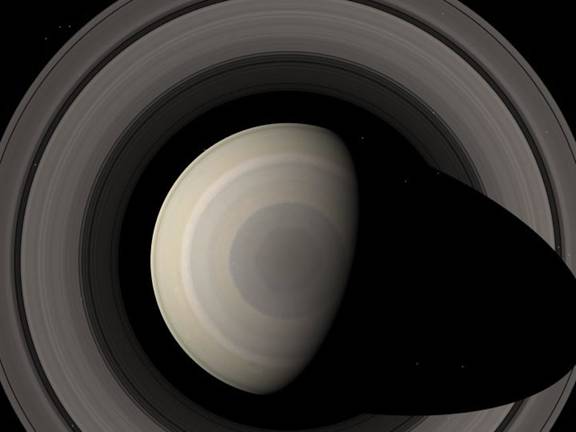
Saturn’s northern hexagon
Captured with a wider angle, in this image the hexagon structure can be made out as well as the cyclone, which sits at the center just over the pole. Saturn’s hexagon is about 25,000 km (15,500 miles) in diameter… large enough to fit almost four Earths inside. This image was also acquired today.
An RGB composite of this feature is below:
Saturn’s northern hexagon – color composite
It’s been a few years since we’ve gotten such a good look at Saturn’s north pole… thanks to Cassini’s new orbital trajectory, which is taking it high above the ring plane and poles of Saturn, we now have the opportunity to view the gas giant’s dynamic upper latitudes again. I’m sure this is just a taste of what’s to come!
(Image credit: NASA/JPL/Space Science Institute. Color composites by Jason Major)
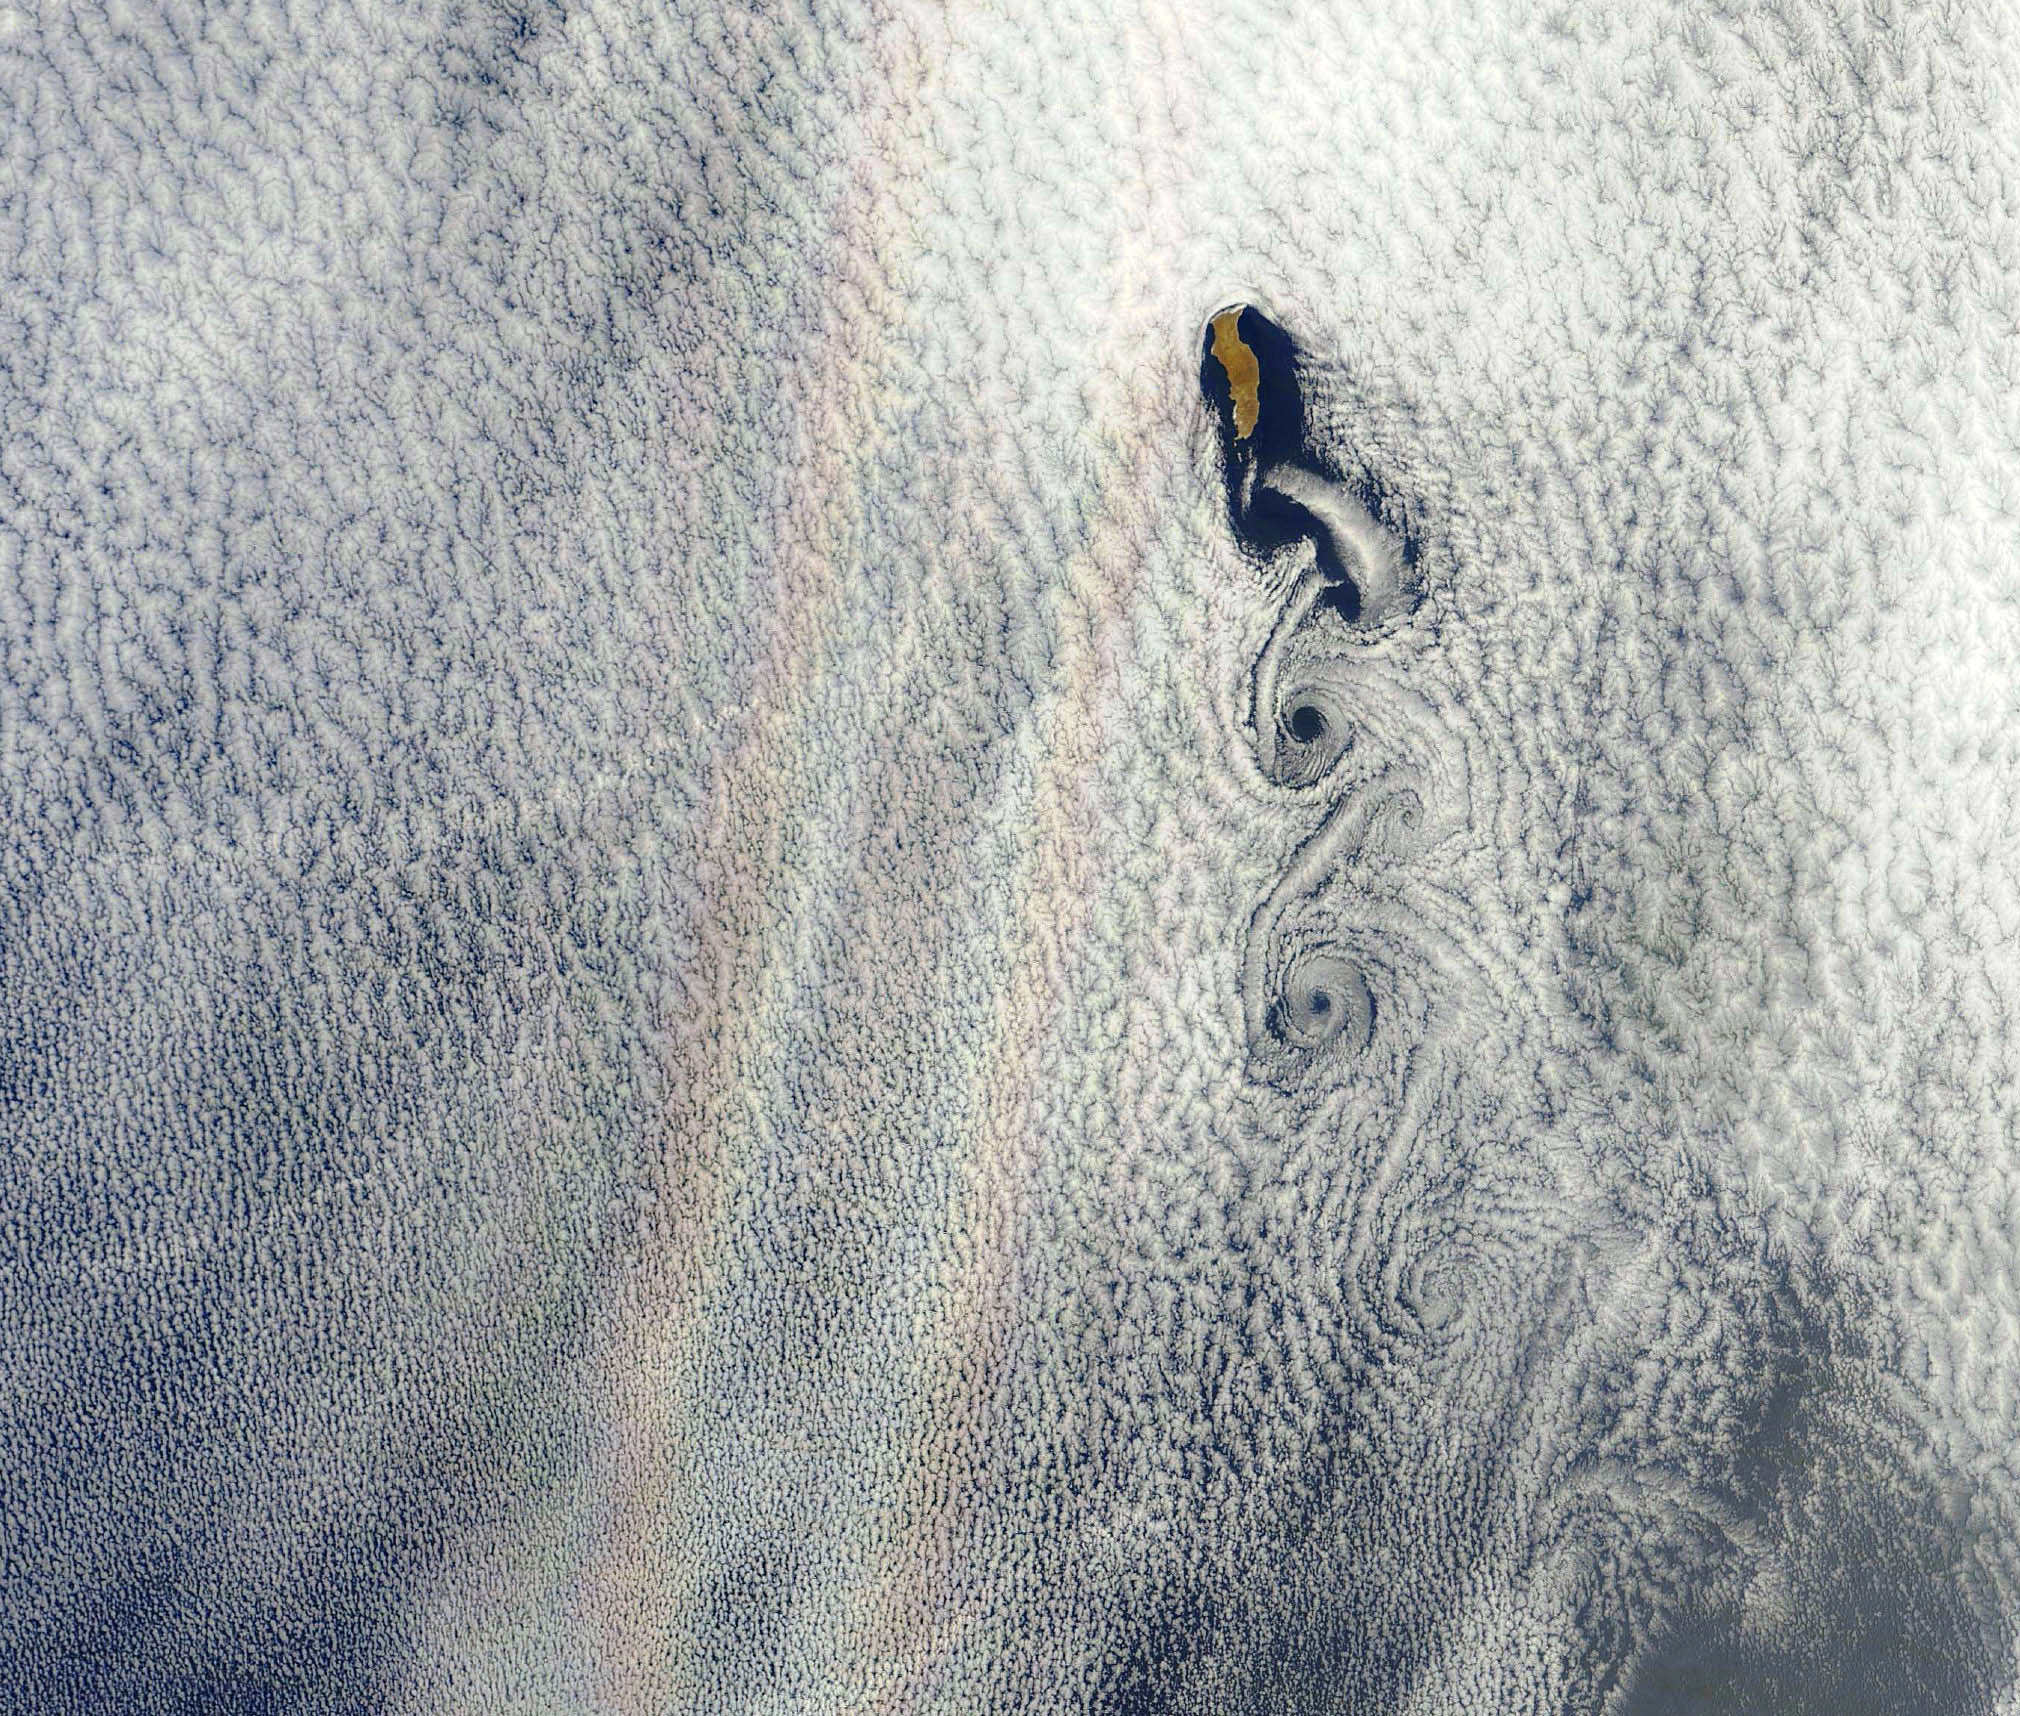
An optical phenomenon known as a “glory” is seen over a cloud-covered Pacific Ocean in this image from NASA’s Aqua satellite, acquired on June 20, 2012. Although the colors may make it look like a rainbow, the process behind its formation is somewhat different.
As vortices spiral off the leeward side of Guadalupe Island, off the western coast of Baja California, a shimmering spectrum of colors highlights a glory just west of the island. Glories are created when light from the Sun reflects back toward an observer off water droplets within clouds or fog. They are often seen from airplanes as a bright ring of light encircling a silhouetted shadow of the aircraft below, but are also visible from the ground and, sometimes, even from space.
Although glories may look similar to rainbows, the way light is scattered to produce them is different. Rainbows are formed by refraction and reflection; glories are formed by backward diffraction. The most vivid glories form when an observer looks down on thin clouds with droplets that are between 10 and 30 microns in diameter. The brightest and most colorful glories also form when droplets are roughly the same size.
From the ground or an airplane, glories appear as circular rings of color. The space shuttle Columbia observed a circular glory from space in 2003. In the image above, however, the glory does not appear circular. That’s because MODIS scans the Earth’s surface in swaths perpendicular to the path followed by the satellite. And since the swaths show horizontal cross sections through the rings of the glory, the glory here appears as two elongated bands of color that run parallel to the path of the satellite, rather than a full circle.
Glories always appear around the spot directly opposite the Sun, from the perspective of the viewer. This spot is called the anti-solar point. To visualize this, imagine a line connecting the Sun, a viewer, and the spot where the glory appears. In this case, the anti-solar point falls about halfway between the two colored lines of the glory.
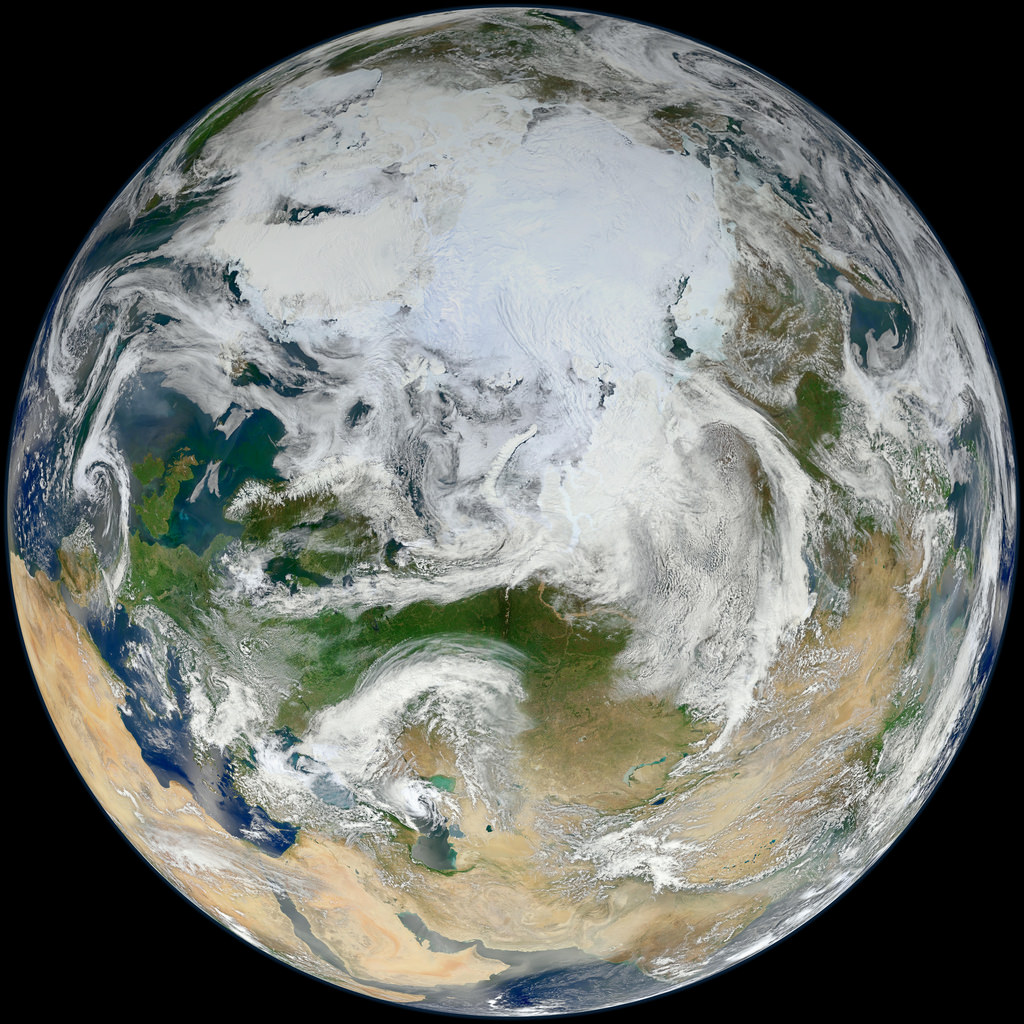
This latest portrait of Earth from NASA’s Suomi NPP satellite puts the icy Arctic in the center, showing the ice and clouds that cover our planet’s northern pole. The image you see here was created from data acquired during fifteen orbits of Earth.
In January of this year Suomi NPP images of Earth were used to create an amazing “Blue Marble” image that spread like wildfire across the internet, becoming one of the latest “definitive” images of our planet. Subsequent images have been released by the team at Goddard Space Flight Center, each revealing a different perspective of Earth.
NASA launched the National Polar-orbiting Operational Environmental Satellite System Preparatory Project (or NPP) on October 28, 2011 from Vandenberg Air Force Base. On Jan. 24, NPP was renamed Suomi National Polar-orbiting Partnership, or Suomi NPP, in honor of the late Verner E. Suomi. It’s the first satellite designed to collect data to improve short-term weather forecasts and increase understanding of long-term climate change.
Suomi NPP orbits the Earth about 14 times each day and observes nearly the entire surface of the planet.
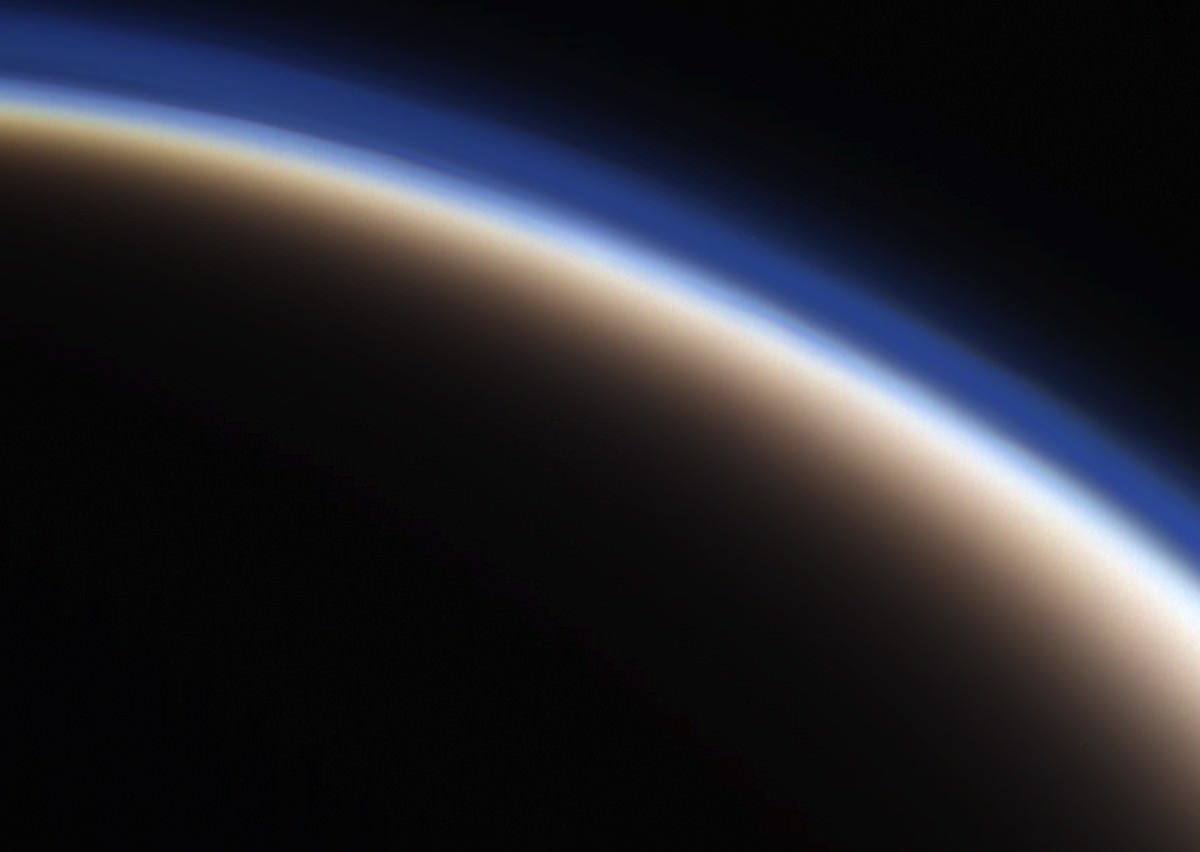
Titan's haze-covered limb seen by Cassini on June 6
[/caption]
Here’s a quick look at one of my favorite cosmic photo subjects – the varying layers of atmosphere that enshroud Saturn’s enormous moon Titan. The image above is a color-composite made from three raw images acquired by Cassini during its latest flyby.
On June 7 Cassini approached Titan within 596 miles (959 km) and imaged portions of the moon’s northwest quadrant with its radar instrument, as well as conducted further investigations of areas near the equator where surface changes were detected in 2010.
The image here was assembled from three raw images captured in red, green and blue visible light channels. It reveals some structure in the upper hydrocarbon haze layers that extend upwards above the moon’s opaque orange clouds — reaching 400-500 km in altitude, Titan’s atmosphere is ten times thicker than Earth’s!
The June 6 flyby was the second in a series of passes that will take Cassini into a more inclined orbit, where it will reside for the next three years as it investigates Saturn’s polar regions and obtains better views of its ring system.
Changing seasons in Mars’ northern hemisphere brings a change in the weather, and the clouds have rolled in to cover part of the polar surface in this intriguing image from the Mars Odyssey spacecraft.
Mars Odyssey’s THEMIS visual imager (VIS) captured this image on Jan. 24, 2012, as it passed over the Red Planet’s northern pole during one of its 2-hour-long orbits.
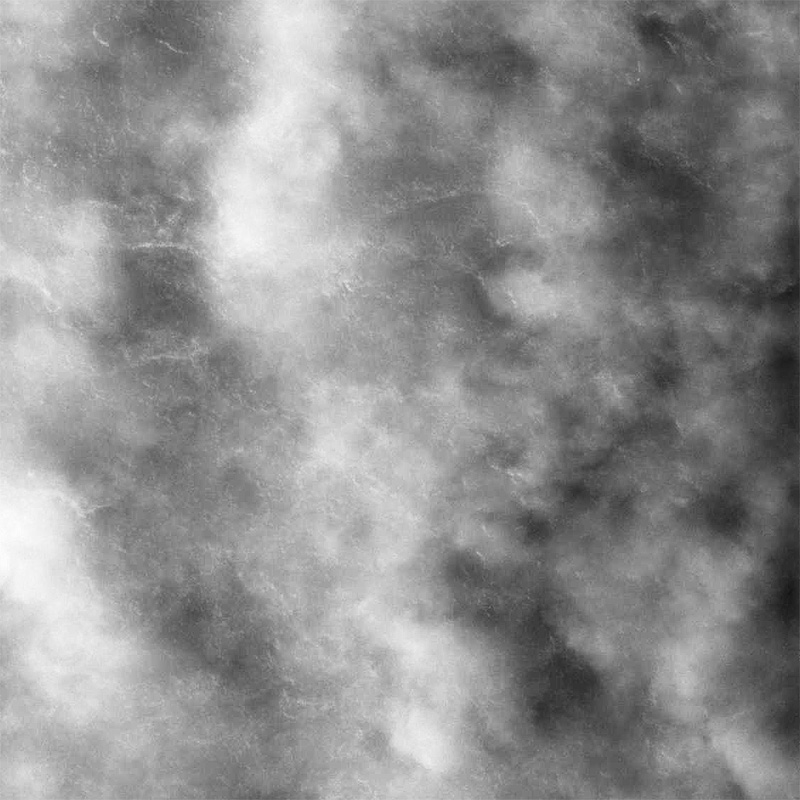
Clouds over the southern Indian Ocean, July 23, 2007. (NASA/JPL-Caltech)
[/caption]
Ok, maybe not the sky itself… but the clouds. According to recent research by climate scientists in New Zealand, global cloud heights have dropped.
Researchers at The University of Auckland have reported a decreasing trend in average global cloud heights from 2000 to 2010, based on data gathered by the Multi-angle Imaging SpectroRadiometer (MISR) on NASA’s Terra satellite. The change over the ten-year span was 30 to 40 meters (about 100 to 130 feet), and was mostly due to fewer clouds at higher altitudes.
It’s suspected that this may be indicative of some sort of atmospheric cooling mechanism in play that could help counteract global warming.
“This is the first time we have been able to accurately measure changes in global cloud height and, while the record is too short to be definitive, it provides just a hint that something quite important might be going on,” said lead researcher Professor Roger Davies.
A steady reduction in cloud heights could help the planet radiate heat into space, thus serving as a negative feedback in the global warming process. The exact cause of the drop in cloud altitude is not yet known, but it could reasonably be resulting from a change in circulation patterns that otherwise form high-altitude clouds.
Rendering of the Terra spacecraft. (NASA)
Cloud heights are just one of the many factors that affect climate, and until now have not been able to be measured globally over a long span of time.
“Clouds are one of the biggest uncertainties in our ability to predict future climate,” said Davies. “Cloud height is extremely difficult to model and therefore hasn’t been considered in models of future climate. For the first time we have been able to accurately measure the height of clouds on a global basis, and the challenge now will be to incorporate that information into climate models. It will provide a check on how well the models are doing, and may ultimately lead to better ones.”
While Terra data showed yearly variations in global cloud heights, the most extreme caused by El Niño and La Niña events in the Pacific, the overall trend for the years measured was a decrease.
Continuing research will be needed to determine future trends and how they may impact warming.
“If cloud heights come back up in the next ten years we would conclude that they are not slowing climate change,” Davies said. “But if they keep coming down it will be very significant.”
The team’s study was recently published in the journal Geophysical Research Letters.
Terra is a multi-national, multi-disciplinary mission involving partnerships with the aerospace agencies of Canada and Japan. An important part of NASA’s Science Mission, Terra is helping scientists around the world better understand and protect our home planet.