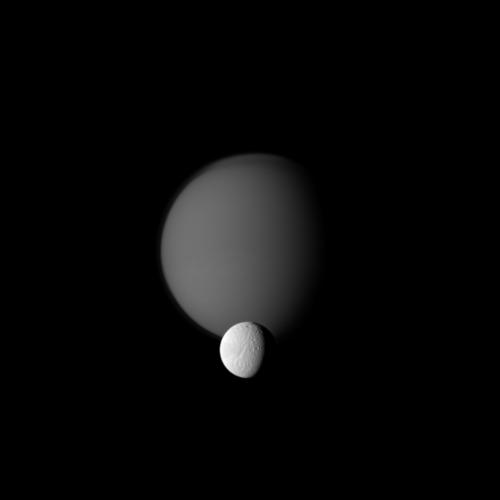
Titan and Tethys line up for a portrait of 'sibling' moons. Credit: NASA/JPL/Space Science Institute
[/caption]
This image reminds me of when I was young, my parents would line me and my siblings up for pictures, oldest and tallest in the back and youngest and smallest in the front. Here, the Cassini spacecraft sees two of Saturn’s moons lined up for a family photo, showing the hazy orb of giant Titan beyond smaller Tethys.
On Tethys, the large Ithaca Chasma can be seen running roughly north-south for more than 1,000 kilometers (620 miles). Titan’s hazy atmosphere covers up the interesting surface below.
This view looks toward the Saturn-facing sides of Titan (5,150 kilometers, or 3,200 miles across) and Tethys (1,062 kilometers, or 660 miles across).
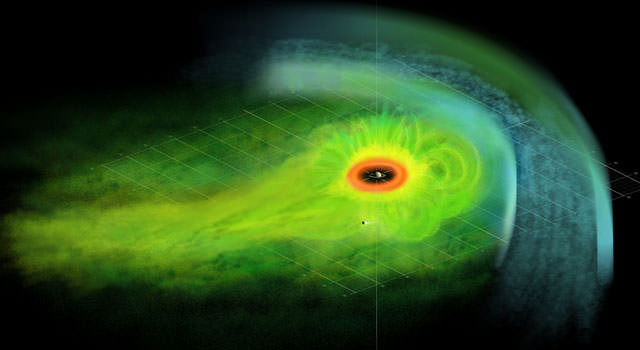
This is an artist's concept of the Saturnian plasma sheet based on data from Cassini magnetospheric imaging instrument. It shows Saturn's embedded "ring current," an invisible ring of energetic ions trapped in the planet's magnetic field. Credit: NASA/JPL
A new analysis based on data from NASA’s Cassini spacecraft finds a causal link between mysterious, periodic signals from Saturn’s magnetic field and explosions of hot ionized gas, known as plasma, around the planet.
Scientists have found that enormous clouds of plasma periodically bloom around Saturn and move around the planet like an unbalanced load of laundry on spin cycle. The movement of this hot plasma produces a repeating signature “thump” in measurements of Saturn’s rotating magnetic environment and helps to illustrate why scientists have had such a difficult time measuring the length of a day on Saturn.
“This is a breakthrough that may point us to the origin of the mysteriously changing periodicities that cloud the true rotation period of Saturn,” said Pontus Brandt, the lead author on the paper and a Cassini team scientist based at the Johns Hopkins University Applied Physics Laboratory in Laurel, Md. “The big question now is why these explosions occur periodically.”
The data show how plasma injections, electrical currents and Saturn’s magnetic field — phenomena that are invisible to the human eye — are partners in an intricate choreography. Periodic plasma explosions form islands of pressure that rotate around Saturn. The islands of pressure “inflate” the magnetic field.
A new animation showing the linked behavior is can be seen at the Cassini website.
The visualization shows how invisible hot plasma in Saturn’s magnetosphere – the magnetic bubble around the planet — explodes and distorts magnetic field lines in response to the pressure. Saturn’s magnetosphere is not a perfect bubble because it is blown back by the force of the solar wind, which contains charged particles streaming off the sun.
The force of the solar wind stretches the magnetic field of the side of Saturn facing away from the sun into a so-called magnetotail. The collapse of the magnetotail appears to kick off a process that causes the hot plasma bursts, which in turn inflate the magnetic field in the inner magnetosphere.
Scientists are still investigating what causes Saturn’s magnetotail to collapse, but there are strong indications that cold, dense plasma originally from Saturn’s moon Enceladus rotates with Saturn. Centrifugal forces stretch the magnetic field until part of the tail snaps back.
The snapping back heats plasma around Saturn and the heated plasma becomes trapped in the magnetic field. It rotates around the planet in islands at the speed of about 100 kilometers per second (200,000 mph). In the same way that high and low pressure systems on Earth cause winds, the high pressures of space cause electrical currents. Currents cause magnetic field distortions.
A radio signal known as Saturn Kilometric Radiation, which scientists have used to estimate the length of a day on Saturn, is intimately linked to the behavior of Saturn’s magnetic field. Because Saturn has no surface or fixed point to clock its rotation rate, scientists inferred the rotation rate from timing the peaks in this type of radio emission, which is assumed to surge with each rotation of a planet. This method has worked for Jupiter, but the Saturn signals have varied. Measurements from the early 1980s taken by NASA’s Voyager spacecraft, data obtained in 2000 by the ESA/NASA Ulysses mission, and Cassini data from about 2003 to the present differ by a small, but significant degree. As a result, scientists are not sure how long a Saturn day is.
“What’s important about this new work is that scientists are beginning to describe the global, causal relationships between some of the complex, invisible forces that shape the Saturn environment,” said Marcia Burton, the Cassini fields and particles investigation scientist at NASA’s Jet Propulsion Laboratory, Pasadena, Calif. “The new results still don’t give us the length of a Saturn day, but they do give us important clues to begin figuring it out. The Saturn day length, or Saturn’s rotation rate, is important for determining fundamental properties of Saturn, like the structure of its interior and the speed of its winds.”
Plasma is invisible to the human eye. But the ion and neutral camera on Cassini’s magnetospheric imaging instrument provides a three-dimensional view by detecting energetic neutral atoms emitted from the plasma clouds around Saturn. Energetic neutral atoms form when cold, neutral gas collides with electrically-charged particles in a cloud of plasma. The resulting particles are neutrally charged, so they are able to escape magnetic fields and zoom off into space. The emission of these particles often occurs in the magnetic fields surrounding planets.
By stringing together images obtained every half hour, scientists produced movies of plasma as it drifted around the planet. Scientists used these images to reconstruct the 3-D pressure produced by the plasma clouds, and supplemented those results with plasma pressures derived from the Cassini plasma spectrometer. Once scientists understood the pressure and its evolution, they could calculate the associated magnetic field perturbations along the Cassini flight path. The calculated field perturbation matched the observed magnetic field “thumps” perfectly, confirming the source of the field oscillations.
“We all know that changing rotation periods have been observed at pulsars, millions of light years from our solar system, and now we find that a similar phenomenon is observed right here at Saturn,” said Tom Krimigis, principal investigator of the magnetospheric imaging instrument, also based at the Applied Physics Laboratory and the Academy of Athens, Greece. “With instruments right at the spot where it’s happening, we can tell that plasma flows and complex current systems can mask the real rotation period of the central body. That’s how observations in our solar system help us understand what is seen in distant astrophysical objects.”
A potential cryovolcano – or ice volcano -- region on Saturn's moon Titan is shown in this image from NASA's Cassini spacecraft. This radar swath was laid on top of an image taken by Cassini's visual and infrared mapping spectrometer. Sotra Facula is located around 15 degrees south latitude, 40 degrees west longitude. Image credit: NASA/JPL-Caltech/USGS/University of Arizona
While icy cryovolcanoes on Titan have been theorized in the past, scientists didn’t have any hard evidence for them. But now, researchers from the Cassini mission have found proof that jumped out of their data in the form of 3-D mountain peaks. Using a new three-dimensional mapping technique, the team was able to create a realistic 3-D flyover of a region on Titan, above, where volcanic-like mountains appear to be lined up in a mountain range-type formation, complete with calderas and material flows. If cryovolcanoes do exist on Titan, they would potentially answer the question of why Titan has so much methane in its atmosphere.
“A combination of features makes us think we’ve found the best evidence so far for icy volcanoes on the moon Titan,” said Randy Kirk, a geophysicist with the U.S. Geological Survey and a member of the Cassini team. “Sotra Facular is a classic volcano with a crater on it and lava flows coming out of it.
Kirk presented the team’s findings at the American Geophysical Union conference in San Francisco.
Rather than erupting hot, molten rock, it is theorized that the cryovolcanoes of Titan would erupt volatiles such as water, methane, and ammonia. “A volcano is a place where material on the inside of a planetary body has gotten warm enough that it can erupt to the surface,” Kirk said. “When a body is made of ice and not rock, you get a cryovolcano.”
[/caption]
Scientists have suspected cryovolcanoes might populate Titan, and the Cassini mission has collected data on several previous passes of the moon that suggest their existence. Kirk shared radar imagery from early in the Cassini spacecraft’s mission that showed Sotra Facular as bright spot on Titan’s equatorial sand sea, as seen above.
“There were thousands of places where bright ground peeks out of the dark places,” Kirk said, “and in particular we noticed a rose-type round feature, which we called The Rose, with a flows coming from it and we wondered if it was a volcano.”
Combining new data from Cassini’s radar instrument and the visual and infrared mapping spectrometer, the team was able to create the 3-D flyover movie, which shows two peaks more than 1,000 meters (3,000 feet) tall and multiple craters as deep as 1,500 meters (5,000 feet). It also shows finger-like flows. All of these are land features that indicate cryovolcanism.
“We were excited and quite happy when we saw the video,” Kirk told Universe Today at a press briefing on Tuesday. “There was a long time lapse between seeing the image of The Rose, and everybody was wondering if it was a volcano. When we finally managed to create the three dimensional from the topographic maps, I was shocked, and I made it from our own data set! I showed the video to team and they shared that reaction.”
Kirk said the flows were quite thin – thinner than anticipated at less than 100 meters (300 feet) thick — but there were more volcanoes in the same field as Sotra Facula than what the team expected.
In the video, mountains appear, with a huge pit like a volcanic calderas –“ a big bite out of the mountain,” as Kirk described it.
The topography in the video has been vertically exaggerated by a factor of 10. The false color in the initial frames show different compositions of surface material, as detected by Cassini’s visual and infrared mapping spectrometer. In this color scheme, dunes tend to look relatively brown-blue. Blue suggests the presence of some exposed ice. Scientists think the bright areas have an organic coating that hides the ice and is different and lighter than the dunes. The finger-like flows appear bright yellowish-white, like the mountain and caldera. The second set of colors shows elevation, with blue being lowest and yellow and white being the highest. Here, the dunes appear blue because they tend to occupy low areas.
This photograph shows a fissure and a row of craters in Laki, a volcanic region in the south of Iceland. Kirk said the region on Titan where potential cryovolcanoes have been found could look very similar to this landscape. Image credit: R. M. C. Lopes
Cryovolcanism could release methane from Titan’s interior, which explains Titan’s seemingly continuous supply of fresh methane in its atmosphere. Without replenishment, scientists say, Titan’s original atmospheric methane should have been exhausted long ago.
“One of mysteries on Titan is the source of methane,” said Linda Spilker, Cassini project scientist, “so cryovoclanoes offer the perfect opportunity to get methane from interior into the atmosphere of Titan.”
Kirk and his team calculated that a Sotra-sized volcanic eruption every 1,000 years would maintain the current level of methane in Titan’s atmosphere.
Jeff Kargel from the University of Arizona, who provided an independent assessment of the potential of cryovolcanoes on Titan, said that no one yet knows what the flows are made of from these volcanoes, but — providing a tantalizing visualization — said an ammonia-water cryolava with methane and carbon dioxide would make frothy, pumice-like deposits on Titan.
Kargel also added that the strongest evidence for cryovolcanoes on Titan is the topographical data that Kirk and his team have provided. “The strong evidence here is the is juxtaposition of the high and low topography in this region on Titan. There are very few tectonic activities that can produce comparable conic mountain like this.”
For more imagery from Kirk’s presentation and other presentations about the Saturn system at AGU, see this NASA webpage.
A ridge that follows the equator of Saturn's moon Iapetus gives it the appearance of a giant walnut. This image was taken by the Cassini spacecraft. Credit: NASA/JPL/SSI
[/caption]
There’s a new theory for why Saturn’s moon Iapetus looks like a walnut. The moon has a mysterious large ridge that covers more than 75 percent of the moon’s equator. Figuring out the reason for the ridge, say researchers from Washington University in St. Louis, has been a tough nut to crack. But they propose that at one time Iapetus itself had its very own moon, and the orbit of this mini-moon-around-another-moon would have decayed because of tidal interactions with Iapetus, and those forces would have torn the sub-satellite apart, forming a ring of debris around Iapetus that would eventually slam into the moon near its equator.
This is not the nuttiest proposal ever…
A closeup of Iapetus' ridge. In 2007, Cassini flew within a few thousand kilometers of Iapetus' surface to take this dramatic image. Credit: NASA/JPL/SSI
The ridge on Iapetus is 100 kilometers (62 miles) wide and at place, 20 kilometers (12 miles) high. (The peak of Mount Everest, by comparison, is 8.8 km (5.5 miles) above sea level.) Iapetus itself is 1,470 km across, and is the 11th largest moon in the Solar System.
Professor William McKinnon and his former doctoral student, Andrew Dombard — now from the University of Illinois Chicago — came up with this idea.
“Imagine all of these particles coming down horizontally across the equatorial surface at about 400 meters per second, the speed of a rifle bullet, one after the other, like frozen baseballs,” said McKinnon. “Particles would impact one by one, over and over again on the equatorial line. At first the debris would have made holes to form a groove that eventually filled up.”
“When you have a debris ring around a body, the collisional interactions steal energy out of the orbit,” Dombard said. “And the lowest energy state that a body can be in is right over the rotational bulge of a planetary body — the equator. That’s why the rings of Jupiter, Saturn, Uranus and Neptune are over the equator.”
“We have a lot of corroborating calculations that demonstrate that this is a plausible idea,” added Dombard, “but we don’t yet have any rigorous simulations to show the process in action. Hopefully, that’s next.”
Other ideas for how the ridge was created are volcanism or mountain-building forces.
“Some people have proposed that the ridge might have been caused by a string of volcanic eruptions, or maybe it’s a set of faults,” said McKinnon. “But to align it all perfectly like that — there is just no similar example in the solar system to point to such a thing.”
Dombard said there are three critical observations that any model for the formation of the ridge has to satisfy: Why the feature is sitting on the equator; why only on the equator, and why only on Iapetus.
Dombard says that Iapetus’s Hill sphere — the zone close to an astronomical body where the body’s gravity dominates satellites — is far bigger than that of any other major satellite in the outer solar system, accounting for why Iapetus is the only body known to have such a ridge.
“Only Iapetus could have had the orbital space for the sub-satellite to then evolve and come down toward its surface and break up and supply the ridge,” he says.
Dombard will make a presentation on the preliminary findings Wed., Dec. 15, 2010, at the fall meeting of the American Geophysical Union in San Francisco. The team also included Andrew F. Cheng of the Johns Hopkins Applied Physics Laboratory, and Jonathan P. Kay, a graduate student at UIC.
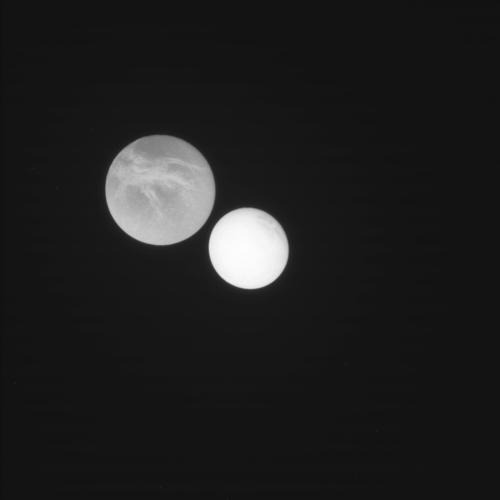
Enceladus and Dione line up for the Cassini camera. Credit: NASA/JPL/Space Science Institute
[/caption]
Here are a few raw images from the Cassini spacecraft’s most recent flyby of Enceladus. The probe seems to be in good health following several weeks in safe mode, after a bit flipped in the command and data subsystem computer. This prevented the spacecraft from registering and following instructions. But she appears to be humming along just fine now, and snapped this great picture of Enceladus and Dione yesterday (have to quote @lukedones on Twitter: “Dione going in the corner pocket!”) Cassini focused on the Enceladus during a close flyby on November 30, so see more below, including a wonderful shot of a veritable curtain of geyser “spray.”
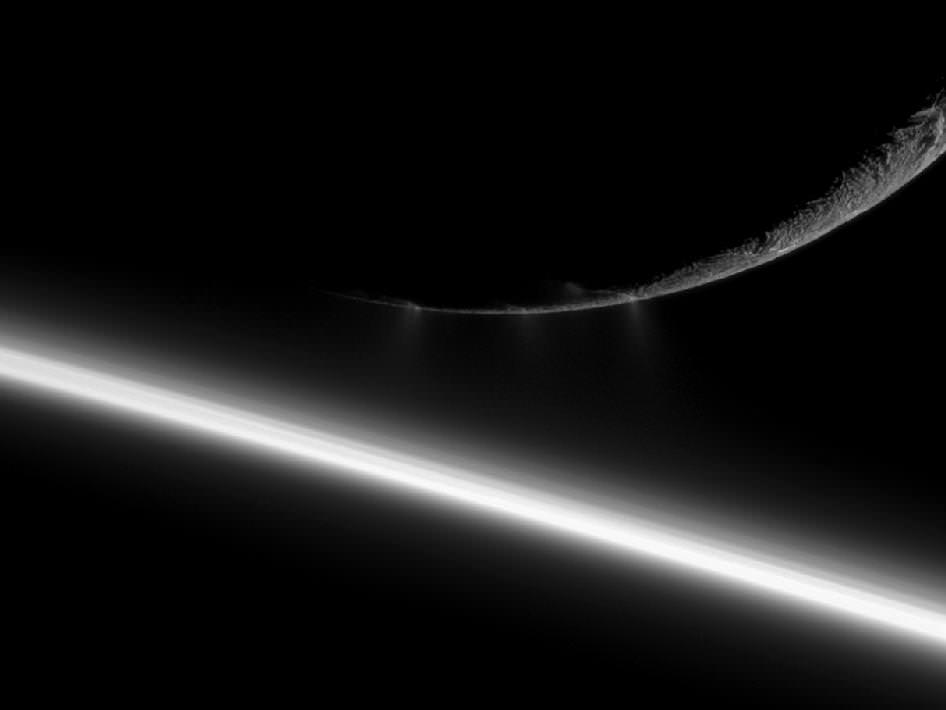
A good look at the spray from the fissures on Enceladus. NASA/JPL/Space Science Institute Enceladus, backdropped by Saturn's rings. Credit: NASA/JPL/ Space Science Institute. Closeup of Enceladus. Credit: NASA/JPL/Space Science Institute. An even closer closeup of Enceladus. Credit: NASA/JPL/Space Science Institute.
Small water ice particles fly from fissures in the south polar region of Saturn's moon Enceladus in this image taken during the Aug. 13, 2010, flyby of the moon by NASA's Cassini spacecraft. Image credit: NASA/JPL/SSI
[/caption]
As Cassini scientists await the data from today’s flyby of Enceladus, images and data from August of this year have provided more insight into the active fissures on the icy moon’s south polar region. These geyser-spewing fractures are warmer and more complicated than previously thought.
“The exquisite resolution obtained on one segment of the Damascus fracture — one of the most active regions within the south polar terrain — has revealed a surface temperature reaching a staggering 190 Kelvin, or 120 degrees below zero Fahrenheit,” said Cassini imaging team lead Carolyn Porco, in an email announcing the new images. “Far from the fractures, the temperature of the south polar terrain dips as low as 52 Kelvin, or 365 degrees below zero Fahrenheit.”
Porco said that what this means is that a phenomenal amount of heat is emerging from the fractures which are “undoubtedly the result of the tidal flexing of Enceladus brought about by its orbital resonance with Dione. However, details of this heating process are still unclear and are being studied at this very moment.”
This image shows a high-resolution heat intensity map of part of the south polar region of Saturn's moon Enceladus, made from data obtained by NASA's Cassini spacecraft. Image credit: NASA/JPL/GSFC/SWRI/SSI
The flyby on August 13, 2010 provided infrared spectroscopy along with high resolution images which have enabled scientists to construct the highest-resolution heat intensity maps yet of the hottest part of a region of long fissures spraying water vapor and icy particles from Enceladus. These fissures — known as “tiger stripes,” appear to be laid on in a complex web, and could be connected underground.
Additional high-resolution spectrometer maps of one end of the tiger stripes Alexandria Sulcus and Cairo Sulcus reveal never-before-seen warm fractures that branch off like split ends from the main tiger stripe trenches. They also show an intriguing warm spot isolated from other active surface fissures.
“The ends of the tiger stripes may be the places where the activity is just getting started, or is winding down, so the complex patterns of heat we see there may give us clues to the life cycle of tiger stripes,” said John Spencer, a Cassini team scientist based at Southwest Research Institute in Boulder, Colo.
The temperature measured in this flyby appears slightly higher than previously measured temperatures at Damascus, which were around 170 Kelvin (minus 150 degrees Fahrenheit).
Spencer said he isn’t sure if this tiger stripe is just more active than it was the last time Cassini’s spectrometer scanned it, in 2008, or if the hottest part of the tiger stripe is so narrow that previous scans averaged its temperature out over a larger area. In any case, the new scan had such good resolution, showing details as small as 800 meters (2,600 feet), that scientists could see for the first time warm material flanking the central trench of Damascus, cooling off quickly away from the trench. The Damascus thermal scan also shows large variations in heat output within a few kilometers along the length of the fracture. This unprecedented resolution will help scientists understand how the tiger stripes deliver heat to the surface of Enceladus.
Cassini acquired the thermal map of Damascus simultaneously with a visible-light image where the tiger stripe is lit by sunlight reflecting off Saturn. The visible-light and thermal data were merged to help scientists understand the relationships between physical heat processes and surface geology.
“Our high-resolution images show that this section of Damascus Sulcus is among the most structurally complex and tectonically dynamic of the tiger stripes,” said imaging science team associate Paul Helfenstein of Cornell University, Ithaca, N.Y. Some details in the appearance of the landforms, such as a peculiar pattern of curving striations along the flanks of Damascus, had not previously been noticed in ordinary sunlit images.
ets of water ice particles spew from Saturn's moon Enceladus in this image obtained by NASA's Cassini spacecraft on Aug. 13, 2010. Image credit: NASA/JPL/SSI
The Aug. 13 flyby of Enceladus is the last one dedicated to thermal mapping until 2015 and also gave Cassini its last look at any part of the active south polar region in sunlight.
The flyby today will aid in understanding the interior of the moon through gravity measurements.
NASA’s Cassini Spacecraft is doing some awesome stuff. Stay tuned to NASA’s twitter feed Space Cadets, today should be interesting. I’m Benjamin Higginbotham and this is your SpacePod for November 30th, 2010. Continue reading “Cassini visits Enceladus – SpacePod 2010.11.30”
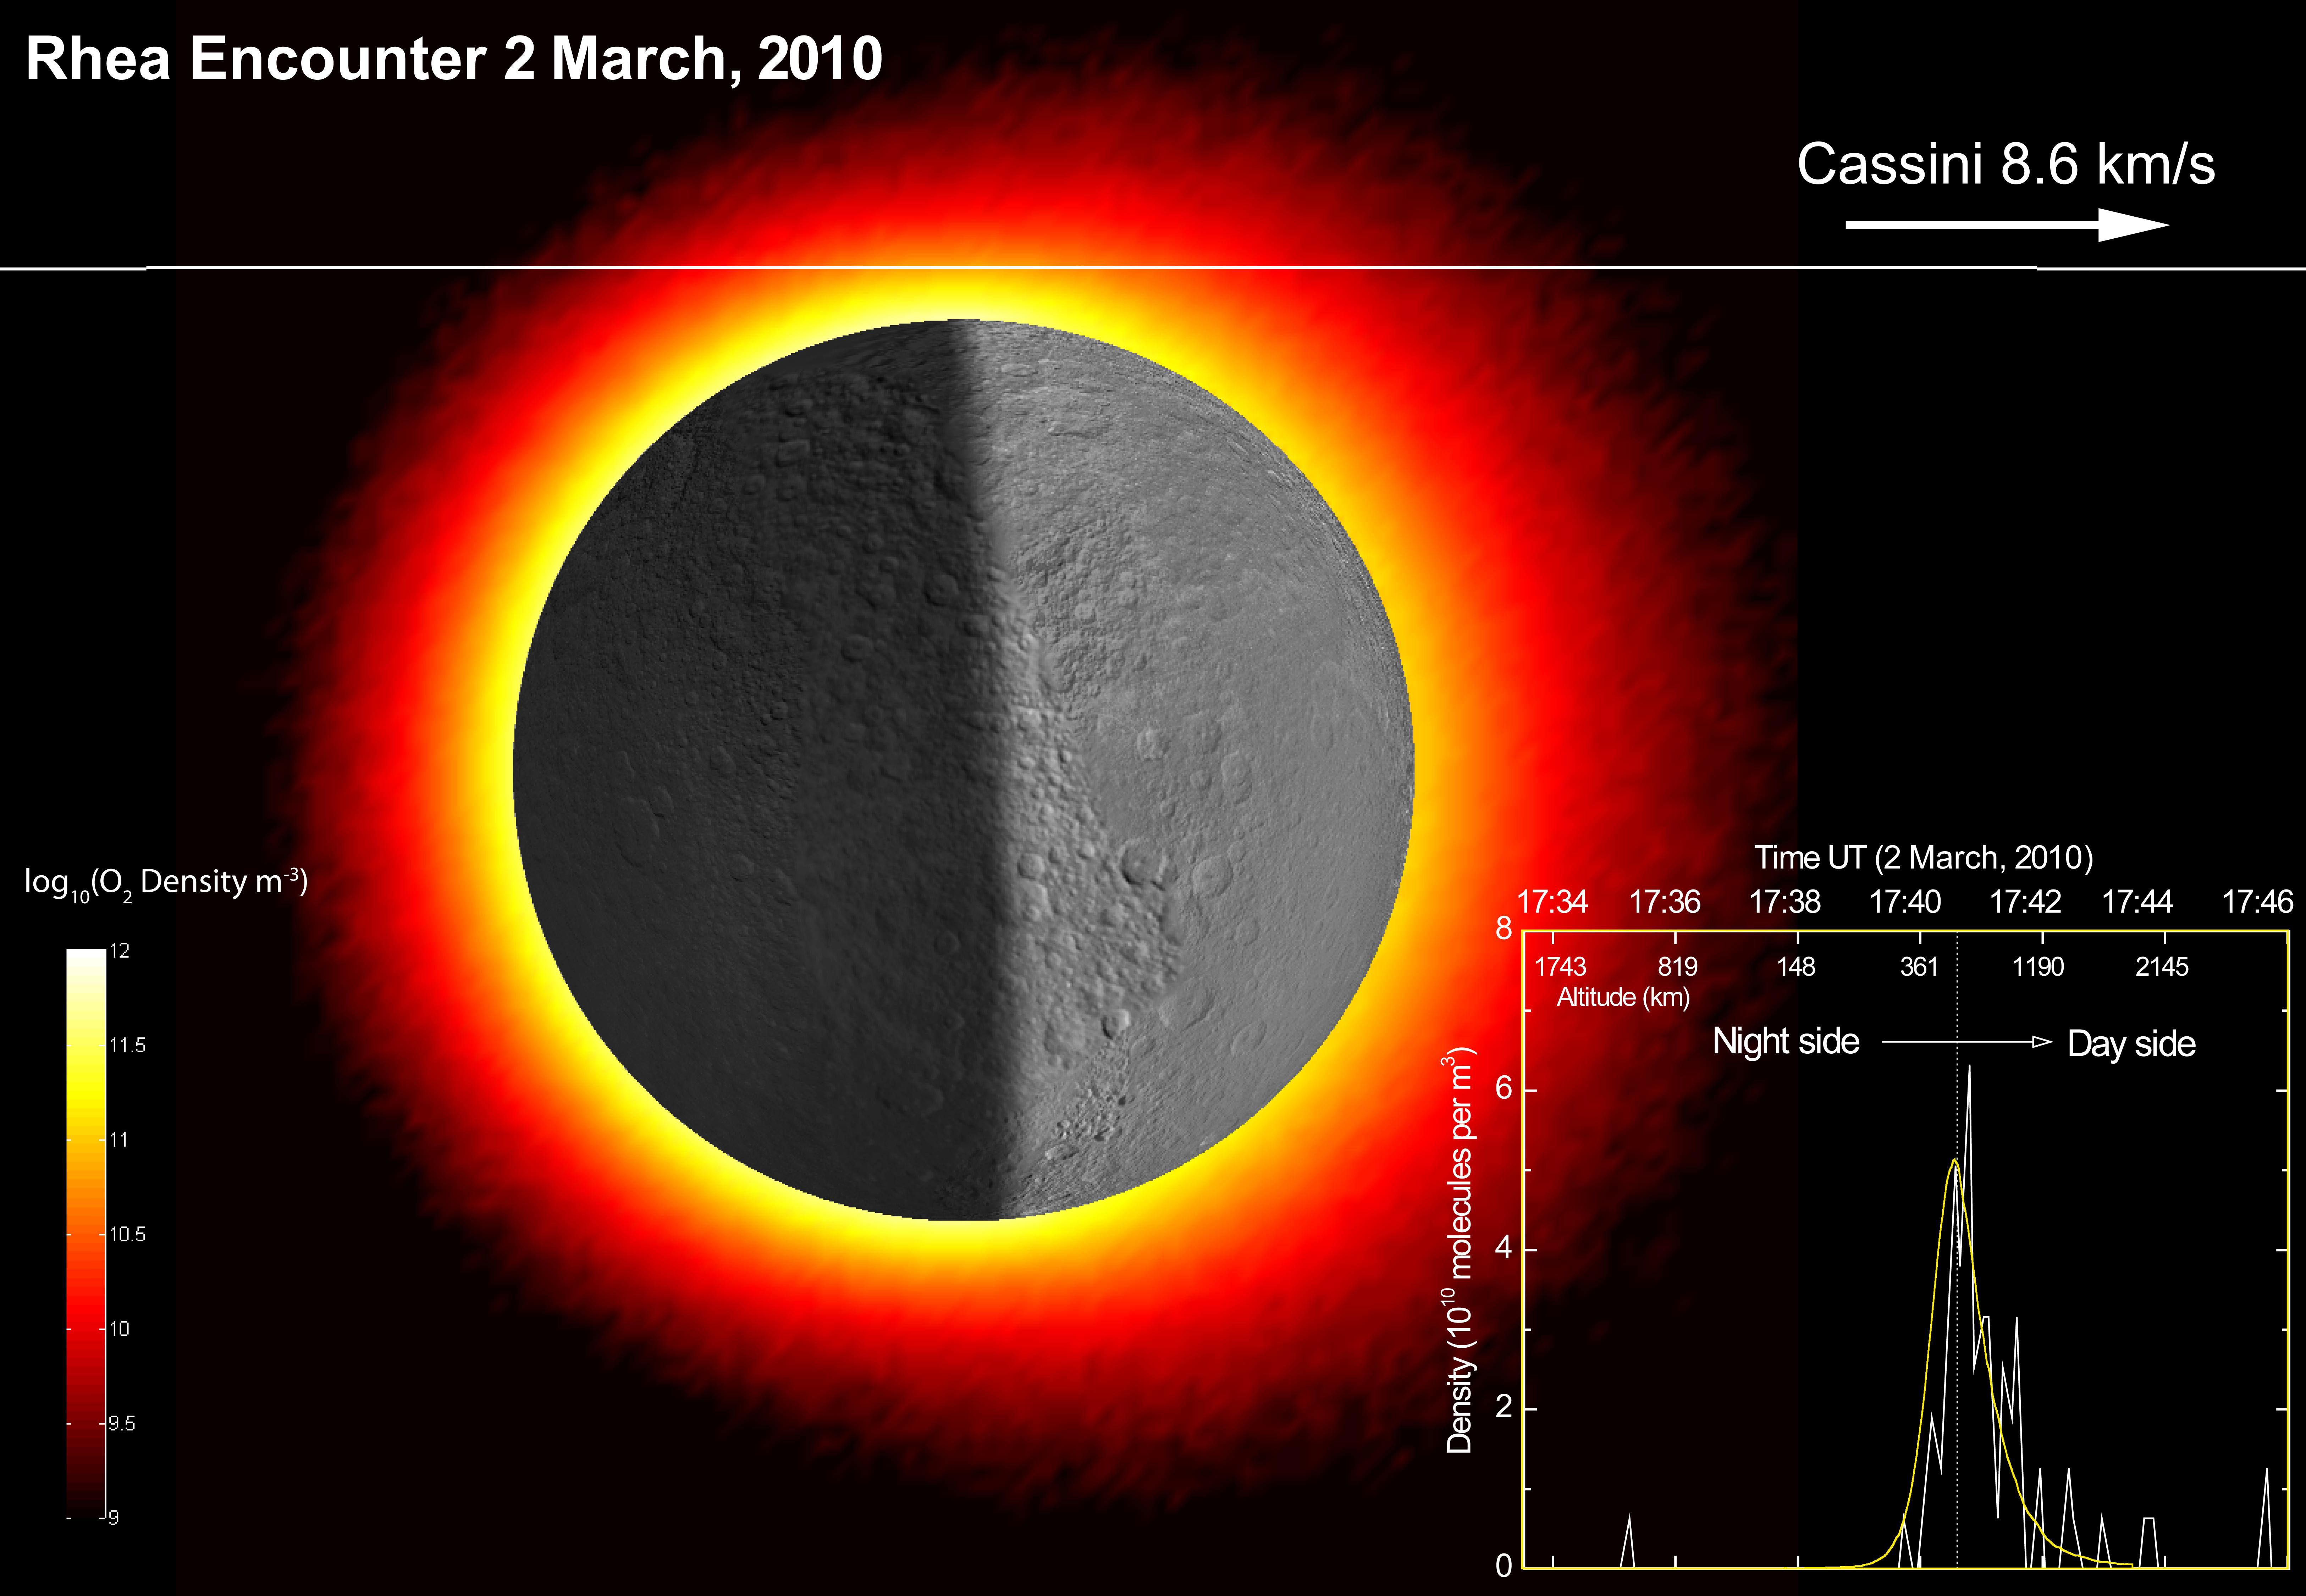
A few years ago, astronomers thought they found wispy rings around Saturn’s moon Rhea. Although the possibility of rings around this icy moon was later nixed, astronomers knew there was still something around Rhea that was causing a strange, symmetrical structure in the charged-particle environment around Saturn’s second-largest moon. Now, new observations have shown something else around Rhea that was completely unexpected: an oxygen atmosphere. In March of this year, the Cassini spacecraft made a close flyby of Rhea and recorded data showing a thin atmosphere made up of oxygen and carbon dioxide.
The source of the oxygen is not really a surprise: Rhea’s density of 1.233 times that of liquid water suggests that Rhea is three quarters ice and one quarter rock. The moon’s tenuous atmosphere is maintained by the ongoing chemical decomposition of ice water on the moon’s surface by irradiation from Saturn’s magnetosphere.
Oxygen has also recently been detected in the atmospheres of two of Jupiter’s moons, Europa and Ganymede. Since oxygen is a main component of the atmosphere surrounding Saturn’s rings, astronomers think there could be similar atmospheres around other icy moons that orbit inside Saturn’s magnetosphere.
“The new results suggest that active, complex chemistry involving oxygen may be quite common throughout the solar system and even our universe,” said lead author Ben Teolis, a Cassini team scientist based at Southwest Research Institute in San Antonio. “Such chemistry could be a prerequisite for life. All evidence from Cassini indicates that Rhea is too cold and devoid of the liquid water necessary for life as we know it.”
Of course, there’s always the possibility of life as we don’t know it.
And, there must be some sort of organics on the moon – meaning carbon compounds. The source of the carbon dioxide in Rhea’s atmosphere is not yet known, but its presence suggests that radiolysis reactions between oxidants and organics are ongoing at the moon’s surface.
As far as any of these new findings having a relation to the ruled-out hypothesis of rings around Rhea, Teolis told Universe Today there is still much about Rhea’s environment that is yet to determined. “The electron depletion is currently unexplained,” Teolis said in an email. The sharp, symmetrical drop in electrons detected around Rhea was the initial finding behind the ring theory. “Our current thinking is that it may be related to the ionization of the atmosphere, perhaps in conjunction with electrostatic charging of Rhea’s surface, but I do not have a definitive answer at this point. The atmosphere – magnetosphere interaction is a complex problem, and will take some time to sort out. But for the first time at an icy moon, the Cassini findings give us an in situ observational window onto this interaction, understanding of which is still highly theoretical. We’re working on it.”
Rhea, as seen by Cassini. Credit: NASA
This latest data came from Cassini’s ion and neutral mass spectrometer and the Cassini plasma spectrometer during flybys on Nov. 26, 2005, Aug. 30, 2007, and March 2, 2010. The ion and neutral mass spectrometer saw peak densities of oxygen of around 50 billion molecules per cubic meter (1 billion molecules per cubic foot). It detected peak densities of carbon dioxide of around 20 billion molecules per cubic meter (about 600 million molecules per cubic foot).
The plasma spectrometer saw clear signatures of flowing streams of positive and negative ions, with masses that corresponded to ions of oxygen and carbon dioxide.
The scientists said the oxygen appears to rise to an atmosphere when Saturn’s magnetic field rotates over Rhea. Energetic particles trapped in the planet’s magnetic field pepper the moon’s water-ice surface. They cause chemical reactions that decompose the surface and release oxygen.
Releasing oxygen through surface irradiation could help generate conditions favorable for life at an icy body other than Rhea that has liquid water under the surface, Teolis said. If the oxygen and carbon dioxide from the surface could somehow get transported down to a sub-surface ocean, that would provide a much more hospitable environment for more complex compounds and life to form.
The scientists are unsure how the carbon dioxide is released. It could be the result of “dry ice” trapped from the primordial solar nebula, as is the case with comets, or it may be due to similar irradiation processes operating on the organic molecules trapped in the water ice of Rhea. The carbon dioxide could also come from carbon-rich materials deposited by tiny meteors that bombarded Rhea’s surface.
“Rhea is turning out to be much more interesting than we had imagined,” said Linda Spilker, Cassini project scientist at JPL. “The Cassini finding highlights the rich diversity of Saturn’s moons and gives us clues on how they formed and evolved.”
This research appears in the November 25, 2010 issue of Science Express.
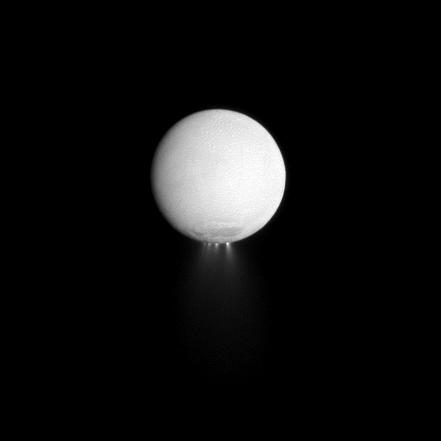
At least four distinct plumes of water ice spew out from the south polar region of Saturn's moon Enceladus. Credit: NASA/JPL/Space Science Institute
[/caption]
What is going on inside Saturn’s moon Enceladus and what powers the icy geysers and jets? A pair of upcoming flybys by the Cassini spacecraft could help answer those questions. Radio instruments on board will measure the gravity field of Enceladus and focus particularly on the very intriguing south polar hot spot.
Of course, the success of these flybys hinges on the Cassini mission controllers being able to wake up the dormant spacecraft which has been in safe mode since November 2. Teams will attempt to get Cassini up and running again tomorrow, November 24, and they don’t anticipate any problems.
Cassini went into the protective standby mode and the likely cause of the problem was a faulty program code line, or a flipped bit in the spacecraft’s command and data system computer.
The upcoming flybys of Enceladus will put Cassini very close – about 48 kilometers (30 miles) above the surface. The first will take place on November 30. Pairing this flyby with one on April 28, should provide scientists enough information to determine the nature of the interior right under the hot spot. The next flyby on December 21, Cassini will make 50-kilometer pass over the north pole of Enceladus. The fields and particles instruments will be trying to “sniff” anything coming from the moon.
There will be two three-hour “wing” observations before and after closest-approach (from five to eight hours from closest approach on either side), and then three more hours centered directly around closest approach. The Cassini team is throwing almost the entire gamut of instruments into the flyby program, between radio science (RSS) observations, the imaging science system (ISS) and composite infrared spectrometer (CIRS) which will observe this moon on the inbound leg, and CIRS and the visible and infrared mapping spectrometer (VIMS) which will take data on the outbound leg, with other optical remote sensing and fields, particles and waves instruments also taking data.
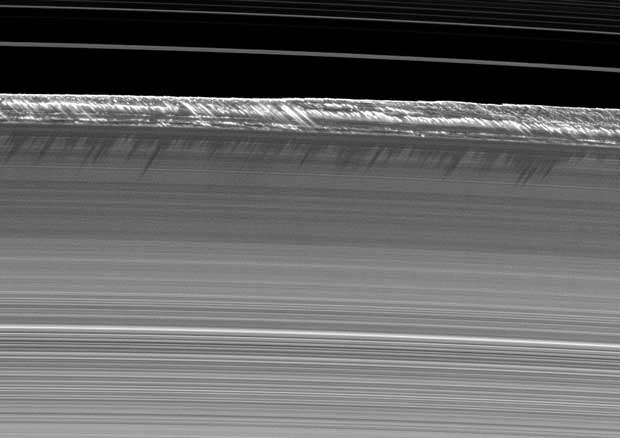
Vertical structures, among the tallest seen in Saturn's main rings, rise abruptly from the edge of Saturn's B ring to cast long shadows on the ring in this image taken by NASA's Cassini spacecraft in 2009.
It has long been known that Saturn’s rings are not the perfect hoops they appear as in small amateur telescopes, and when the Cassini spacecraft entered orbit around Saturn, the wonky disorder of the massive B ring became even more apparent. Scientists were stunned by towering vertical structures, scalloped edges on the rings, and odd propeller-like features. But scientists have now found the cause of these strange features: The region is acting just like a spiral galaxy, said Carolyn Porco, team lead of the Cassini imaging team.
“We have found what we hoped we’d find when we set out on this journey with Cassini nearly 13 years ago,” said Porco, “(and have gotten) visibility into the mechanisms that have sculpted not only Saturn’s rings, but celestial disks of a far grander scale, from solar systems, like our own, all the way to the giant spiral galaxies.”
The B ring is one of the most dynamic areas in Saturn’s rings, and surprisingly, scientists say, the rings are behaving like a miniature version of our own Milky Way galaxy.
When the the Voyager spacecraft flew by Saturn in 1980 and 1981, scientists saw that the outer edge of the planet’s B ring was shaped like a rotating, flattened football by the gravitational perturbations of Mimas. But it was clear, even in Voyager’s findings, that the outer B ring’s behavior was far more complex than anything Mimas alone might do.
Vertical Structures Tower over Saturn’s B-Ring. This image was rendered using Autodesk Maya and Adobe Photoshop. Credit: Kevin Gill.
Through the analysis of thousands of Cassini images of the B ring taken over a four-year period, Porco and her team have found the source of most of the complexity: at least three additional, independently rotating wave patterns, or oscillations, that distort the B ring’s edge.
The oscillations travel around the ring with differing speeds and the small, random motions of the ring particles feed energy into a wave that propagates outward across the ring from an inner boundary, reflects off the outer edge of the B ring (which becomes distorted as a result), and then travels inward until it reflects off the inner boundary. This continuous back-and-forth reflection is necessary for these wave patterns to grow and become visible as distortions in the outer edge of the B ring.
These oscillations, with one, two or three lobes, are not created by any moons. They have instead spontaneously arisen, in part because the ring is dense enough, and the B ring edge is sharp enough, for waves to grow on their own and then reflect at the edge.
The ring particles’ small, random motions feed energy into a wave and cause it to grow. The new results confirm a Voyager-era predication that this same process can explain all the puzzling chaotic waveforms found in Saturn’s densest rings, from tens of meters up to hundreds of kilometers wide.
“This process has already been verified to produce wave features in Saturn’s dense rings that are of small scale…about 150 meters or so,” Porco wrote in her “Captain’s Log” feature on the CICLOPS (Cassini imaging)website. “That it now also appears to produce waves of large, hundreds-of-kilometers scale in the outer B ring suggests that it can operate in dense rings on all spatial scales.”
“These oscillations exist for the same reason that guitar strings have natural modes of oscillation, which can be excited when plucked or otherwise disturbed,” said Joseph Spitale, Cassini imaging team associate and lead author of a new article in the Astronomical Journal, published today. “The ring, too, has its own natural oscillation frequencies, and that’s what we’re observing.”
Astronomers believe such “self-excited” oscillations exist in other disk systems, like spiral disk galaxies and proto-planetary disks found around nearby stars, but they have not been able to directly confirm their existence. The new observations confirm the first large-scale wave oscillations of this type in a broad disk of material anywhere in nature.
Self-excited waves on small, 100-meter (300-foot) scales have been previously observed by Cassini instruments in a few dense ring regions and have been attributed to a process called “viscous overstability.”
Oscillations in Saturn's B ring. Credit: Space Science Institute
“Normally viscosity, or resistance to flow, damps waves — the way sound waves traveling through the air would die out,” said Peter Goldreich, a planetary ring theorist at the California Institute of Technology. “But the new findings show that, in the densest parts of Saturn’s rings, viscosity actually amplifies waves, explaining mysterious grooves first seen in images taken by the Voyager spacecraft.”
“How satisfying it is to find at last one explanation for most, if not all, of the chaotic looking structure we first saw in Saturn’s dense ring regions long ago with Voyager,” said Porco, “and have since seen in exquisite detail with Cassini.”