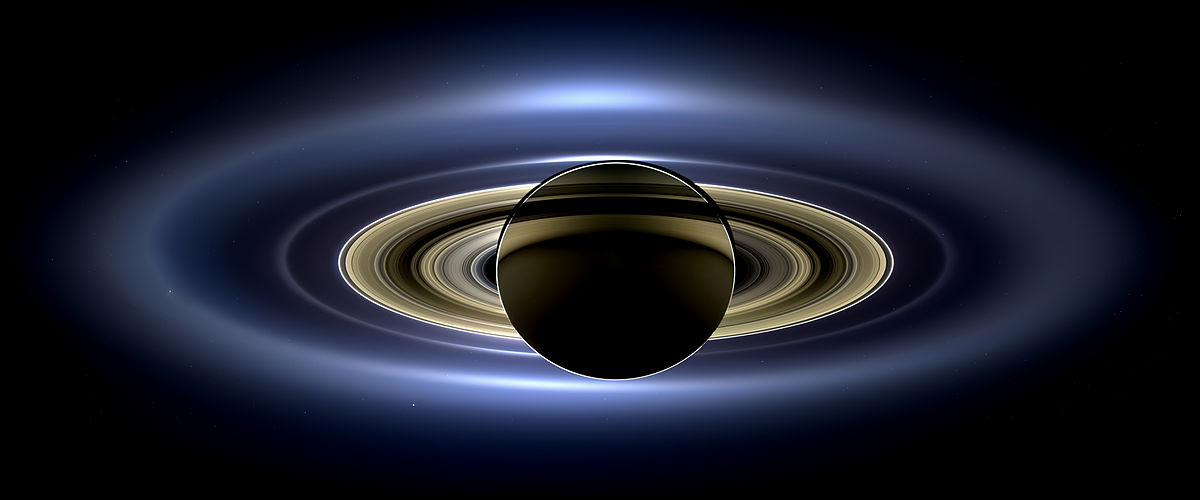
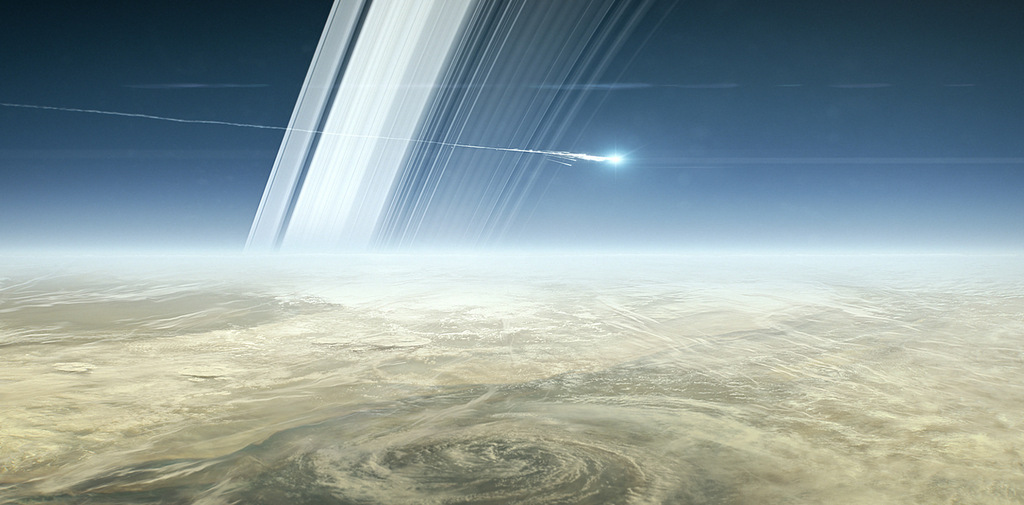
Saturn's rings in all their glory. Image from the Cassini orbiter as Saturn eclipsed the Sun. Image Credit: By NASA / JPL-Caltech / Space Science Institute
Can you imagine the Solar System without Saturn’s rings? Can you envision Earth at the time the dinosaurs roamed the planet? According to a new paper, the two may have coincided.
Data from the Cassini mission shows that Saturn’s rings may be only 10 to 100 million years old. They may not have been there during the reign of the dinosaurs, and may in fact be a fairly modern development in our Solar System.
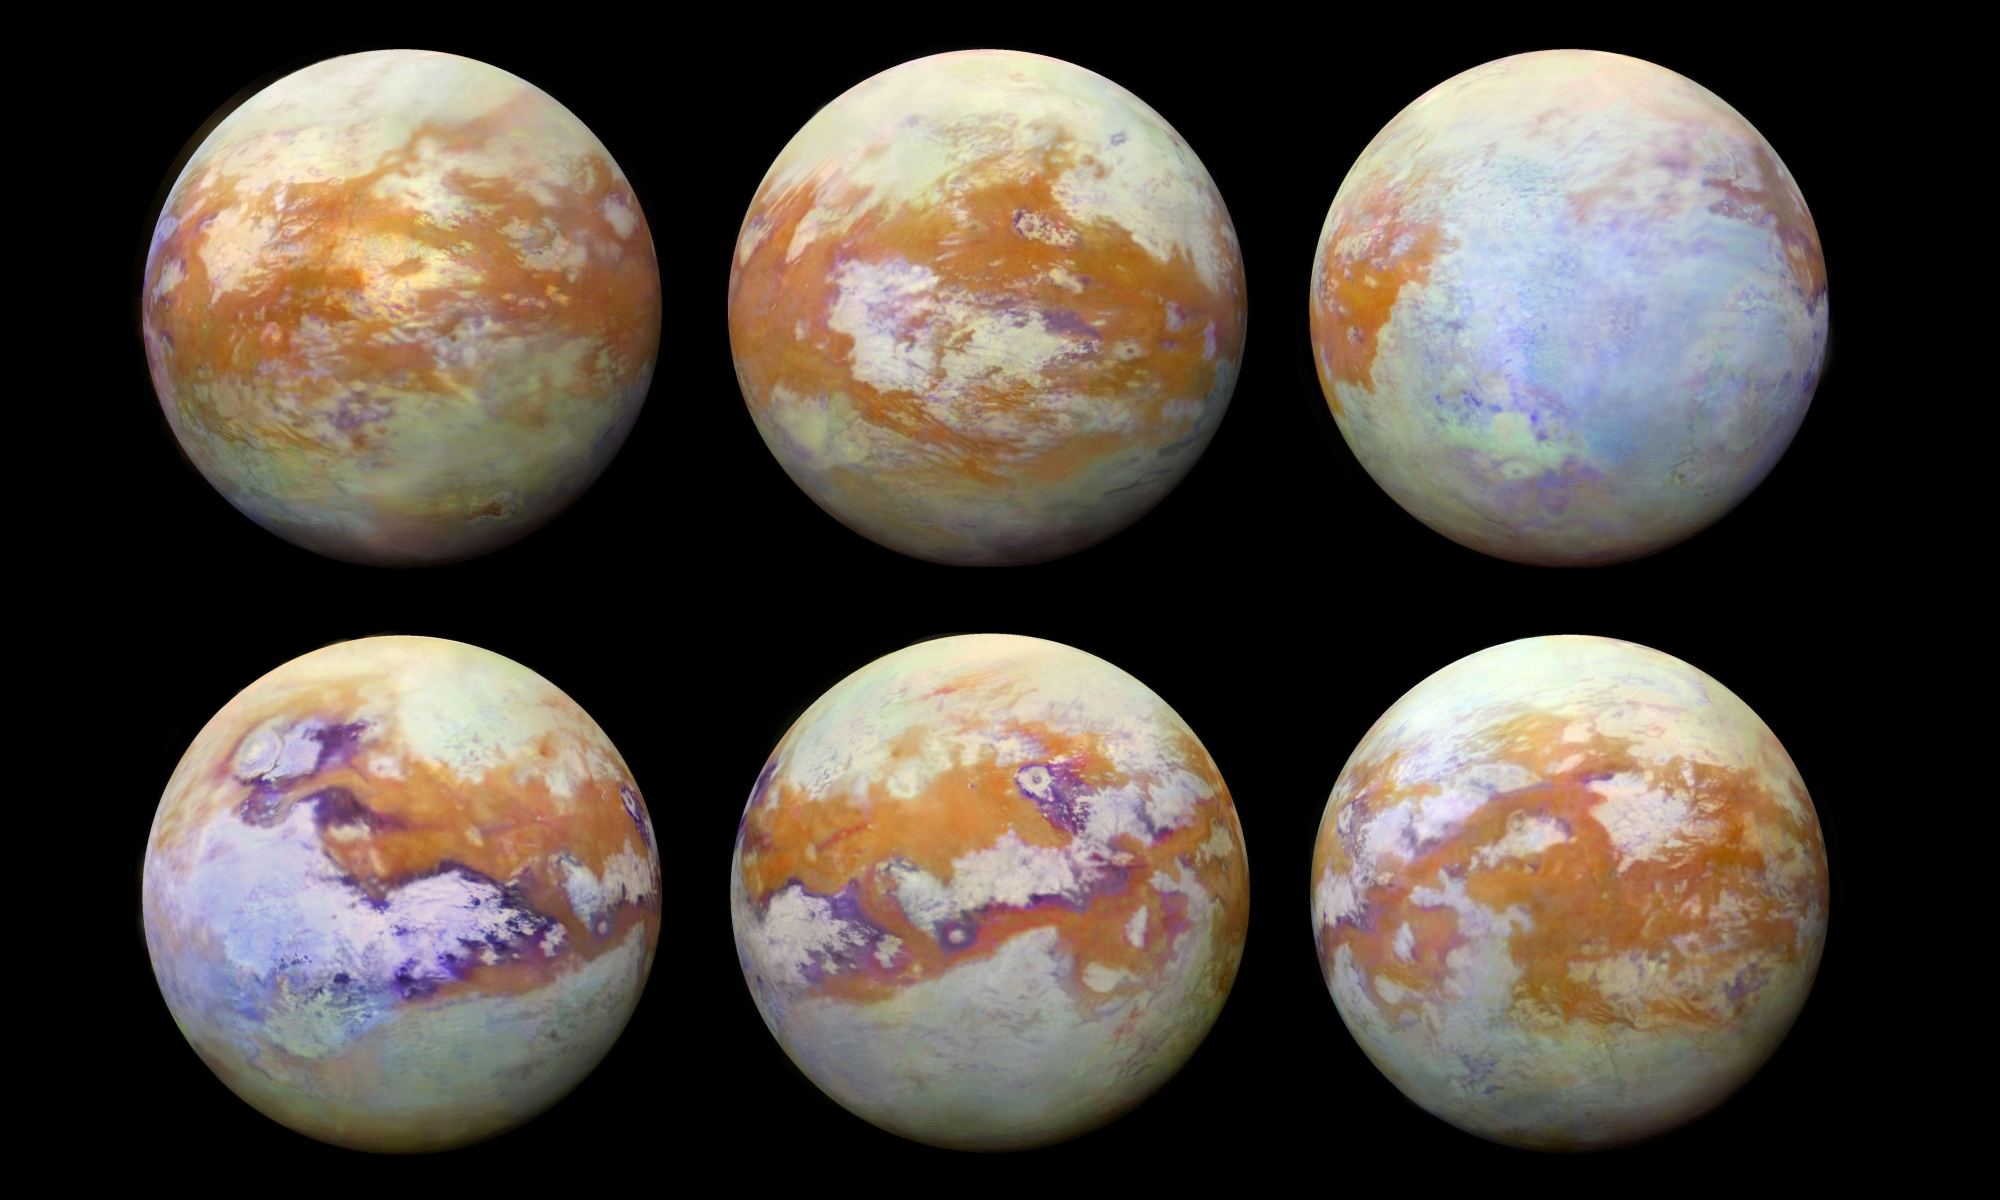
A global mosaic of the surface of Titan, thanks to the infrared eyes of the Cassini spacecraft. Image Credit: NASA/JPL-Caltech/University of Nantes/University of Arizona
Saturn’s moon Titan is a very strange place. It’s surrounded by a dense, opaque atmosphere, the only moon in the solar system with an atmosphere to speak of. It has lakes of liquid methane on its surface, maybe some cryovolcanoes, and some scientists speculate that it could support a form of life. Very weird life.
But we still don’t know a lot about it, because we haven’t really seen much of the surface. Until now.
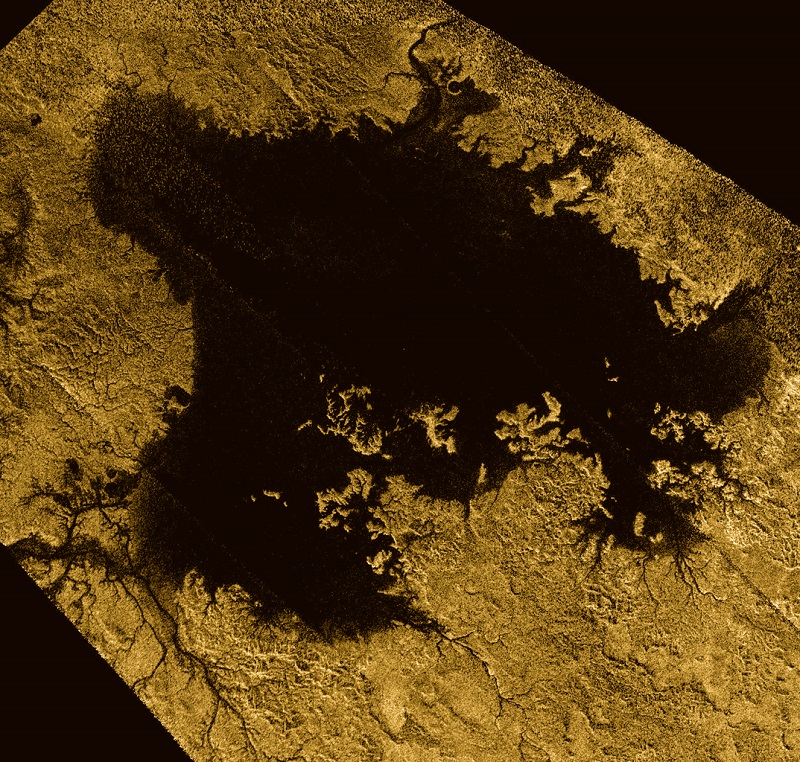
Ligeia Mare, shown in here in data obtained by NASA's Cassini spacecraft, is the second largest known body of liquid on Saturn's moon Titan. It is filled with liquid hydrocarbons, such as ethane and methane, and is one of the many seas and lakes that bejewel Titan's north polar region. Credit: NASA/JPL-Caltech/ASI/Cornell
Thanks to the Cassini mission, we have learned some truly amazing things about Saturn and its largest moon, Titan. This includes information on its dense atmosphere, its geological features, its methane lakes, methane cycle, and organic chemistry. And even though Cassini recently ended its mission by crashing into Saturn’s atmosphere, scientists are still pouring over all of the data it obtained during its 13 years in the Saturn system.
And now, using Cassini data, two teams led by researchers from Cornell University have released two new studies that reveal even more interesting things about Titan. In one, the team created a complete topographic map of Titan using Cassini’s entire data set. In the second, the team revealed that Titan’s seas have a common elevation, much like how we have a “sea level” here on Earth.
This true-color image of Titan, taken by the Cassini spacecraft, shows the moon’s thick, hazy atmosphere. Credit: NASA
In the first paper, the authors described how topographic data from multiple sources was combined to create a global map of Titan. Since only about 9% of Titan was observed with high-resolution topography (and 25-30% in lower resolution) the remainder of the moon was mapped with an interpolation algorithm. Combined with a global minimization process, this reduced errors that would arise from such things as spacecraft location.
The map revealed new features on Titan, as well as a global view of the highs and lows of the moon’s topography. For instance, the maps showed several new mountains which reach a maximum elevation of 700 meters (about 3000 ft). Using the map, scientists were also able to confirm that two locations in the equatorial regions are depressions that could be the result of ancient seas that have since dried up or cryovolcanic flows.
The map also suggests that Titan may be more oblate than previously thought, which could mean that the crust varies in thickness. The data set is available online, and the map which the team created from it is already proving its worth to the scientific community. As Professor Corlies explained in a Cornell press release:
“The main point of the work was to create a map for use by the scientific community… We’re measuring the elevation of a liquid surface on another body 10 astronomical units away from the sun to an accuracy of roughly 40 centimeters. Because we have such amazing accuracy we were able to see that between these two seas the elevation varied smoothly about 11 meters, relative to the center of mass of Titan, consistent with the expected change in the gravitational potential. We are measuring Titan’s geoid. This is the shape that the surface would take under the influence of gravity and rotation alone, which is the same shape that dominates Earth’s oceans.”
False-color mosaic of Titan’s northern lakes, made from infrared data collected by NASA’s Cassini spacecraft. Credit: NASA
Looking ahead, this map will play an important role when it comes tr scientists seeking to model Titan’s climate, study its shape and gravity, and its surface morphology. In addition, it will be especially helpful for those looking to test interior models of Titan, which is fundamental to determining if the moon could harbor life. Much like Europa and Enceladus, it is believed that Titan has a liquid water ocean and hydrothermal vents at its core-mantle boundary.
The second study, which also employed the new topographical map, was based on Cassini radar data that was obtained up to just a few months before the spacecraft burned up in Saturn’s atmosphere. Using this data, Assistant Professor Hayes and his team determined that Titan’s seas follow a constant elevation relative to Titan’s gravitational pull. Basically, they found that Titan has a sea level, much like Earth. As Hayes explained:
“We’re measuring the elevation of a liquid surface on another body 10 astronomical units away from the sun to an accuracy of roughly 40 centimeters. Because we have such amazing accuracy we were able to see that between these two seas the elevation varied smoothly about 11 meters, relative to the center of mass of Titan, consistent with the expected change in the gravitational potential. We are measuring Titan’s geoid. This is the shape that the surface would take under the influence of gravity and rotation alone, which is the same shape that dominates Earth’s oceans.”
This common elevation is important because liquid bodies on Titan appear to be connected by something resembling an aquifer system. Much like how water flows underground through porous rock and gravel on Earth, hydrocarbons do the same thing under Titan’s icy surface. This ensures that there is transference between large bodies of water, and that they share a common sea level.
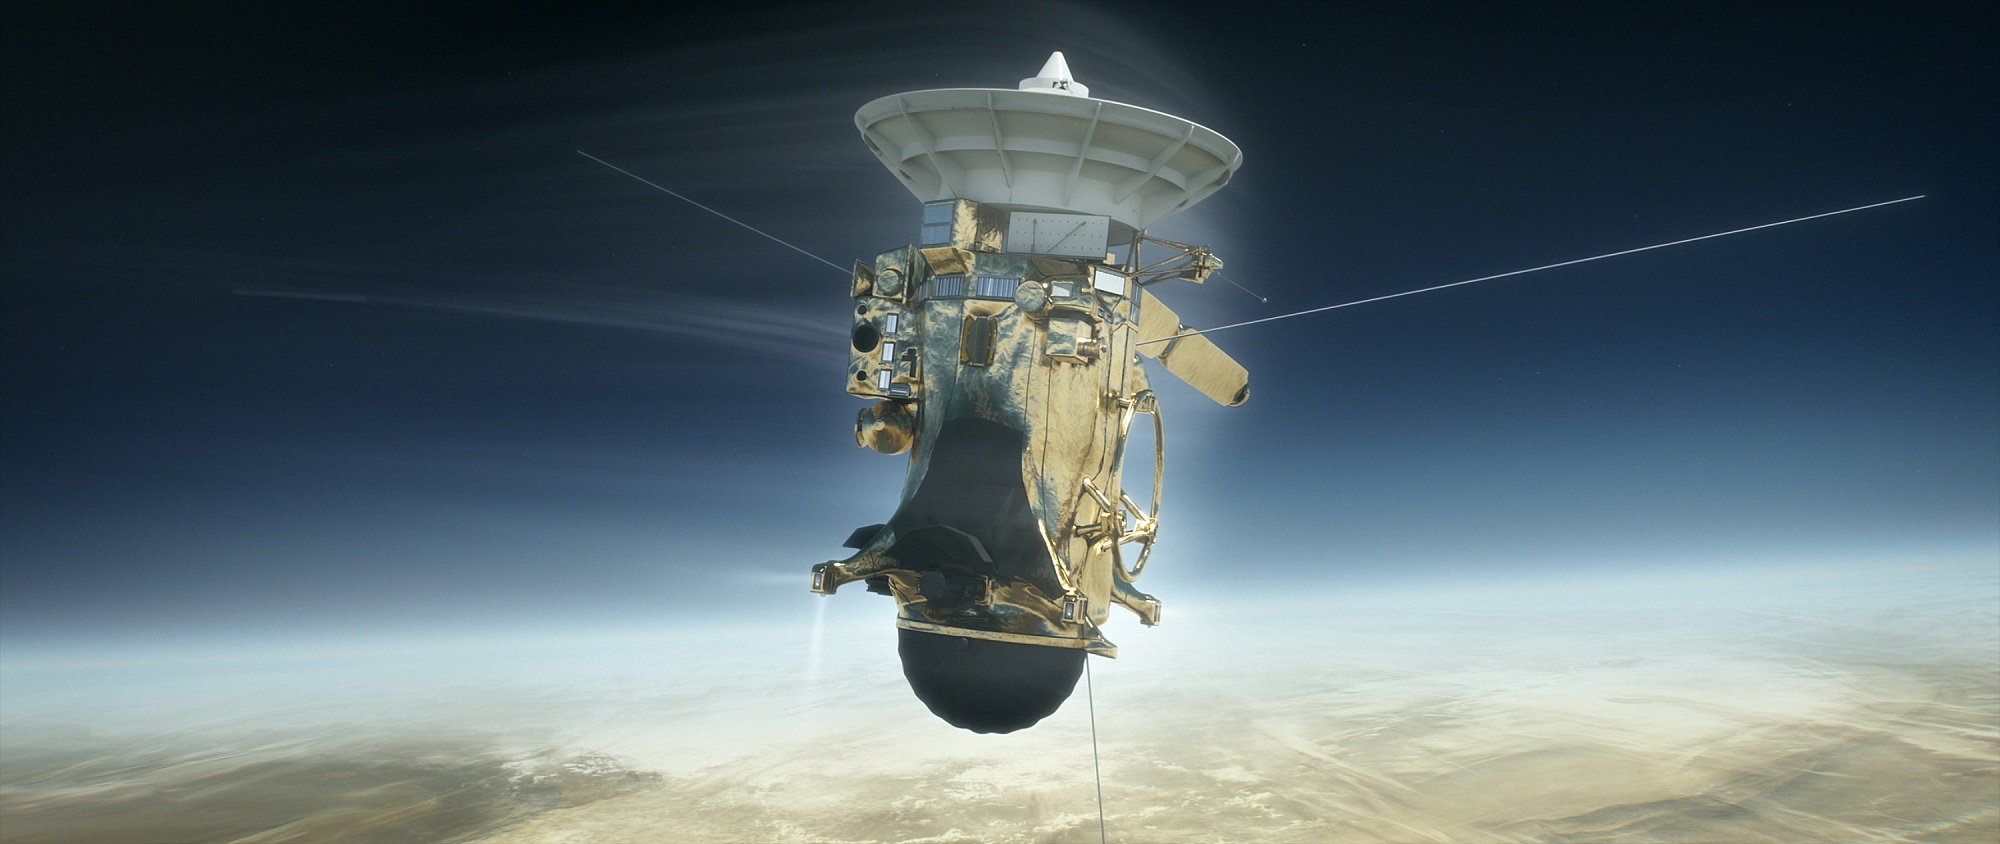
Artist concept of Cassini’s last moments at Saturn. Credit: NASA/JPL.
“We don’t see any empty lakes that are below the local filled lakes because, if they did go below that level, they would be filled themselves,” said Hayes. “This suggests that there’s flow in the subsurface and that they are communicating with each other. It’s also telling us that there is liquid hydrocarbon stored on the subsurface of Titan.”
Meanwhile, smaller lakes on Titan appear at elevations several hundred meters above Titan’s sea level. This is not dissimilar to what happens on Earth, where large lakes are often found at higher elevations. These are known as “Alpine Lakes”, and some well-known examples include Lake Titicaca in the Andes, Lakes Geneva in the Alps, and Paradise Lake in the Rockies.
Last, but not least, the study also revealed the vast majority of Titan’s lakes are found within sharp-edged depressions that are surrounded by high ridges, some of which are hundreds of meters high. Here too, there is a resemblance to features on Earth – such as the Florida Everglades – where underlying material dissolves and causes the surface to collapse, forming holes in the ground.
The shape of these lakes indicate that they may be expanding at a constant rate, a process known as uniform scarp retreat. In fact, the largest lake in the south – Ontario Lacus – resembles a series of smaller empty lakes that have coalesced to form a single feature. This process is apparently due to seasonal change, where autumn in the southern hemisphere leads to more evaporation.
While the Cassini mission is no longer exploring the Saturn system, the data it accumulated during its multi-year mission is still bearing fruit. Between these latest studies, and the many more that will follow, scientists are likely to reveal a great deal more about this mysterious moon and the forces that shape it!
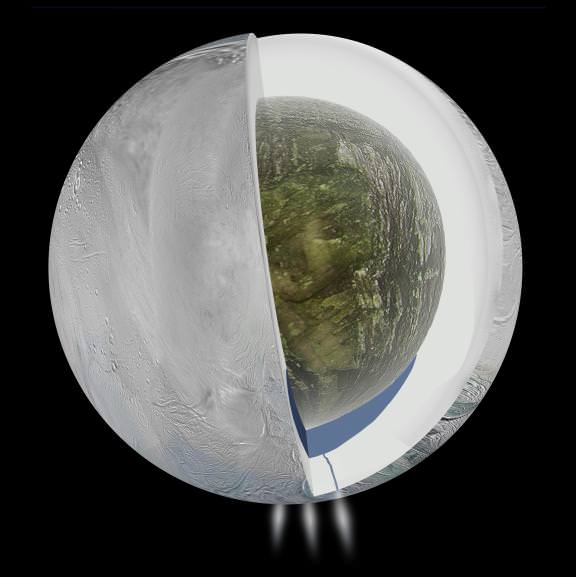
Cutaway showing the interior of Saturn's moon Enceladus. Credit: ESA
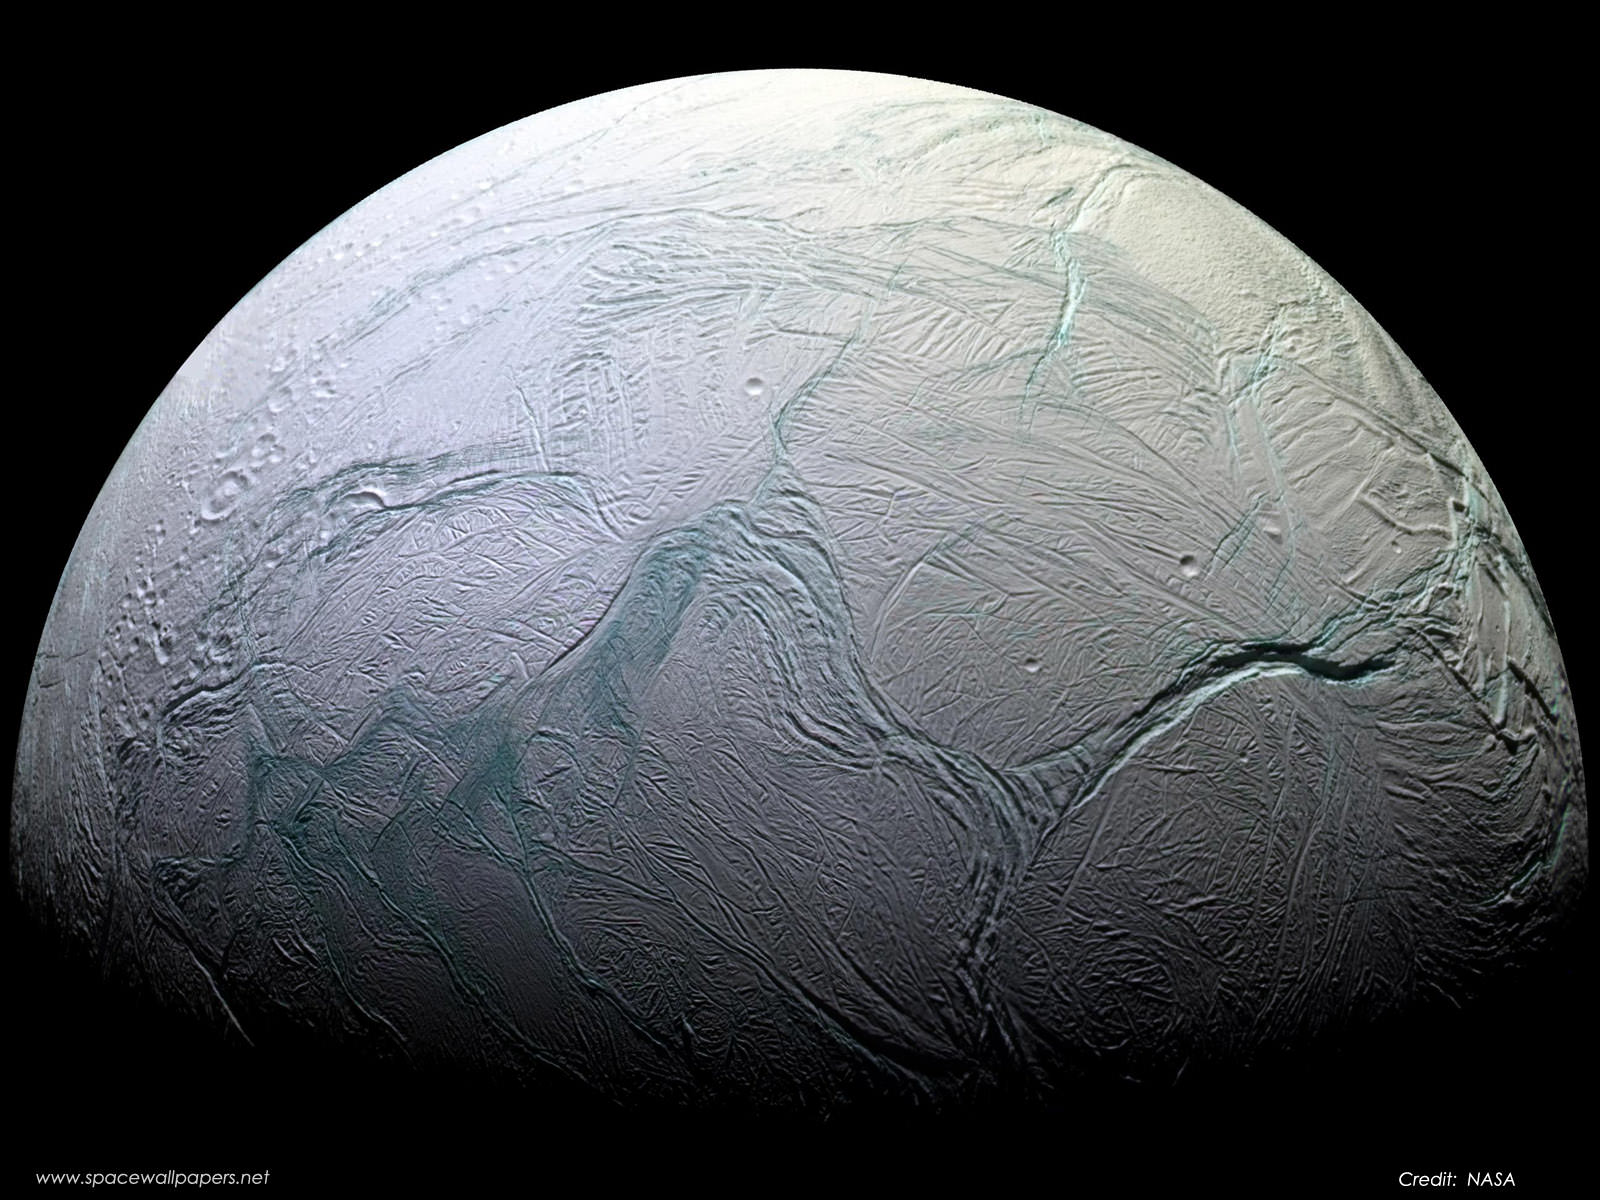
When the Cassini mission arrived in the Saturn system in 2004, it discovered something rather unexpected in Enceladus’ southern hemisphere. From hundreds of fissures located in the polar region, plumes of water and organic molecules were spotted periodically spewing forth. This was the first indication that Saturn’s moon may have an interior ocean caused by hydrothermal activity near the core-mantle boundary.
According to a new study based on Cassini data, which it obtained before diving into Saturn’s atmosphere on September 15th, this activity may have been going on for some time. In fact, the study team concluded that if the moon’s core is porous enough, it could have generated enough heat to maintain an interior ocean for billions of years. This study is the most encouraging indication yet that the interior of Enceladus could support life.
Artist’s rendering of possible hydrothermal activity that may be taking place on and under the seafloor of Enceladus. Credit: NASA/JPL
Prior to the Cassini mission’s many flybys of Enceladus, scientists believed this moon’s surface was composed of solid ice. It was only after noticing the plume activity that they came to realize that it had water jets that extended all the way down to a warm-water ocean in its interior. From the data obtained by Cassini, scientists were even able to make educated guesses of where this internal ocean lay.
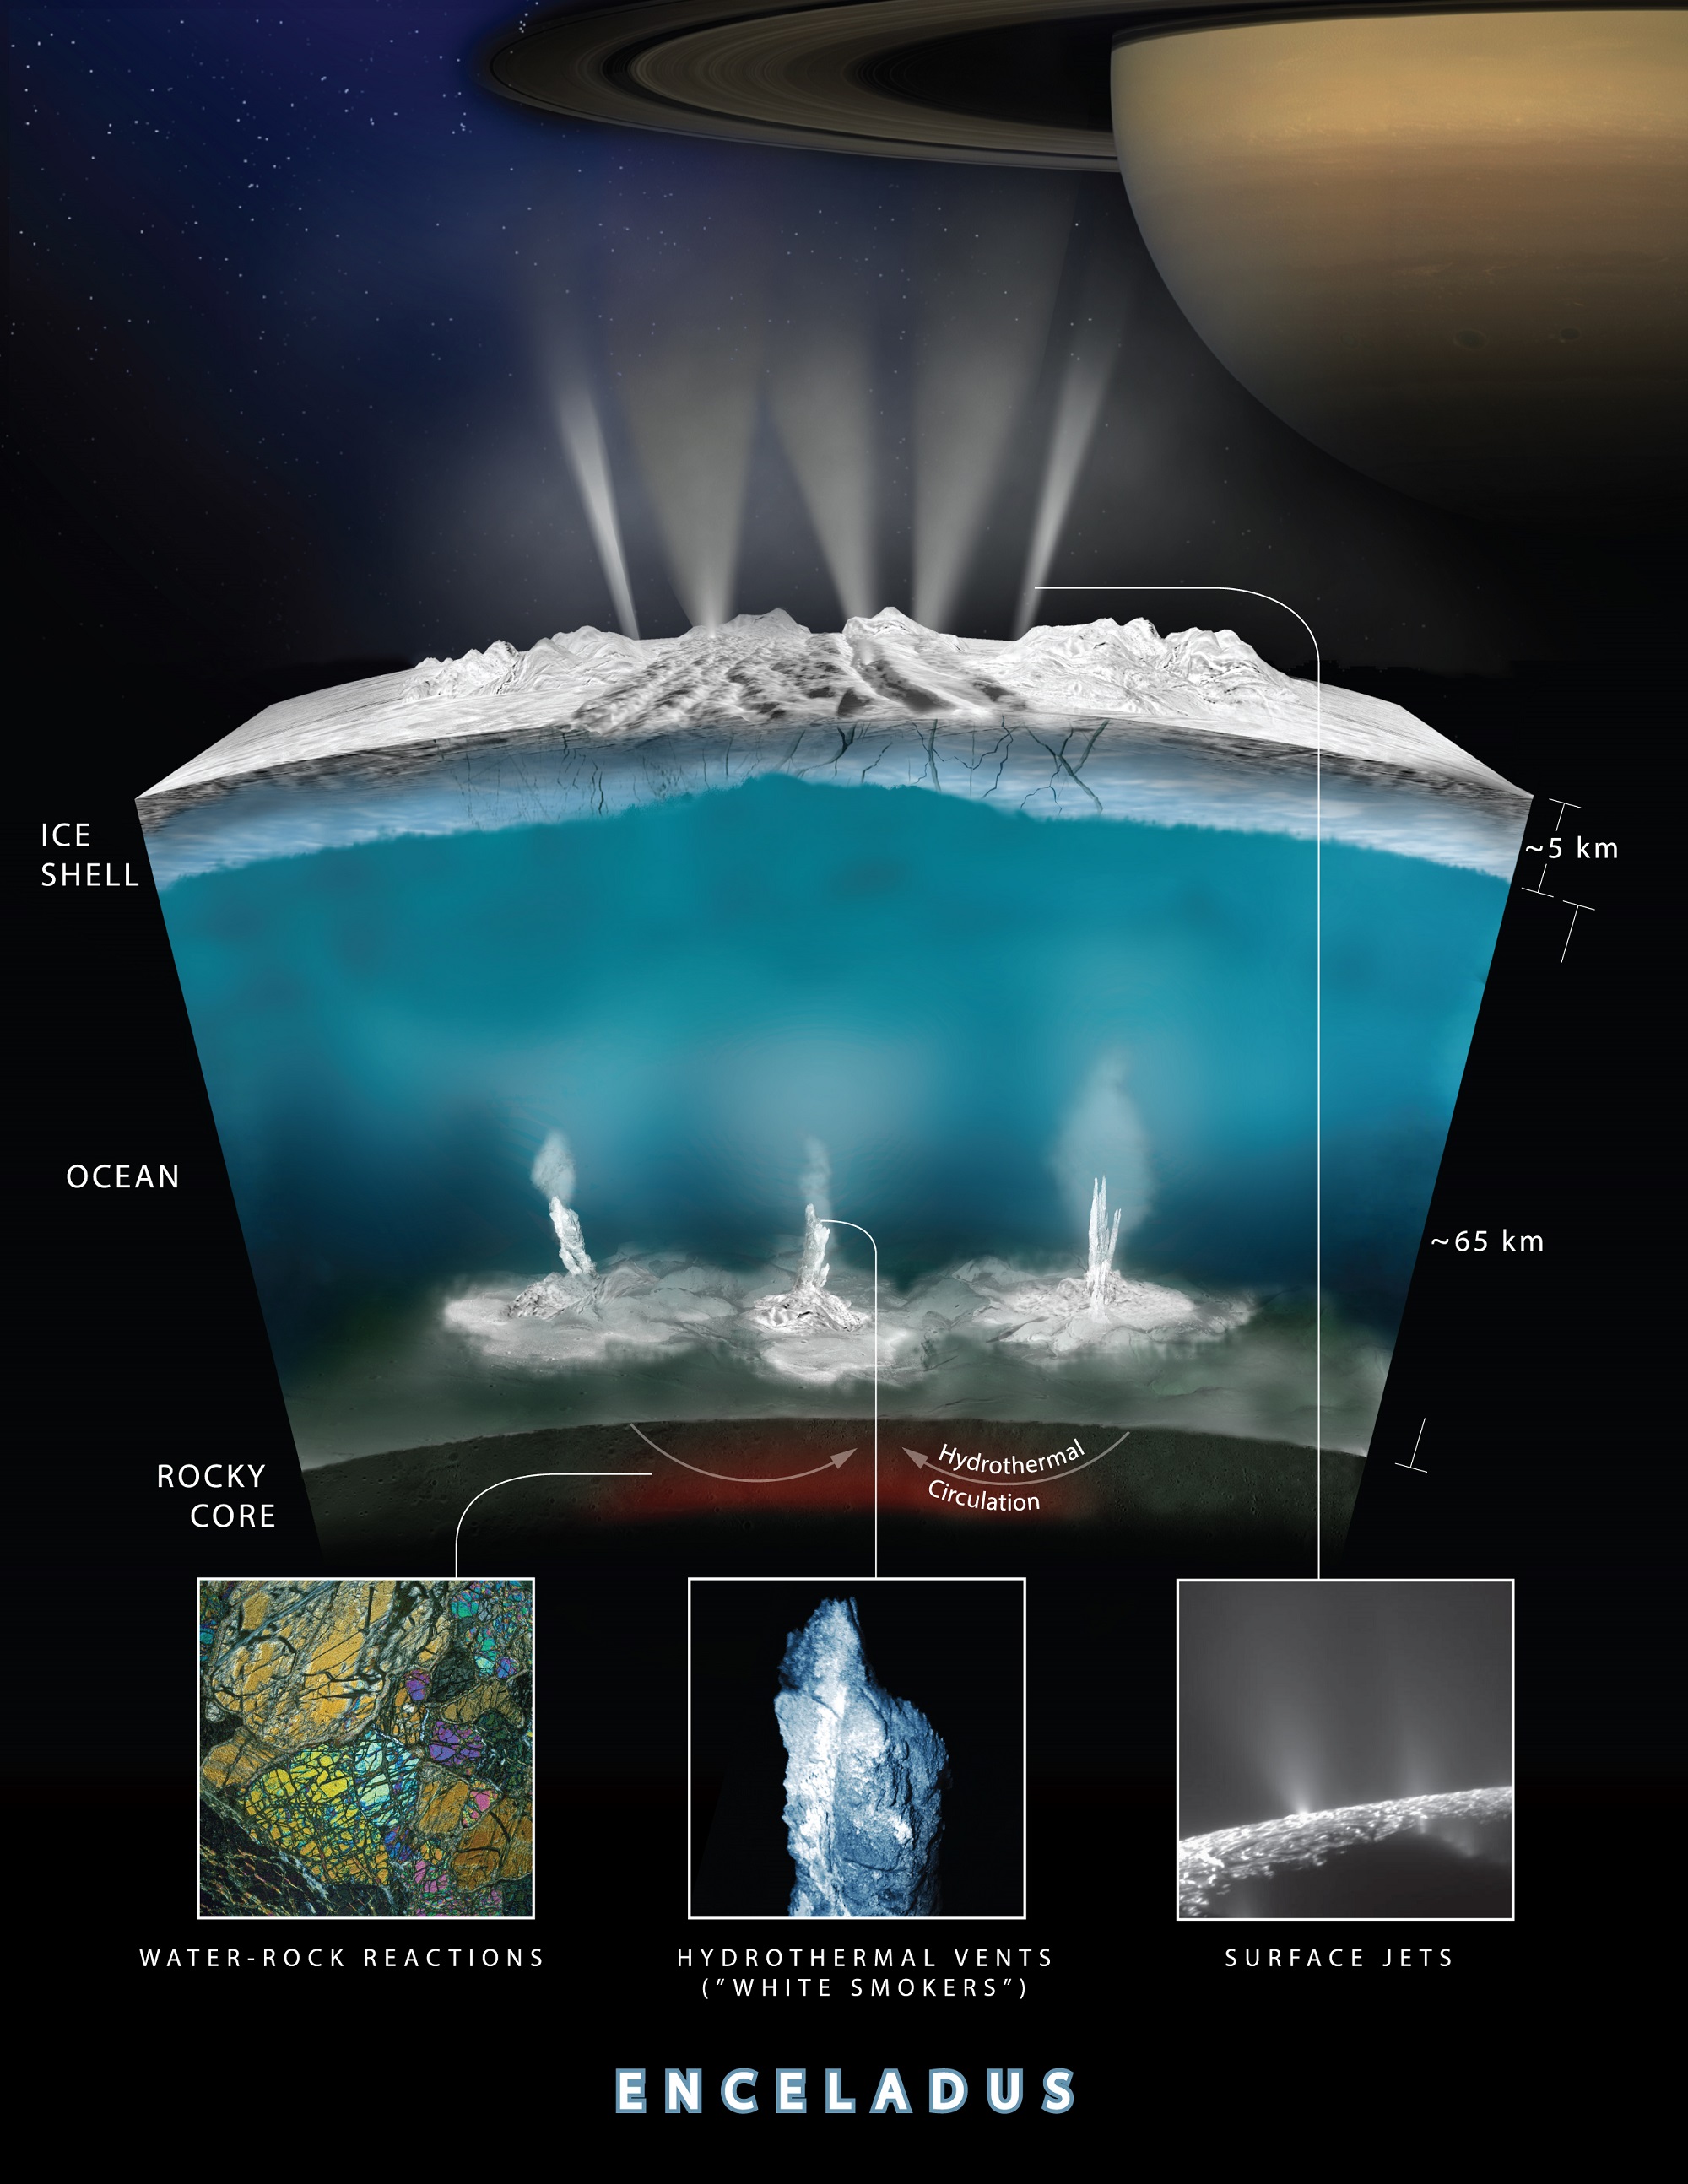
All told, Enceladus is a relatively small moon, measuring some 500 km (311 mi) in diameter. Based on gravity measurements performed by Cassini, its interior ocean is believed to lie beneath an icy outer surface at depths of 20 to 25 km (12.4 to 15.5 mi). However, this surface ice thins to about 1 to 5 km (0.6 to 3.1 mi) over the southern polar region, where the jets of water and icy particles jet through fissures.
Based on the way Enceladus orbits Saturn with a certain wobble (aka. libration), scientists have been able to make estimates of the ocean’s depth, which they place at 26 to 31 km (16 to 19 mi). All of this surrounds a core which is believed to be composed of silicate minerals and metal, but which is also porous. Despite all these findings, the source of the interior heat has remained something of an open question.
This mechanism would have to be active when the moon formed billions of years ago and is still active today (as evidenced by the current plume activity). As Dr. Choblet explained in an ESA press statement:
“Where Enceladus gets the sustained power to remain active has always been a bit of mystery, but we’ve now considered in greater detail how the structure and composition of the moon’s rocky core could play a key role in generating the necessary energy.”
Gravity measurements by NASA’s Cassini spacecraft and Deep Space Network suggest that Saturn’s moon Enceladus, which has jets of water vapor and ice gushing from its south pole, also harbors a large interior ocean beneath an ice shell, as this illustration depicts. Credit: NASA/JPL-Caltech
For years, scientists have speculated that tidal forces caused by Saturn’s gravitational influence are responsible for Enceladus’ internal heating. The way Saturn pushes and pulls the moon as it follows an elliptical path around the planet is also believed to be what causes Enceladus’ icy shell to deform, causing the fissures around the southern polar region. These same mechanisms are believed to be what is responsible for Europa’s interior warm-water ocean.
However, the energy produced by tidal friction in the ice is too weak to counterbalance the heat loss seen from the ocean. At the rate Enceladus’ ocean is losing energy to space, the entire moon would freeze solid within 30 million years. Similarly, the natural decay of radioactive elements within the core (which has been suggested for other moons as well) is also about 100 times too weak to explain Enceladus interior and plume activity.
To address this, Dr. Choblet and his team conducted simulations of Enceladus’ core to determine what kind of conditions could allow for tidal heating over billions of years. As they state in their study:
“In absence of direct constraints on the mechanical properties of Enceladus’ core, we consider a wide range of parameters to characterize the rate of tidal friction and the efficiency of water transport by porous flow. The unconsolidated core of Enceladus can be viewed as a highly granular/fragmented material, in which tidal deformation is likely to be associated with intergranular friction during fragment rearrangements.”
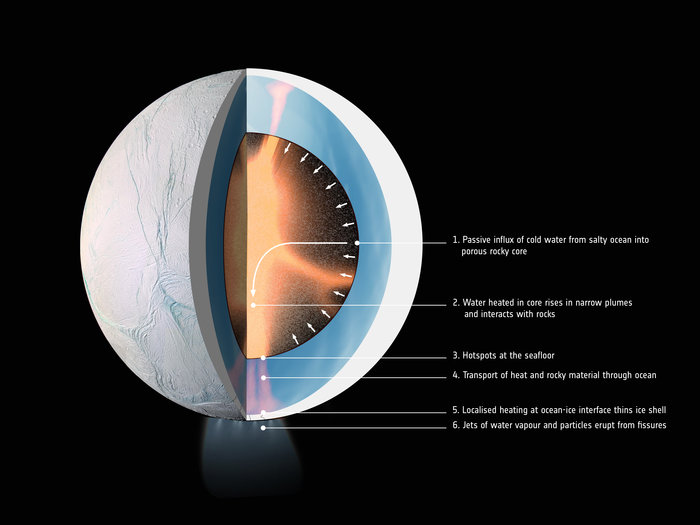
Artist rendering showing an interior cross-section of the crust of Enceladus, which shows how hydrothermal activity may be causing the plumes of water at the moon’s surface.Credits: NASA-GSFC/SVS, NASA/JPL-Caltech/Southwest Research Institute
What they found was that in order for the Cassini observations to be borne out, Enceladus’ core would need to be made of unconsolidated, easily deformable, porous rock. This core could be easily permeated by liquid water, which would seep into the core and gradually heated through tidal friction between sliding rock fragments. Once this water was sufficiently heated, it would rise upwards because of temperature differences with its surroundings.
This process ultimately transfers heat to the interior ocean in narrow plumes which rise to the meet Enceladus’ icy shell. Once there, it causes the surface ice to melt and forming fissures through which jets reach into space, spewing water, ice particles and hydrated minerals that replenish Saturn’s E-Ring. All of this is consistent with the observations made by Cassini, and is sustainable from a geophysical point of view.
In other words, this study is able to show that action in Enceladus’ core could produce the necessary heating to maintain a global ocean and produce plume activity. Since this action is a result of the core’s structure and tidal interaction with Saturn, it is perfectly logical that it has been taking place for billions of years. So beyond providing the first coherent explanation for Enceladus’ plume activity, this study is also a strong indication of habitability.
As scientists have come to understand, life takes a long time to get going. On Earth, it is estimated that the first microorganisms arose after 500 million years, and hydrothermal vents are believed to have played a key role in that process. It took another 2.5 billion years for the first multi-cellular life to evolve, and land-based plants and animals have only been around for the past 500 million years.
Knowing that moons like Enceladus – which has the necessary chemistry to support for life – has also had the necessary energy for billions of years is therefore very encouraging. One can only imagine what we will find once future missions begin inspecting its plumes more closely!
Artist's rendering of possible hydrothermal activity that may be taking place on and under the seafloor of Enceladus. Image Credit:
NASA/JPL
Ever since the Cassini mission entered the Saturn system and began studying its moons, Enceladus has become a major source of interest. Once the probe detected plumes of water and organic molecules erupting from the moon’s southern polar region, scientists began to speculate that Enceladus may possess a warm-water ocean in its interior – much like Jupiter’s moon Europa and other bodies in our Solar System.
In the future, NASA hopes to send another mission to this system to further explore these plumes and the interior of Enceladus. This mission will likely include a new instrument that was recently announced by NASA, known as the Submillimeter Enceladus Life Fundamentals Instrument (SELFI). This instrument, which was proposed by a team from the NASA Goddard Space Flight Center, recently received support for further development.
Prior to the Cassini mission, scientists thought that the surface of Enceladus was frozen solid. However, Cassini data revealed a slight wobble in the moon’s orbit that suggested the presence of an interior ocean. Much like Europa, this is caused by tidal forces that cause flexing in the core, which generates enough heat to hold liquid water in the interior. Around the southern pole, this results in the ice cracking open and forming fissures.
Artist rendering showing an interior cross-section of the crust of Enceladus, which shows how hydrothermal activity may be causing the plumes of water at the moon’s surface. Credits: NASA-GSFC/SVS, NASA/JPL-Caltech/Southwest Research Institute
The Cassini mission also discovered plumes emanating from about 100 different fissures which continuously spew icy particles, water vapor, carbon dioxide, methane, and other gases into space. To study these more closely, NASA has been developing some ambitious instruments that will rely on millimeter-wave or radio frequency (RF) waves to determine their composition and learn more about Enceladus’ interior ocean.
According to SELFI Principal Investigator Gordon Chin, SELFI represents a significant improving over existing submillimeter-wavelenght devices. Once deployed, it will measure traces of chemicals in the plumes of water and icy parties that periodically emanated from Enceladus’ southern fissures, also known as “Tiger Stripes“. In addition to revealing the chemical composition of the ocean, this instrument will also indicate it’s potential for supporting life.
On Earth, hydrothermal vents are home to thriving ecosystems, and are even suspected to be the place where life first emerged on Earth. Hence why scientists are so eager to study hydrothermal activity on moons like Enceladus, since these could represent the most likely place to find extra-terrestrial life in our Solar System. As Chin indicated in a NASA press statement:
“Submillimeter wavelengths, which are in the range of very high-frequency radio, give us a way to measure the quantity of many different kinds of molecules in a cold gas. We can scan through all the plumes to see what’s coming out from Enceladus. Water vapor and other molecules can reveal some of the ocean’s chemistry and guide a spacecraft onto the best path to fly through the plumes to make other measurements directly.”
The “Tiger Stripes” of Enceladus, as pictured by the Cassini space probe. Credit: NASA/JPL/ESA
Molecules like water, carbon dioxide and other elements broadcast specific radio frequencies, which submillimeter spectrometers are sensitive to. The spectral lines are very discrete, and the intensity at which they broadcast can be used to quantify their existence. In other words, instruments like SELFI will not only be able to determine the chemical composition of Enceladus’ interior ocean, but also the abundance of those chemicals.
For decades, spectrometers have been used in space sciences to measure the chemical compositions of planets, stars, comets and other targets. Most recently, scientists have been attempting to obtain spectra from distant planets in order to determine the chemical compositions of their atmospheres. This is crucial when it comes to finding potentially-habitable exoplanets, since water vapor, nitrogen and oxygen gas are all required for life as we know it.
Performing scans in the submillimeter band is a relatively new process, though, since submillimeter-sensitive instruments are complex and difficult to build. But with help of NASA research-and-development funding, Chin and his colleagues are increasing the instrument’s sensitivity using an amplifier that will boost the signal to around 557 GHz. This will allow SELFI to detect even minute traces of water and gases coming from the surface of Enceladus.
Other improvements include a more energy-efficient and flexible radio frequency data-processing system, as well as a sophisticated digital spectrometer for the RF signal. This latter improvement will employ high-speed programmable circuitry to convert RF data into digital signals that can be analyzed to measure gas quantities, temperatures, and velocities from Enceladus’ plumes.
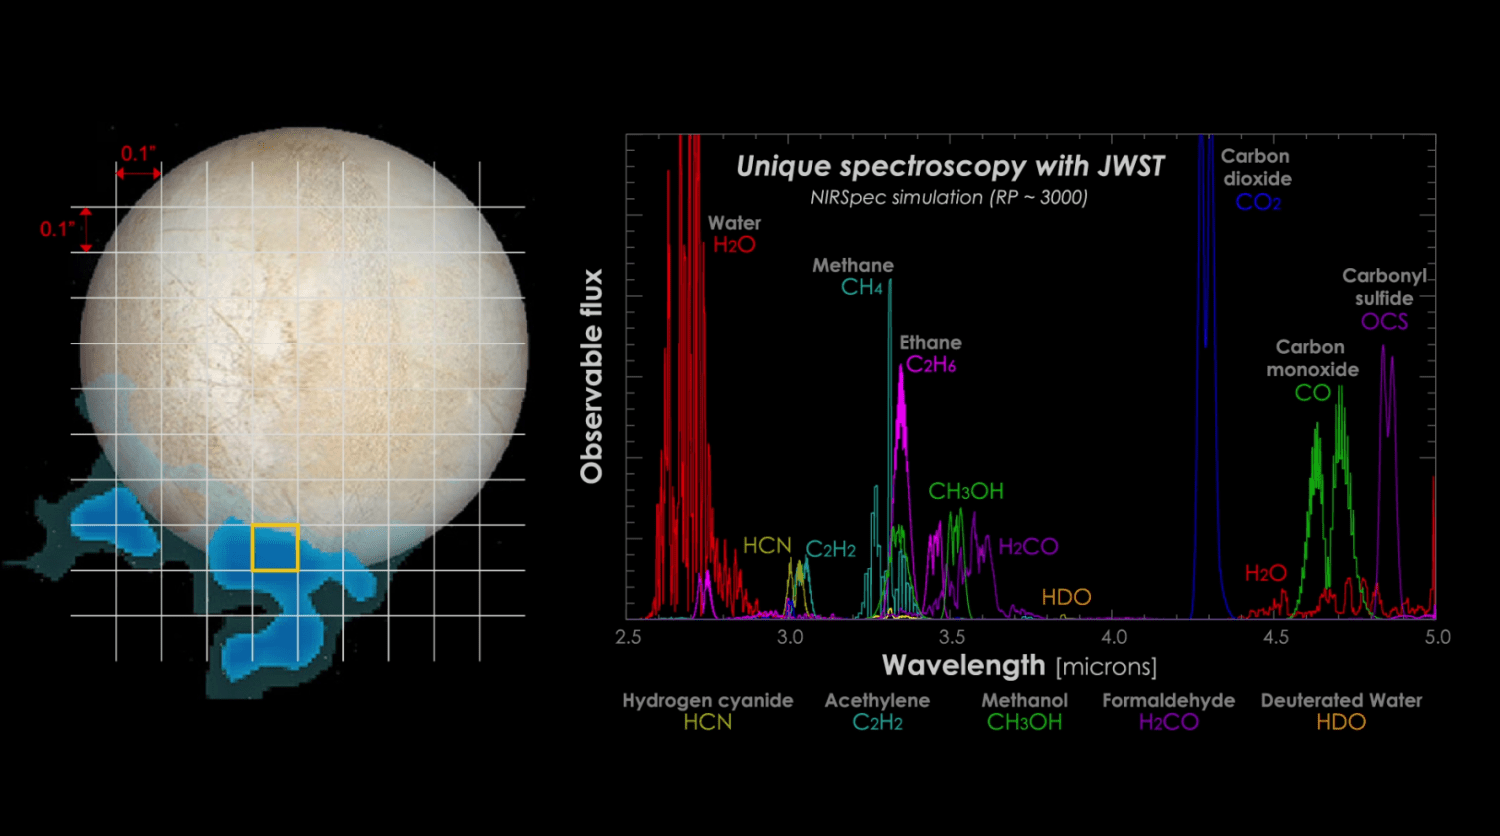
Possible spectroscopy results from one of Europa’s water plumes. This is an example of the data the Webb telescope could return. Credit: NASA-GSFC/SVS, Hubble Space Telescope, Stefanie Milam, Geronimo Villanueva
These enhancements will allow SELFI to simultaneously detect and analyze 13 different types of molecules, which include various isotopes of water, methanol, ammonia, ozone, hydrogen peroxide, sulfur dioxide, and sodium chloride (aka. salt). Beyond Enceladus, Chin believes the team can sufficiently improve the instrument for proposed future missions. “SELFI is really new,”he said. “This is one of the most ambitious submillimeter instruments ever built.”
For instance, in recent years, scientists have spotted plume activity coming from the surface of Europa. Here too, this activity is believed to be the result of geothermal activity, which sends warm water plumes from the moon’s interior ocean to the surface. Already, NASA hopes to examine these plumes and those on Enceladus using the James Webb Space Telescope, which will be deploying in 2019.
Another possibility would be to equip the proposed Europa Clipper – which is set to launch between 2022 and 2025 – with an instrument like SELFI. The instrument package for this probe already calls for a spectrometer, but an improved submillimeter-wave and RF device could allow for a more detailed look at Europa’s plumes. This data could in turn resolve the decades-old debate as to whether or not Europa’s interior is capable of supporting life.
In the coming decades, one of the greatest priorities of space exploration is to investigate the Solar System’s “Ocean Worlds” for signs of life. To see this through, NASA and other space agencies are busy developing the necessary tools to sniff out all the chemical and biological indicators. Within a decade, with any luck, we might just find that life on Earth is not the exception, but part of a larger norm.
Google Maps now lets users explore the Solar System. Credit: NASA/Google
Chances are, at one time or another, we’ve all used Google Maps to find the shortest route from point A to point B. But if you are like some people, you’ve used this mapping tool to have a look at geographical features or places you hope to visit someday. In an age where digital technology is allowing for telecommuting and even telepresence, it’s nice to take virtual tours of the places we may never get to see in person.
But now, Google Maps is using its technology to enable the virtual exploration of something far grander: the Solar System! Thanks to images provided by the Cassini orbiter of the planets and moons it studied during its 20 year mission, Google is now allowing users to explore places like Venus, Mercury, Mars, Europa, Ganymede, Titan, and other far-off destinations that are impossible for us to visit right now.
Similar to how Google Earth uses satellite imagery to create 3D representations of our planet, this new Google Maps tool relies on the more than 500,000 images taken by Cassini as it made its way across the Solar System. This probe recently concluded its 20 year mission, 13 of which were spent orbiting Saturn and studying its system of moons, by crashing into the atmosphere of Saturn.
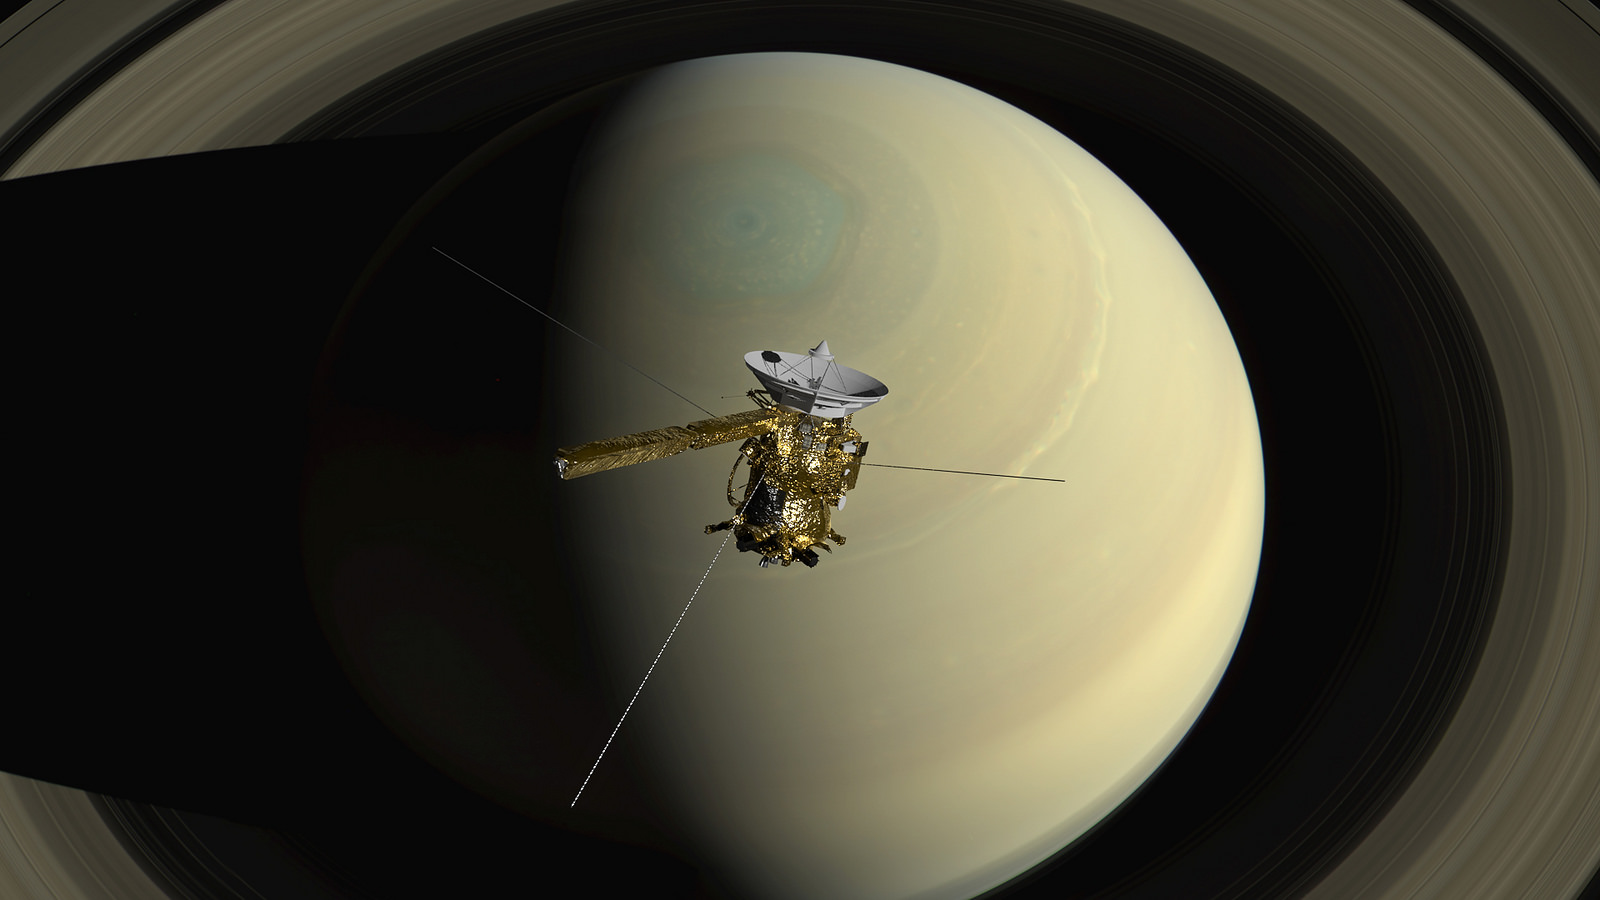
Artist rendition of the Cassini spacecraft over Saturn. Credit: NASA/JPL-Caltech/SSI/Kevin M. Gill.
After launching from Earth on October 15th, 1997, Cassini conducted a flyby of Venus in order to pick up a gravity-assist. It then flew by Earth, obtaining a second gravity-assist, while making its way towards the Asteroid Belt. Before reaching the Saturn System, where it would begin studying the gas giant and its moons, Cassini also conducted a flyby of Jupiter – snapping pictures of its moons, rings, and Great Red Spot.
When it reached Saturn in July of 2004, Cassini went to work studying the planet and its larger moons – particularly Titan and Enceladus. During the next 13 years and 76 days, the probe would provide breathtaking images and sensor data on Saturn’s rings, atmosphere and polar storms and reveal things about Titan’s surface that were never before seen (such as its methane lakes, hydrological cycle, and surface features).
It’s flybys of Enceladus also revealed some startling things about this icy moon. Aside from detecting a tenuous atmosphere of ionized water vapor and Enceladus’ mysterious “Tiger Stripes“, the probe also detected jets of water and organic molecules erupting from the moon’s southern polar region. These jets, it was later determined, were indicative of a warm water ocean deep in the moon’s interior, and possibly even life!
Interestingly enough, the original Cassini mission was only planned to last for four years once it reached Saturn – from June 2004 to May 2008. But by the end of this run, the mission was extended with the Cassini Equinox Mission, which was intended to run until September of 2010. It was extended a second time with the Cassini Solstice Mission, which lasted until September 15th, 2017, when the probe was crashed into Saturn’s atmosphere.
Artist’s impression of the Cassini orbiter entering Saturn’s atmosphere. Credit: NASA/JPL
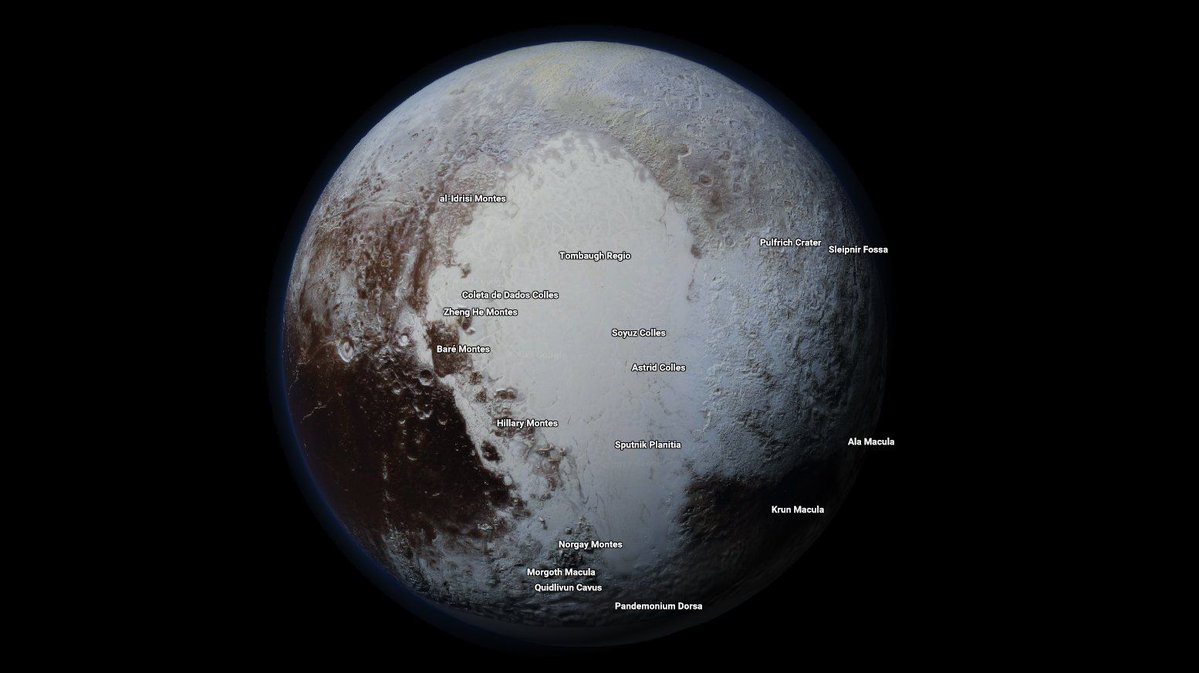
Thanks to all the images taken by this long-lived mission, Google Maps is now able to offer exploratory tours of 16 celestial bodies in the Solar System – 12 of which are new to the site. These include Earth, the Moon, Mercury, Venus, Mars, Pluto, Ceres, Io, Europa, Ganymede, Mimas, Enceladus, Dione, Rhea, Titan, Iapetus and (available as of July 2017) the International Space Station.
This latest development also builds on several extensions Google has released over the years. These include Google Moon, which was released on July 20th, 2005, to coincide with the 36th anniversary of the Apollo 11 Moon Landing. Then there was Google Sky (introduced in 2007), which used photographs taken by the Hubble Space Telescope to create a virtual map of the visible universe.
Then there was Google Mars, the result of a collaborative effort between Google and NASA scientists at the Mars Space Flight Facility released in 2011, one year before the Curiosity rover landed on the Red Planet. This tool relied on data collected by the Mars Global Surveyor and the Mars Odyssey missions to create high-resolution 3D terrain maps that included elevations.
In an age of high-speed internet and telecommunications, using the internet to virtually explore the many planets and bodies of the Solar System just makes sense. Especially when you consider that even the most ambitious plans to conduct tourism to Mars or the Moon (looking at you, Elon Musk and Richard Branson!) are not likely to bear fruit for many years, and cost an arm and a leg to boot!
In the future, similar technology could lead to all kinds of virtual exploration. This concept, which is often referred to as “telexploration”, would involve robotic missions traveling to other planets and even star systems. The information they gather would then be sent back to Earth to create virtual experiences, which would allow scientists and space-exploration enthusiasts to feel like they were seeing it firsthand.
In truth, this mapping tool is just the latest gift to be bestowed by the late Cassini mission. NASA scientists expect to be sifting through the volumes of data collected by the orbiter for years to come. Thanks to improvements made in software applications and the realms of virtual and augmented reality, this data (and that of present and future missions) is likely to be put to good use, enabling breathtaking and educational tours of our Universe!
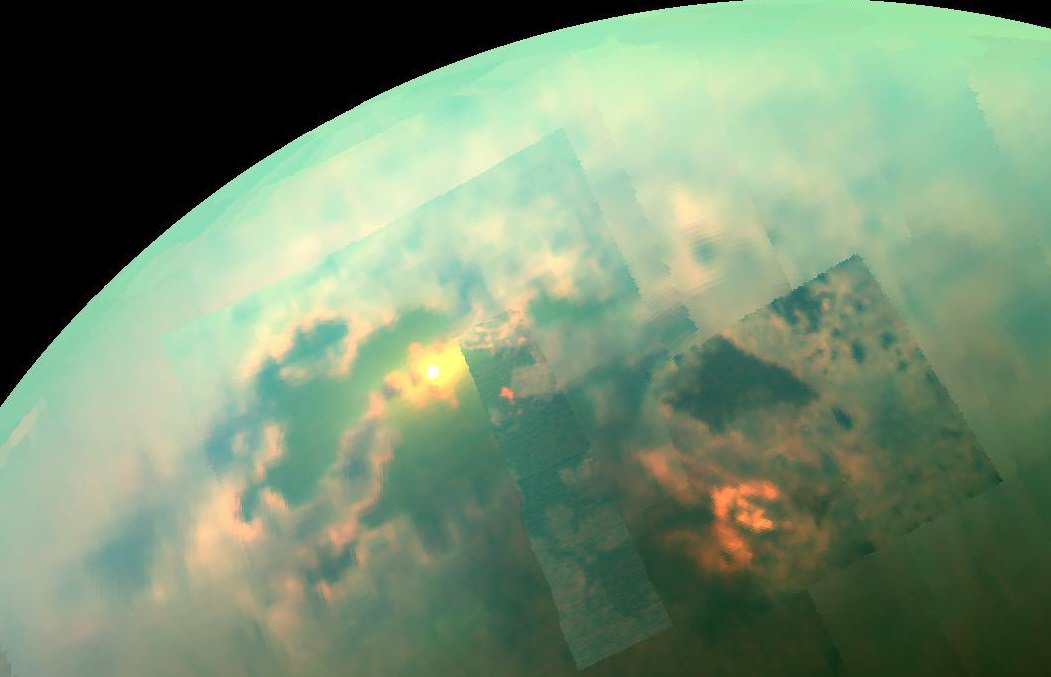
In this near-infrared mosaic, the sun shines off of the seas on Saturn's moon, Titan. Credit: NASA/JPL-Caltech/University of Arizona/University of Idaho
Titan is tough moon to study, thanks to its incredibly thick and hazy atmosphere. But when astronomers have ben able to sneak a peak beneath its methane clouds, they have spotted some very intriguing features. And some of these, interestingly enough, are reminiscent of geographical features here on Earth. For instance, Titan is the only other body in the Solar System that is known to have a cycle where liquid is exchanged between the surface and the atmosphere.
For example, previous images provided by NASA’s Cassini mission showed indications of steep-sided canyons in the northern polar region that appeared to be filled with liquid hydrocarbons, similar to river valleys here on Earth. And thanks to new data obtained through radar altimetry, these canyons have been shown to be hundreds of meters deep, and have confirmed rivers of liquid methane flowing through them.
This evidence was presented in a new study titled “Liquid-filled canyons on Titan” – which was published in August of 2016 in the journal Geophysical Research Letters. Using data obtained by the Cassini radar altimeter in May 2013, they observed channels in the feature known as Vid Flumina, a drainage network connected to Titan’s second largest hydrocarbon sea in the north, Ligeia Mare.
Saturn’s largest moon, Titan, has features that resemble Earth’s geology, with deep, steep-sided canyons. Credit: NASA/JPL/Cassini
Analysis of this information showed that the channels in this region are steep-sided and measure about 800 m (half a mile) wide and between 244 and 579 meters deep (800 – 1900 feet). The radar echoes also showed strong surface reflections that indicated that these channels are currently filled with liquid. The elevation of this liquid was also consistent with that of Ligeia Mare (within a maring of 0.7 m), which averages about 50 m (164 ft) deep.
This is consistent with the belief that these river channels in area drain into the Ligeia Mare, which is especially interesting since it parallels how deep-canyon river systems empty into lakes here on Earth. And it is yet another example of how the methane-based hydrological cycle on Titan drives the formation and evolution of the moon’s features, and in ways that are strikingly similar to the water cycle here on Earth.
Alex Hayes – an assistant professor of astronomy at Cornell, the Director of the Spacecraft Planetary Imaging Facility (SPIF) and one of the authors on the paper – has conducted seversal studies of Titan’s surface and atmosphere based on radar data provided by Cassini. As he was quoted as saying in a recent article by the Cornell Chronicler:
“Earth is warm and rocky, with rivers of water, while Titan is cold and icy, with rivers of methane. And yet it’s remarkable that we find such similar features on both worlds. The canyons found in Titan’s north are even more surprising, as we have no idea how they formed. Their narrow width and depth imply rapid erosion, as sea levels rise and fall in the nearby sea. This brings up a host of questions, such as where did all the eroded material go?”
Cassini image of the northern polar area of Titan and Vid Flumina drainage basin, showing Ligeia Mare (left) and the Vid Flumina drainage basin (right). Credit: R.L. Kirk/NASA/JPLA good question indeed, since it raises some interesting possibilities. Essentially, the features observed by Cassini are just part of Titan’s northern polar region, which is covered by large standing bodies of liquid methane – the largest of these being Kraken Mare, Ligeia Mare and Punga Mare. In this respect, the region is similar to glacially eroded fjords on Earth.
However, conditions on Titan do not allow for the presence of glaciers, which rules out the likelihood that retreating sheets of ice could have carved these canyons. So this naturally begs the question, what geological forces created this region? The team concluded that there were only two likely possibilities – which included changes in the elevation of the rivers, or tectonic activity in the area.
Ultimately, they favored a model where the variation in surface elevation of liquid drove the formation of the canyons – though they acknowledge that both tectonic forces and sea level variations played a role. As Valerio Poggiali, an associate member of the Cassini RADAR Science Team at the Sapienza University of Rome and the lead author of the paper, told Universe Today via email:
“What the canyons on Titan really mean is that in the past sea level was lower and so erosion and canyon formation could take place. Subsequently sea level has risen and backfilled the canyons. This presumably takes place over multiple cycles, eroding when sea level is lower, depositing some when it is higher until we get the canyons we see today. So, what it means is that sea level has likely changed in the geological past and the canyons are recording that change for us.”
Titan’s second largest methane lake, Ligeia Mare. Credit: NASA/JPL/USGS
In this respect, there are many more Earth examples to choose from, all of which are mentioned in the study:
“Examples include Lake Powell, a reservoir on the Colorado River that was created by the Glen Canyon Dam; the Georges River in New South Wales, Australia; and the Nile River gorge, which formed as the Mediterranean Sea dried up during the late Miocene. Rising liquid levels in the geologically recent past led to the flooding of these valleys, with morphologies similar to those observed at Vid Flumina.”
Understanding the processes that led to these formations is crucial to understanding the current state of Titan’s geomorphology. And this study is significant in that it is the first to conclude that the rivers in the Vid Flumina region were deep canyons. In the future, the research team hopes to examine other channels on Titan that were observed by Cassini to test their theories.
Once again, our exploration of the Solar System has shown us just how weird and wonderful it truly is. In addition to all its celestial bodies having their own particular quirks, they still have a lot in common with Earth. By the time the Cassini mission is complete (Sept. 15th, 2017), it will have surveyed 67% the surface of Titan with its RADAR imaging instrument. Who knows what other “Earth-like” features it will notice before then?
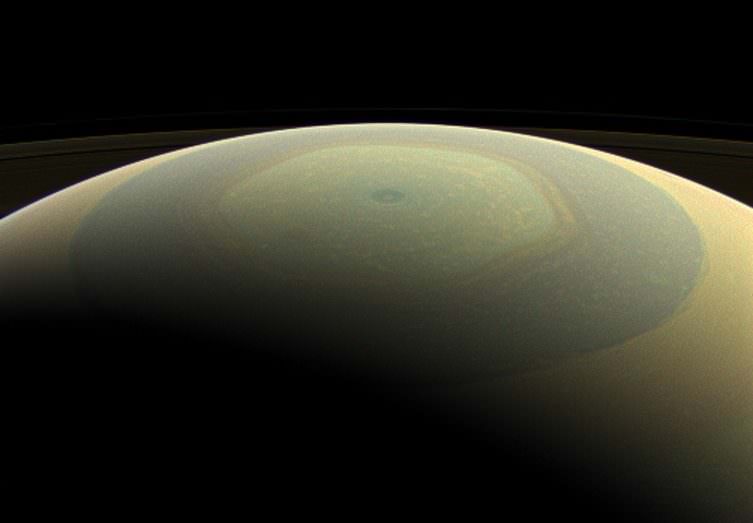
Saturn makes a beautifully striped ornament in this natural-color image, showing its north polar hexagon and central vortex (Credit: NASA/JPL-Caltech/Space Science Institute)
Ever since the Voyager 2 made its historic flyby of Saturn, astronomers have been aware of the persistent hexagonal storm around the gas giant’s north pole. This a six-sided jetstream has been a constant source of fascination, due to its sheer size and immense power. Measuring some 13,800 km (8,600 mi) across, this weather system is greater in size than planet Earth.
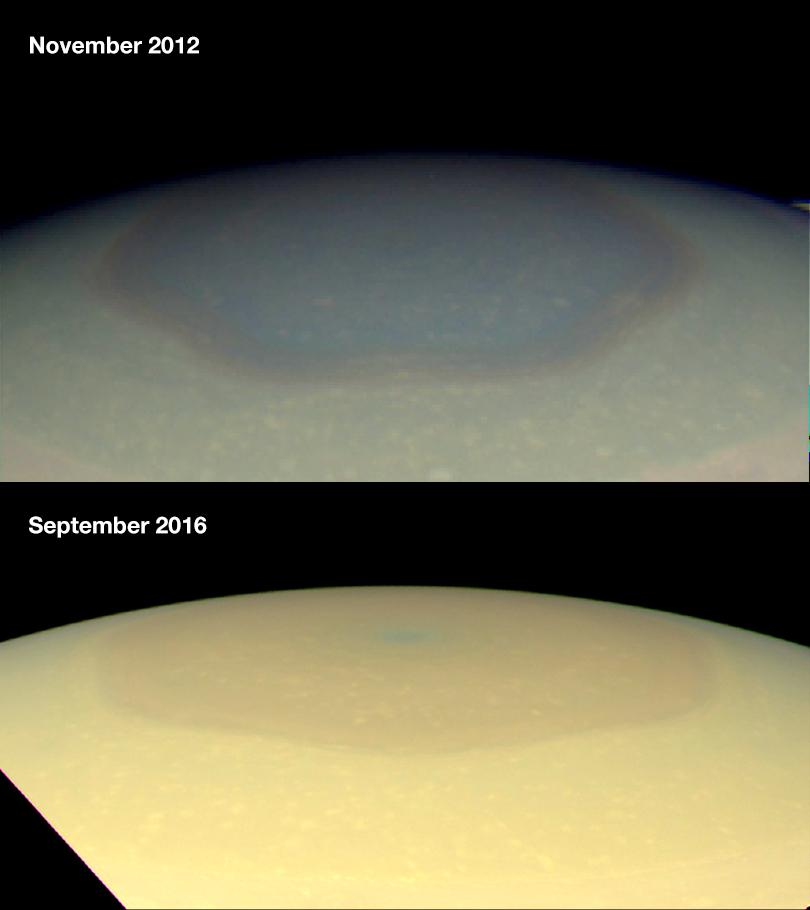
And thanks to the latest data to be provided by the Cassini space probe, which entered orbit around Saturn in 2009, it seems that this storm is even stranger than previously thought. Based on images snapped between 2012 and 2016, the storm appears to have undergone a change in color, from a bluish haze to a golden-brown hue.
The reasons for this change remain something of a mystery, but scientists theorize that it may be the result of seasonal changes due to the approaching summer solstice (which will take place in May of 2017). Specifically, they believe that the change is being driven by an increase in the production of photochemical hazes in the atmosphere, which is due to increased exposure to sunlight.
Natural color images taken by NASA’s Cassini wide-angle camera, showing the changing appearance of Saturn’s north polar region between 2012 and 2016.. Credit: NASA/JPL-Caltech/Space Science Institute/Hampton University
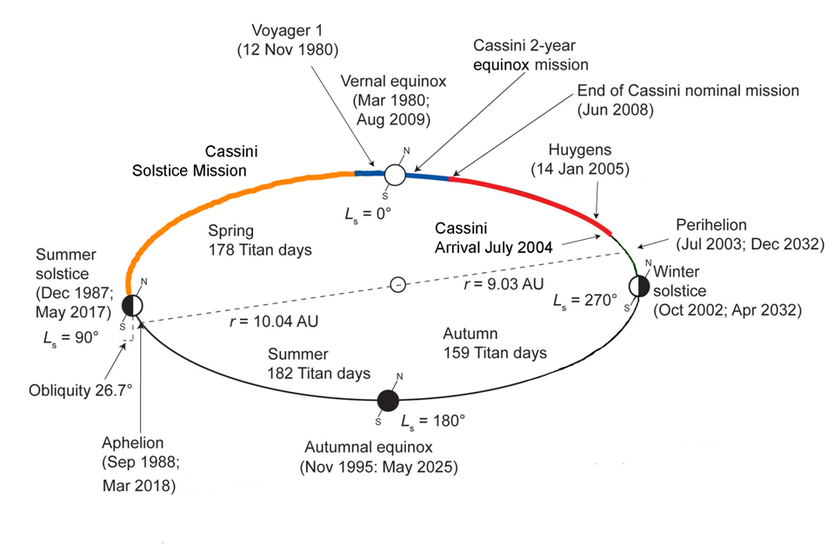
This reasoning is based in part on past observations of seasonal change on Saturn. Like Earth, Saturn experiences seasons because its axis is tilted relative to its orbital plane (26.73°). But since its orbital period is almost 30 years, these seasons last for seven years.
Between November 1995 and August 2009, the hexagonal storm also underwent some serious changes, which coincided with Saturn going from its Autumnal to its Spring Equinox. During this period, the north polar atmosphere became clear of aerosols produced by photochemical reactions, which was also attributed to the fact that the northern polar region was receiving less in the way of sunlight.
However, since that time, the polar atmosphere has been exposed to continuous sunlight, and this has coincided with aerosols being produced inside the hexagon, making the polar atmosphere appear hazy. As Linda J. Spilker, the Cassini mission’s project scientist, told Universe Today via email:
“We have seen dramatic changes in the color inside Saturn’s north polar hexagon in the last 4 years. That color change is probably the result of changing seasons at Saturn, as Saturn moves toward northern summer solstice in May 2017. As more sunlight shines on the hexagon, more haze particles are produced and this haze gives the hexagon a more golden color.”
Diagram showing he main events of Saturn’s year, and where in the Saturnian year the Voyager 1 and Cassini missions occurred. Credit: Ralph Lorenz
All of this has helped scientists to test theoretical models of Saturn’s atmosphere. In the past, it has been speculated that this six-sided storm acts as a barrier that prevents outside haze particles from entering. The previous differences in color – the planet’s atmosphere being golden while the polar storm was darker and bluish – certainly seemed to bear this out.
The fact that it is now changing color and starting to look more like the rest of the atmosphere could mean that the chemical composition of the polar region is now changing and becoming more like the rest of the planet. Other effects, which include changes in atmospheric circulation (which are in turn the result of seasonally shifting solar heating patterns) might also be influencing the winds in the polar regions.
Needless to say, the giant planets of the Solar System have always been a source of fascination for scientists and astronomers. And if these latest images are any indication, it is that we still have much to learn about the dynamics of their atmospheres.
“It is very exciting to see this transformation in Saturn’s hexagon color with changing seasons,” said Spilker. “With Saturn seasons over 7 years long, these new results show us that it is certainly worth the wait.”
The seasons on Saturn, visualized with images taken by the Hubble Heritage Team. Credit: R. G. French (Wellesley College) et al./NASA/ESA/Hubble Heritage Team (STScI/AURA)
It also shows that Cassini, which has been in operation since 1997, is still able to provide new insights into Saturn and its system of moons. In recent weeks, this included information about seasonal variations on Titan, Saturn’s largest moon. By April 22nd, 2017, the probe will commence its final 22 orbits of Saturn. Barring any mission extensions, it is scheduled enter into Saturn’s atmosphere (thus ending its mission) on Sept. 15th, 2017.
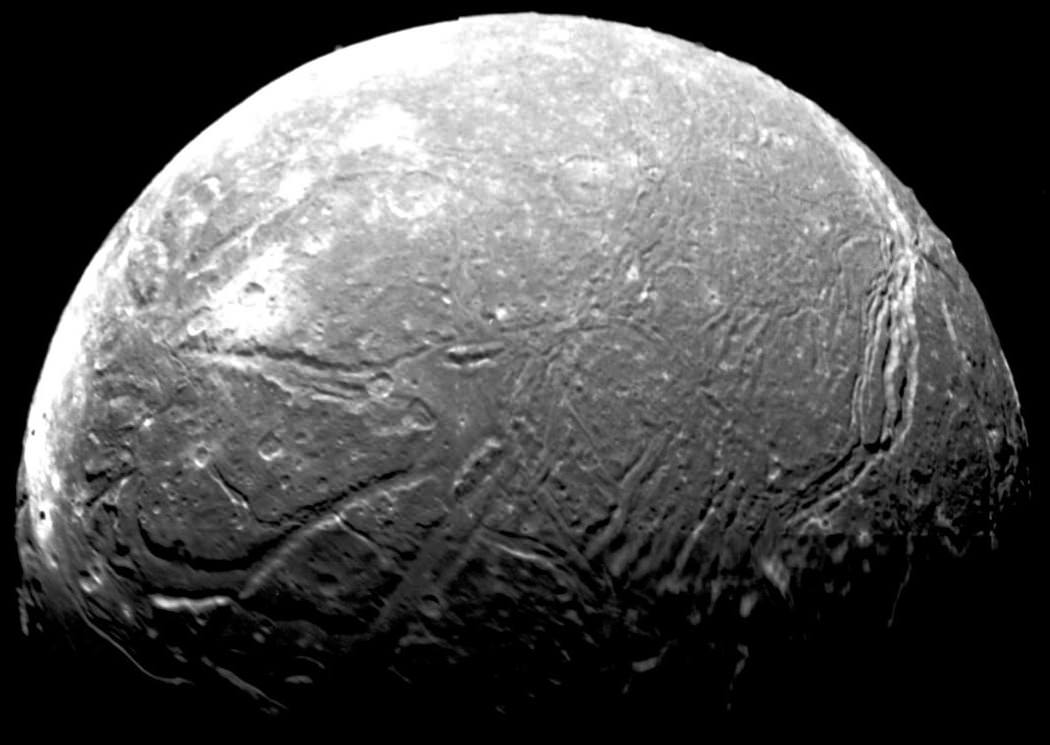
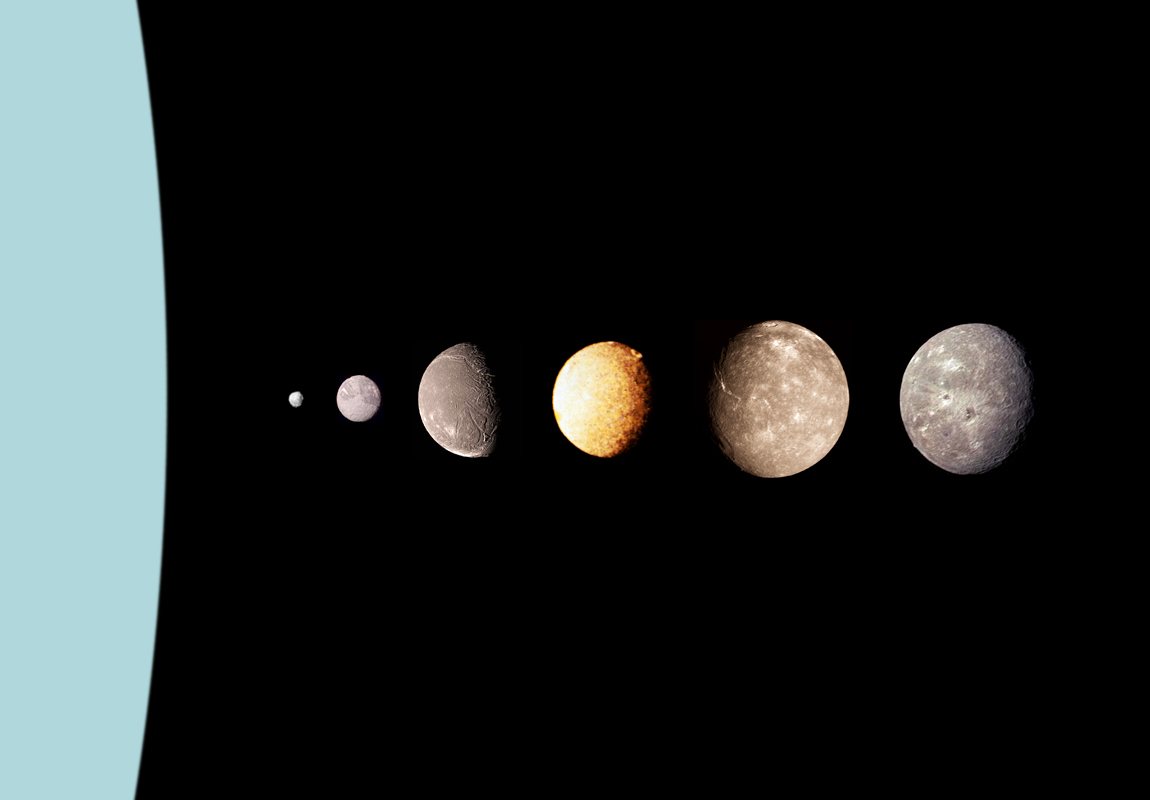
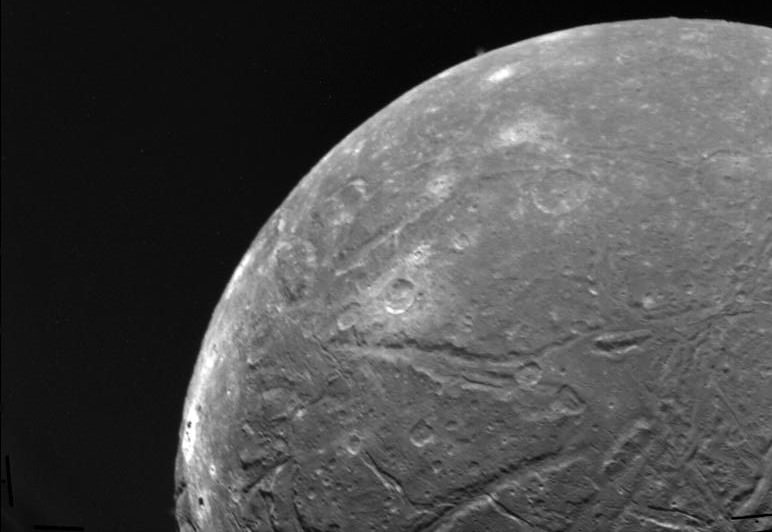
Mosaic of the four highest-resolution images of Ariel taken by the Voyager 2 space probe during its 1986 flyby of Uranus. Credit: NASA/JPL
The outer Solar System has enough mysteries and potential discoveries to keep scientists busy for decades. Case in point, Uranus and it’s system of moons. Since the beginning of the Space Age, only one space probe has ever passed by this planet and its system of moons. And yet, that which has been gleaned from this one mission, and over a century and a half of Earth- (and space-) based observation, has been enough to pique the interest of many generations of scientists.
For instance, just about all detailed knowledge of Uranus’ 27 known moons – including the “sprightly” moon Ariel – has been derived from information obtained by the Voyager 2 probe. Nevertheless, this single flyby revealed that Ariel is composed of equal parts ice and rock, a cratered and geologically active surface, and a seasonal cycle that is both extreme and very unusual (at least by our standards!)
Discovery and Naming:
Ariel was discovered on October 24th, 1851, by English astronomer William Lassel, who also discovered the larger moon of Umbriel on the same day. While William Herschel, who discovered Uranus’ two largest moons of Oberon and Titania in 1787, claimed to have observed four other moons in Uranus’ orbit, those claims have since been concluded to be erroneous.
A montage of Uranus’s major moons. Image credit: NASA
As with all of Uranus’ moons, Ariel was named after a character from Alexander Pope’s The Rape of the Lock and Shakespeare’s The Tempest. In this case, Ariel refers to a spirit of the air who initiates the great storm in The Tempest and a sylph who protects the female protagonist in The Rape of the Lock. The names of all four then-known satellites of Uranus were suggested by John Herschel in 1852 at the request of Lassell.
Size, Mass and Orbit:
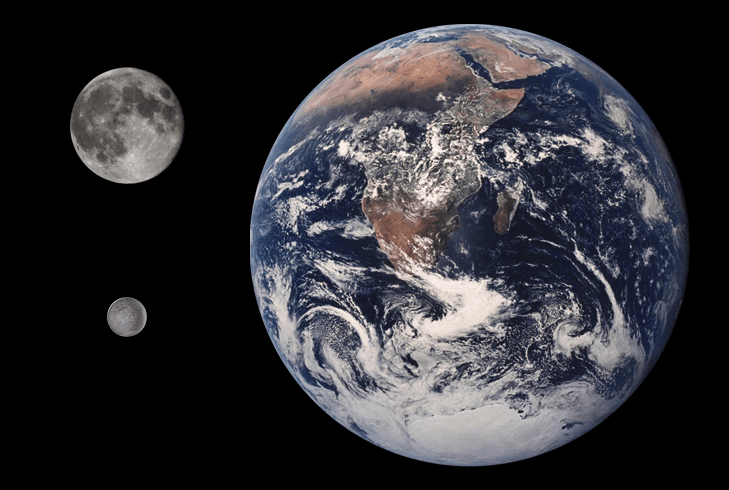
With a mean radius of 578.9 ± 0.6 km and a mass of 1.353 ± 0.120 × 10²¹ kg, Ariel is equivalent in size to 0.0908 Earths and 0.000226 times as massive. Ariel’s orbit of Uranus is almost circular, with an average distance (semi-major axis) of 191,020 km – making it the second closest of Uranus’ five major moons (behind Miranda). It has a very small orbital eccentricity (0.0012) and is inclined very little relative to Uranus’ equator (0.260°).
With an average orbital velocity of 5.51 km/s, Ariel takes 2.52 days to complete a single orbit of Uranus. Like most moons in the outer Solar System, Ariel’s rotation is synchronous with its orbit. This means that the moon is tidally locked with Uranus, with one face constantly pointed towards the planet.
Ariel orbits and rotates within Uranus’ equatorial plane, which means it rotates perpendicular to the Sun. This means that its northern and southern hemispheres face either directly towards the Sun or away from it at the solstices, which results in an extreme seasonal cycle of permanent day or night for a period of 42 years.
Size comparison between Earth, the Moon, and Ariel. Credit: NASA/JPL/USGS/Tom Reding
Ariel’s orbit lies completely inside the Uranian magnetosphere, which means that its trailing hemisphere is regularly struck by magnetospheric plasma co-rotating with the planet. This bombardment is believed to be the cause of the darkening of the trailing hemispheres (see below), which has been observed for all Uranian moons (with the exception of Oberon).
Currently Ariel is not involved in any orbital resonance with other Uranian satellites. In the past, however, it may have been in a 5:3 resonance with Miranda, which could have been partially responsible for the heating of that moon, and 4:1 resonance with Titania, from which it later escaped.
Composition and Surface Features:
Ariel is the fourth largest of Uranus’ moons, but is believed to be the third most-massive. Its average density of 1.66 g/cm3indicates that it is roughly composed of equal parts water ice and rock/carbonaceous material, including heavy organic compounds. Based on spectrographic analysis of the surface, the leading hemisphere of Ariel has been revealed to be richer in water ice than its trailing hemisphere.
The cause of this is currently unknown, but it may be related to bombardment by charged particles from Uranus’s magnetosphere, which is stronger on the trailing hemisphere. The interaction of energetic particles and water ice causes sublimation and the decomposition of methane trapped in the ice (as clathrate hydrate), darkening the methanogenic and other organic molecules and leaving behind a dark, carbon-rich residue (aka. tholins).
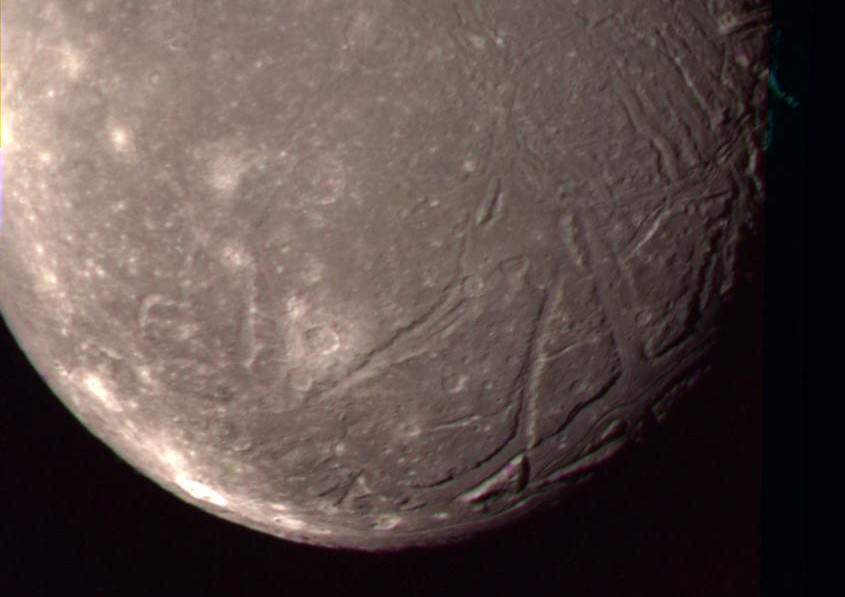
The highest-resolution Voyager 2 color image of Ariel, showing canyons with floors covered by smooth plains (lower right) and the bright Laica crater (lower left). Credit: NASA/JPL
Based on its size, estimates of its ice/rock distribution, and the possibility of salt or ammonia in its interior, Ariel’s interior is thought to be differentiated between a rocky core and an icy mantle. If true, the radius of the core would account for 64% of the moon’s radius (372 km) and 52% of its mass. And while the presence of water ice and ammonia could mean Ariel harbors an interior ocean at it’s core-mantle boundary, the existence of such an ocean is considered unlikely.
Infrared spectroscopy has also identified concentrations of carbon dioxide (CO²) on Ariel’s surface, particularly on its trailing hemisphere. In fact, Ariel shows the highest concentrations of CO² on of any Uranian satellite, and was the first moon to have this compound discovered on its surface.
Though the precise reason for this is unknown, it is possible that it is produced from carbonates or organic material that have been exposed to Uranus’ magnetosphere or solar ultraviolet radiation – due to the asymmetry between the leading and trailing hemispheres. Another explanation is outgassing, where primordial CO² trapped in Ariel’s interior ice escaped thanks to past geological activity.
The observed surface of Ariel can be divided into three terrain types: cratered terrain, ridged terrain and plains. Other features include chasmata (canyons), fault scarps (cliffs), dorsa (ridges) and graben (troughs or trenches). Impact craters are the most common feature on Ariel, particularly in the south pole, which is the moon’s oldest and most geographically extensive region.
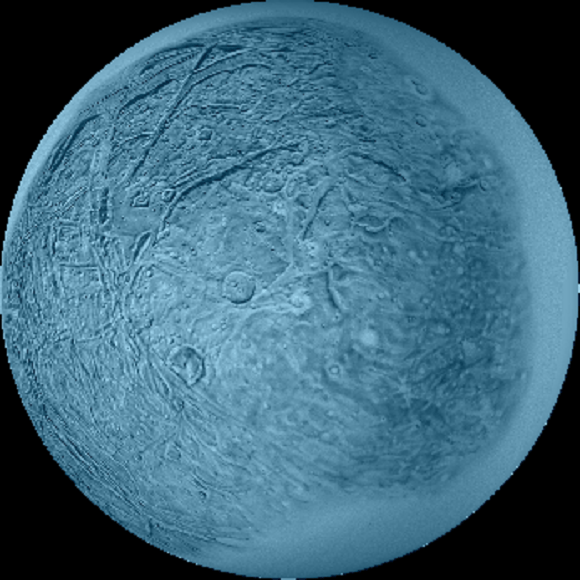
False-color map of Ariel, showing the prominent Yangoor crater (left of center) and patches of ridged terrain (far left). Credit: USGS
Compared to the other moons of Uranus, Ariel appears to be fairly evenly-cratered. The surface density of the craters, which is significantly lower than those of Oberon and Umbriel, suggest that they do not date to the early history of the Solar System. This means that Ariel must have been completely resurfaced at some point in its history, most likely in the past when the planet had a more eccentric orbit and was therefore more geologically active.
The largest crater observed on Ariel, Yangoor, is only 78 km across, and shows signs of subsequent deformation. All large craters on Ariel have flat floors and central peaks, and few are surrounded by bright ejecta deposits. Many craters are polygonal, indicating that their appearance was influenced by the crust’s preexisting structure. In the cratered plains there are a few large (about 100 km in diameter) light patches that may be degraded impact craters.
The cratered terrain is intersected by a network of scarps, canyons and narrow ridges, most of which occur in Ariel’s mid-southern latitudes. Known as chasmata, these canyons were probably graben that formed due to extensional faulting triggered by global tension stresses – which in turn are believed to have been caused by water and/or liquid ammonia freezing in the interior.
These chasmata are typically 15–50 km wide and are mainly oriented in an east- or northeasterly direction. The widest graben have grooves running along the crests of their convex floors (known as valles). The longest canyon is Kachina Chasma, which is over 620 km long.
Image of Ariel, taken on Jan. 24, 1986, from a distance of 130,000 km (80,000 mi) showing the complexity of Ariel’s surface. Credit: NASA/JPL
The ridged terrain on Ariel, which is the second most-common type, consists of bands of ridges and troughs hundreds of kilometers long. These ridges are found bordering cratered terrain and cutting it into polygons. Within each band (25-70 km wide) individual ridges and troughs have been observed that are up to 200 km long and 10-35 km apart. Here too, these features are believed to be a modified form of graben or the result of geological stresses.
The youngest type of terrain observed on Ariel are its plains, which consists of relatively low-lying smooth areas. Due to the varying levels of cratering found in these areas, the plains are believed to have formed over a long period of time. They are found on the floors of canyons and in a few irregular depressions in the middle of the cratered terrain.
The most likely origin for the plains is through cryovolcanism, since their geometry resembles that of shield volcanoes on Earth, and their topographic margins suggests the eruption of viscous liquid – possibly liquid ammonia. The canyons must therefore have formed at a time when endogenic resurfacing was still taking place on Ariel.
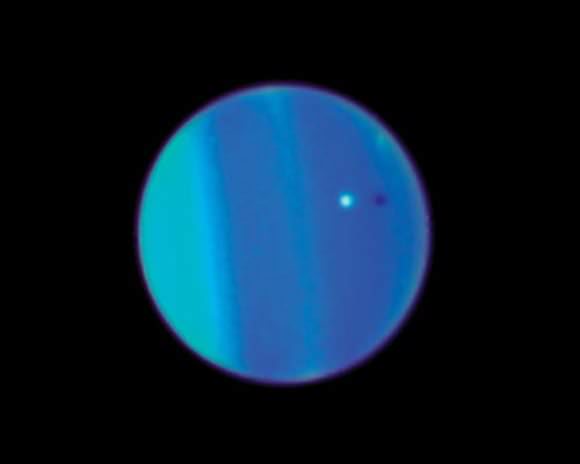
Ariel’s transit of Uranus, which was captured by the Hubble Space Telescope on July 26th, 2008. Credit: NASA, ESA, L. Sromovsky (University of Wisconsin, Madison), H. Hammel (Space Science Institute), and K. Rages (SETI)
Ariel is the most reflective of Uranus’s moons, with a Bond albedo of about 23%. The surface of Ariel is generally neutral in color, but there appears to be an asymmetry where the trailing hemisphere is slightly redder. The cause of this, is believed to be interaction between Ariel’s trailing hemisphere and radiation from Uranus’ magnetosphere and Solar ultraviolet radiation, which converts organic compounds in the ice into tholins.
Like all of Uranus’ major moons, Ariel is thought to have formed in the Uranunian accretion disc; which existed around Uranus for some time after its formation, or resulted from a large impact suffered by Uranus early in its history.
Exploration:
Due to its proximity to Uranus’ glare, Ariel is difficult to view by amateur astronomers. However, since the 19th century, Ariel has been observed many times by ground-based on space-based instruments. For example, on July 26th, 2006, the Hubble Space Telescope captured a rare transit made by Ariel of Uranus, which cast a shadow that could be seen on the Uranian cloud tops. Another transit, in 2008, was recorded by the European Southern Observatory.
It was not until the 1980s that images were obtained by the first and only orbiter to ever pass through the Uranus’ system. This was the Voyager 2 space probe, which photographed the moon during its January 1986 flyby. The probe’s closest approach was at a distance of 127,000 km (79,000 mi) – significantly less than the distances to all other Uranian moons except Miranda.
Artist’s impression of the Voyager 2 space probe. Credit: NASA
The images acquired covered only about 40% of the surface, but only 35% was captured with the quality required for geological mapping and crater counting. This was partly due to the fact that the flyby coincided with the southern summer solstice, where the southern hemisphere was pointed towards the Sun and the northern hemisphere was completely concealed by darkness.
No missions have taken place to study Uranus’ system of moons since and none are currently planned. However, the possibility of sending the Cassini spacecraft to Uranus was evaluated during its mission extension planning phase in April of 2008. It was determined that it would take about twenty years for Cassini to get to the Uranian system after departing Saturn. However, this proposal and the ultimate fate of the mission remain undecided at this time.
All in all, Uranus’ moon Ariel is in good company. Like it’s fellow Uranians, its axial tilt is almost the exact same as Uranus’, it is composed of almost equal parts ice and rock, it is geologically active, and its orbit leads to an extreme seasonal cycle. However, Ariel stands alone when its to its brightness and its youthful surface. Unfortunately, this bright and youthful appearance has not made it an easier to observe.
Alas, as with all Uranian moons, exploration of this moon is still in its infancy and there is much we do not know about it. One can only hope another deep-space mission, like a modified Cassini flyby, takes place in the coming years and finishes the job started by Voyager 2!
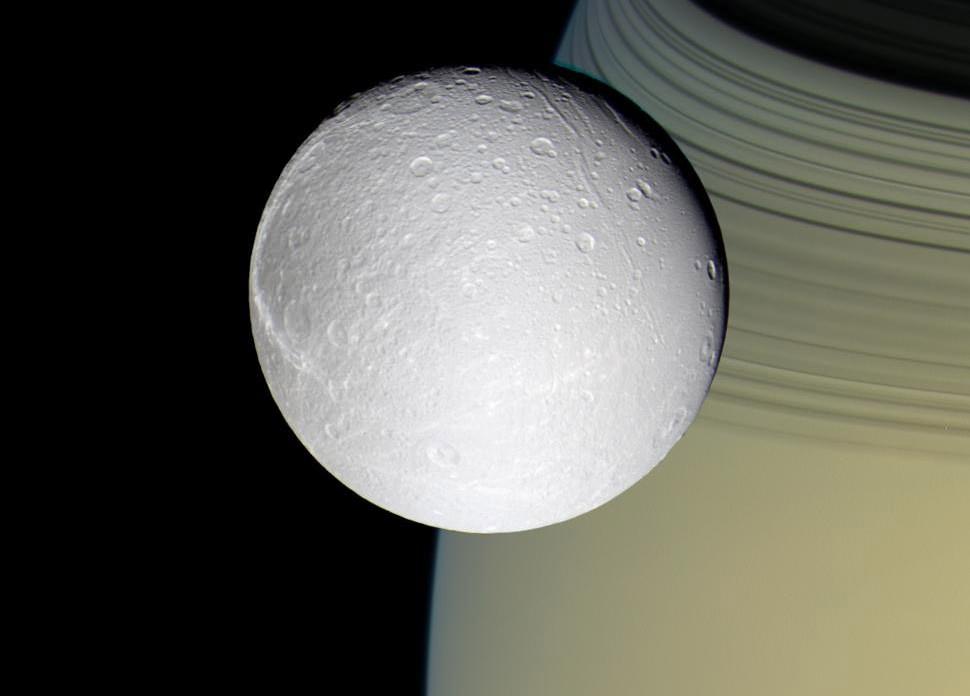
Saturn's moon Dione, with Saturn's rings visible in the background. Credit: NASA/JPL
Thanks to the Cassini mission, a great deal has been learned about Saturn’s system of moons (aka. the Cronian system) in the past decade. Thanks to the presence of an orbiter in the system, astronomers and space exploration enthusiasts have been treated to a seemingly endless stream of images and data, which in turn has enabled us to learn many interesting things about these moons’ appearances, surface features, composition, and history of formation.
This is certainly true of Saturn’s bright moon of Dione. In addition to being the 15th largest moon in the Solar System, and more massive than all known moons smaller than itself combined, it has much in common with other Cronian satellites – like Tethys, Iapetus and Rhea. This includes being mainly composed of ice, having a synchronous rotation with Saturn, and an unusual coloration between its leading and trailing hemispheres.
Discovery and Naming:
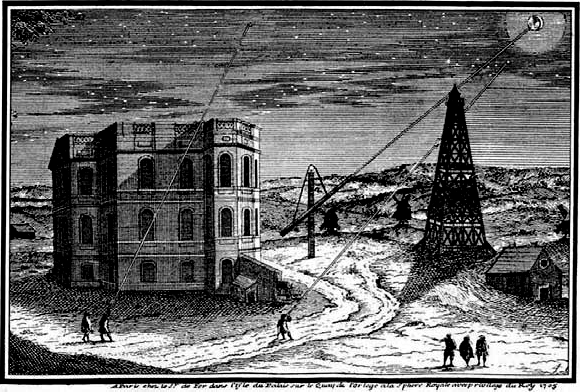
Dione was first observed by Italian astronomer Giovanni Domenico Cassini on in 1684 using a large aerial telescope he set up on the grounds of the Paris Observatory. Along with the moons of Iapetus, Rhea and Tethys – which he had discovered in 1671, 1672 and 1684, respectively – he named these moons Sidera Lodoicea (“Stars of Louis”, after his patron, King Louis XIV of France).
These names, however, did not catch on outside of France. By the end of the 17th century, astronomers instead fell into the habit of naming Saturn’s then-known moons as Titan and Saturn I through V, in order of their observed distance from the planet. Being the second most-distant (behind Tethys) Dione came to be known as Saturn II for over a century.
An engraving of the Paris Observatory during Cassini’s time. Credit: Public Domain
The modern names were suggested in 1847 by John Herschel (the son of famed astronomer William Herschel), who suggested all the moons of Saturn be named after Titans – the sons and daughters of Cronos in the Greek mythology (the equivalent of the Roman Saturn).
In his 1847 publication, Results of Astronomical Observations made at the Cape of Good Hope, he suggested the name Dione, an ancient oracular Titaness who was the wife of Zeus and the mother of Aphrodite. Dione is featured in Homer’s The Iliad, and geological features – such as craters and cliffs – take their names from people and places in Virgil’s Aeneid.
Size, Mass and Orbit:
With a mean radius of 561.4 ± 0.4 km and a mass of about 1.0954 × 10²¹ kg, Dione is equivalent in size to 0.088 Earths and 0.000328 times as massive. It orbits Saturn at an average distance (semi-major axis) of 377,396 km, with a minor eccentricity of 0.0022 – ranging from 376,566 km at periapsis and 378,226 km at apoapsis.
Dione’s semi-major axis is about 2% less than that of the Moon. However, reflecting Saturn’s greater mass, Dione’s orbital period is one tenth that of the Moon (2.736915 days compared to 28). Dione is currently in a 1:2 mean-motion orbital resonance with Saturn’s moon Enceladus, completing one orbit of Saturn for every two orbits completed by Enceladus.
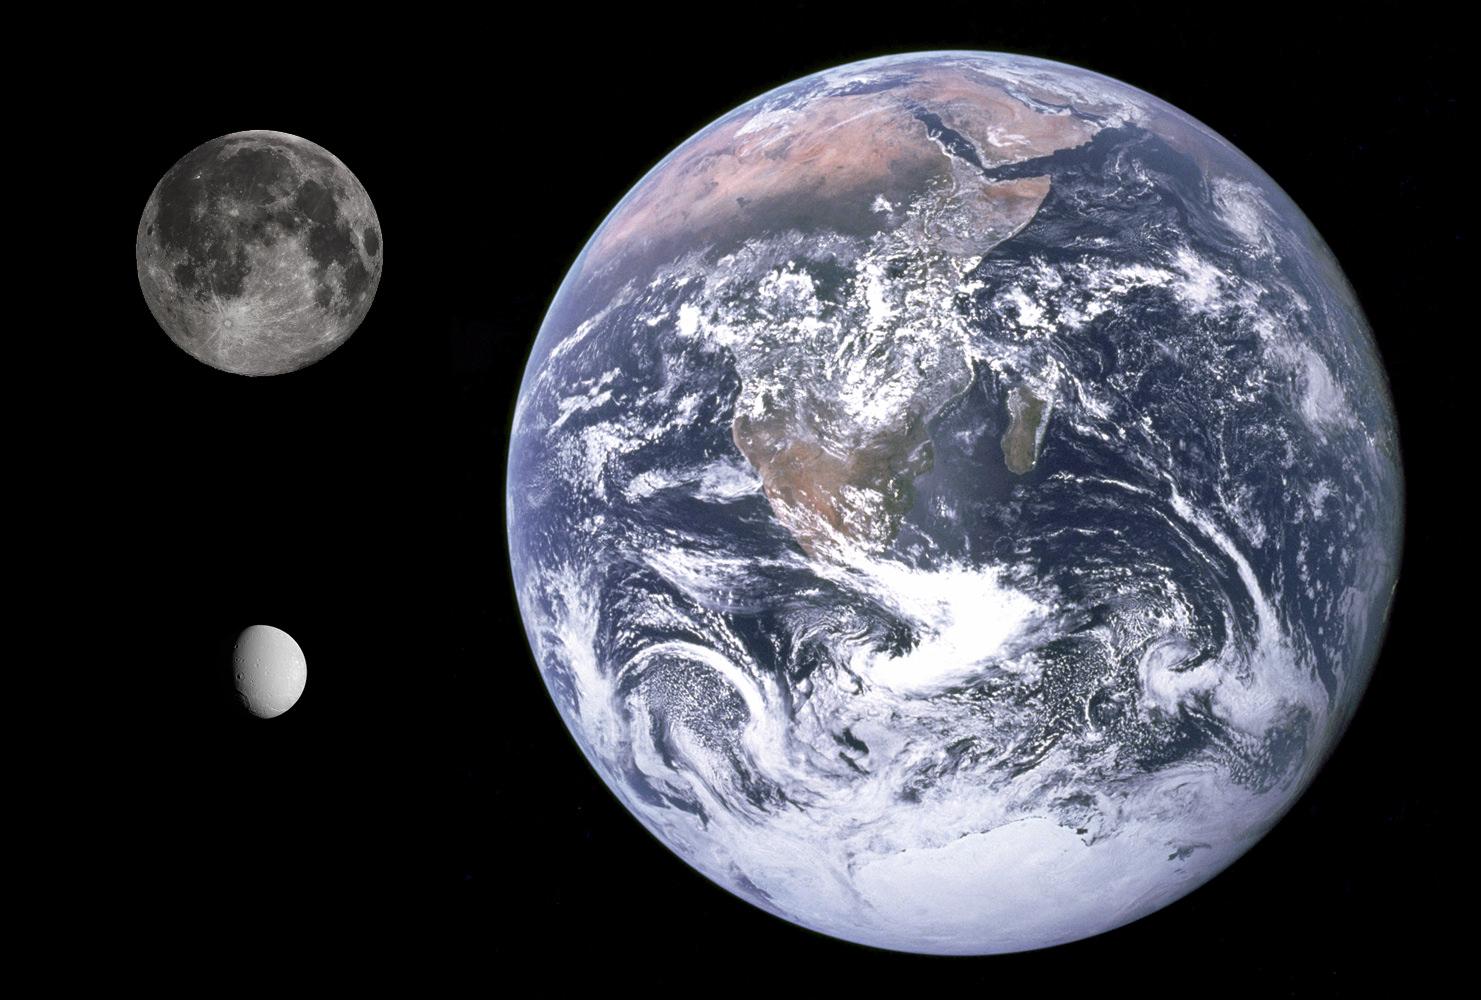
Size comparison between Earth, the Moon, and Saturn’s moon Dione. Credit: NASA/JPL/Space Science Institute
This resonance maintains Enceladus’s orbital eccentricity (0.0047) and provides tidal flexing that powers Enceladus’ extensive geological activity (which in turn powers its cryovolcanic jets). Dione has two co-orbital (aka. trojan) moons: Helene and Polydeuces. They are located within Dione’s Lagrangian points, 60 degrees ahead of and behind it, respectively.
Composition and Surface Features:
With a mean density of 1.478 ± 0.003 g/cm³, Dione is composed mainly of water, with a small remainder likely consisting of a silicate rock core. Though somewhat smaller and denser than Rhea, Dione is otherwise very similar in terms of its varied terrain, albedo features, and the different between its leading and trailing hemisphere.
Overall, scientists recognize five classes of geological features on Dione – Chasmata (chasms), dorsa (ridges), fossae (long, narrow depressions), craters, and catenae (crater chains). Craters are the most common feature, as with many Cronian moons, and can be distinguished in terms of heavily cratered terrain, moderately cratered plains, and lightly cratered plains.
The heavily cratered terrain has numerous craters greater than 100 km (62 mi) in diameter, whereas the plains areas tend to have craters less than 30 km (19 mi) in diameter (with some areas being more heavily cratered than others).
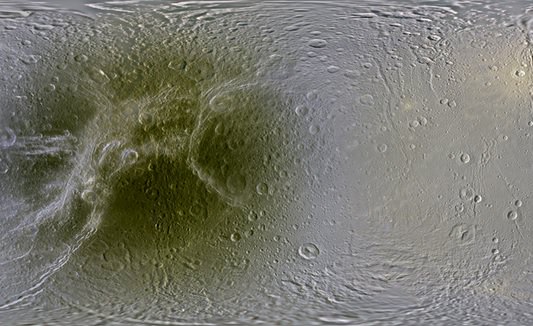
Global map of Dione, showing dark red in the trailing hemisphere (left), which is due to radiation and charged particles from Saturn’s. Credit: NASA/JPL/Space Science Institute
Much of the heavily cratered terrain is located on the trailing hemisphere, with the less cratered plains areas present on the leading hemisphere. This is the opposite of what many scientists expected, and suggests that during the period of Heavy Bombardment, Dione was tidally locked to Saturn in the opposite orientation.
Because Dione is relatively small, it is theorized that an impact large enough to cause a 35 km crater would have been sufficient to spin the satellite in the opposite direction. Because there are many craters larger than 35 km (22 mi), Dione could have been repeatedly spun during its early history. The pattern of cratering since then and the leading hemisphere’s bright albedo suggests that Dione has remained in its current orientation for several billion years.
Dione is also known for its differently colored leading and trailing hemispheres, which are similar to Tethys and Rhea. Whereas its leading hemisphere is bright, its trailing hemisphere is darker and redder in appearance. This is due to the leading hemisphere picking up material from Saturn’s E-Ring, which is fed by Enceladus’ cryovolcanic emissions.
Meanwhile, the trailing hemisphere interacts with radiation from Saturn’s magnetosphere, which causes organic elements contained within its surface ice to become dark and redder in appearance.
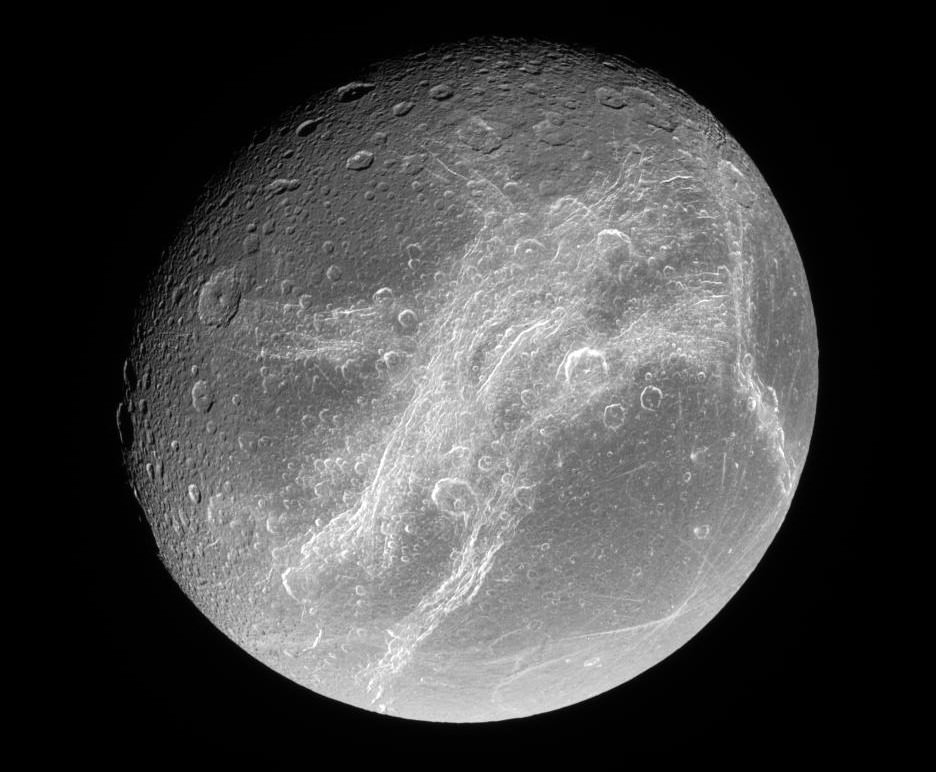
Dione’s trailing hemisphere, pictured by the Cassini orbiter, which shows its patches of “wispy terrain”. Credit: NASA/JPL
Another prominent feature is Dione’s “wispy terrain“, which covers its trailing hemisphere and is composed entirely of high albedo material that is also thin enough as to not obscure the surface features beneath. The origin of these features are unknown, but an earlier hypothesis suggested that that Dione was geologically active shortly after its formation, a process which has since ceased.
During this time of geological activity, endogenic resurfacing could have pushed material from the interior to the surface, with streaks forming from eruptions along cracks that fell back to the surface as snow or ash. Later, after the internal activity and resurfacing ceased, cratering continued primarily on the leading hemisphere and wiped out the streak patterns there.
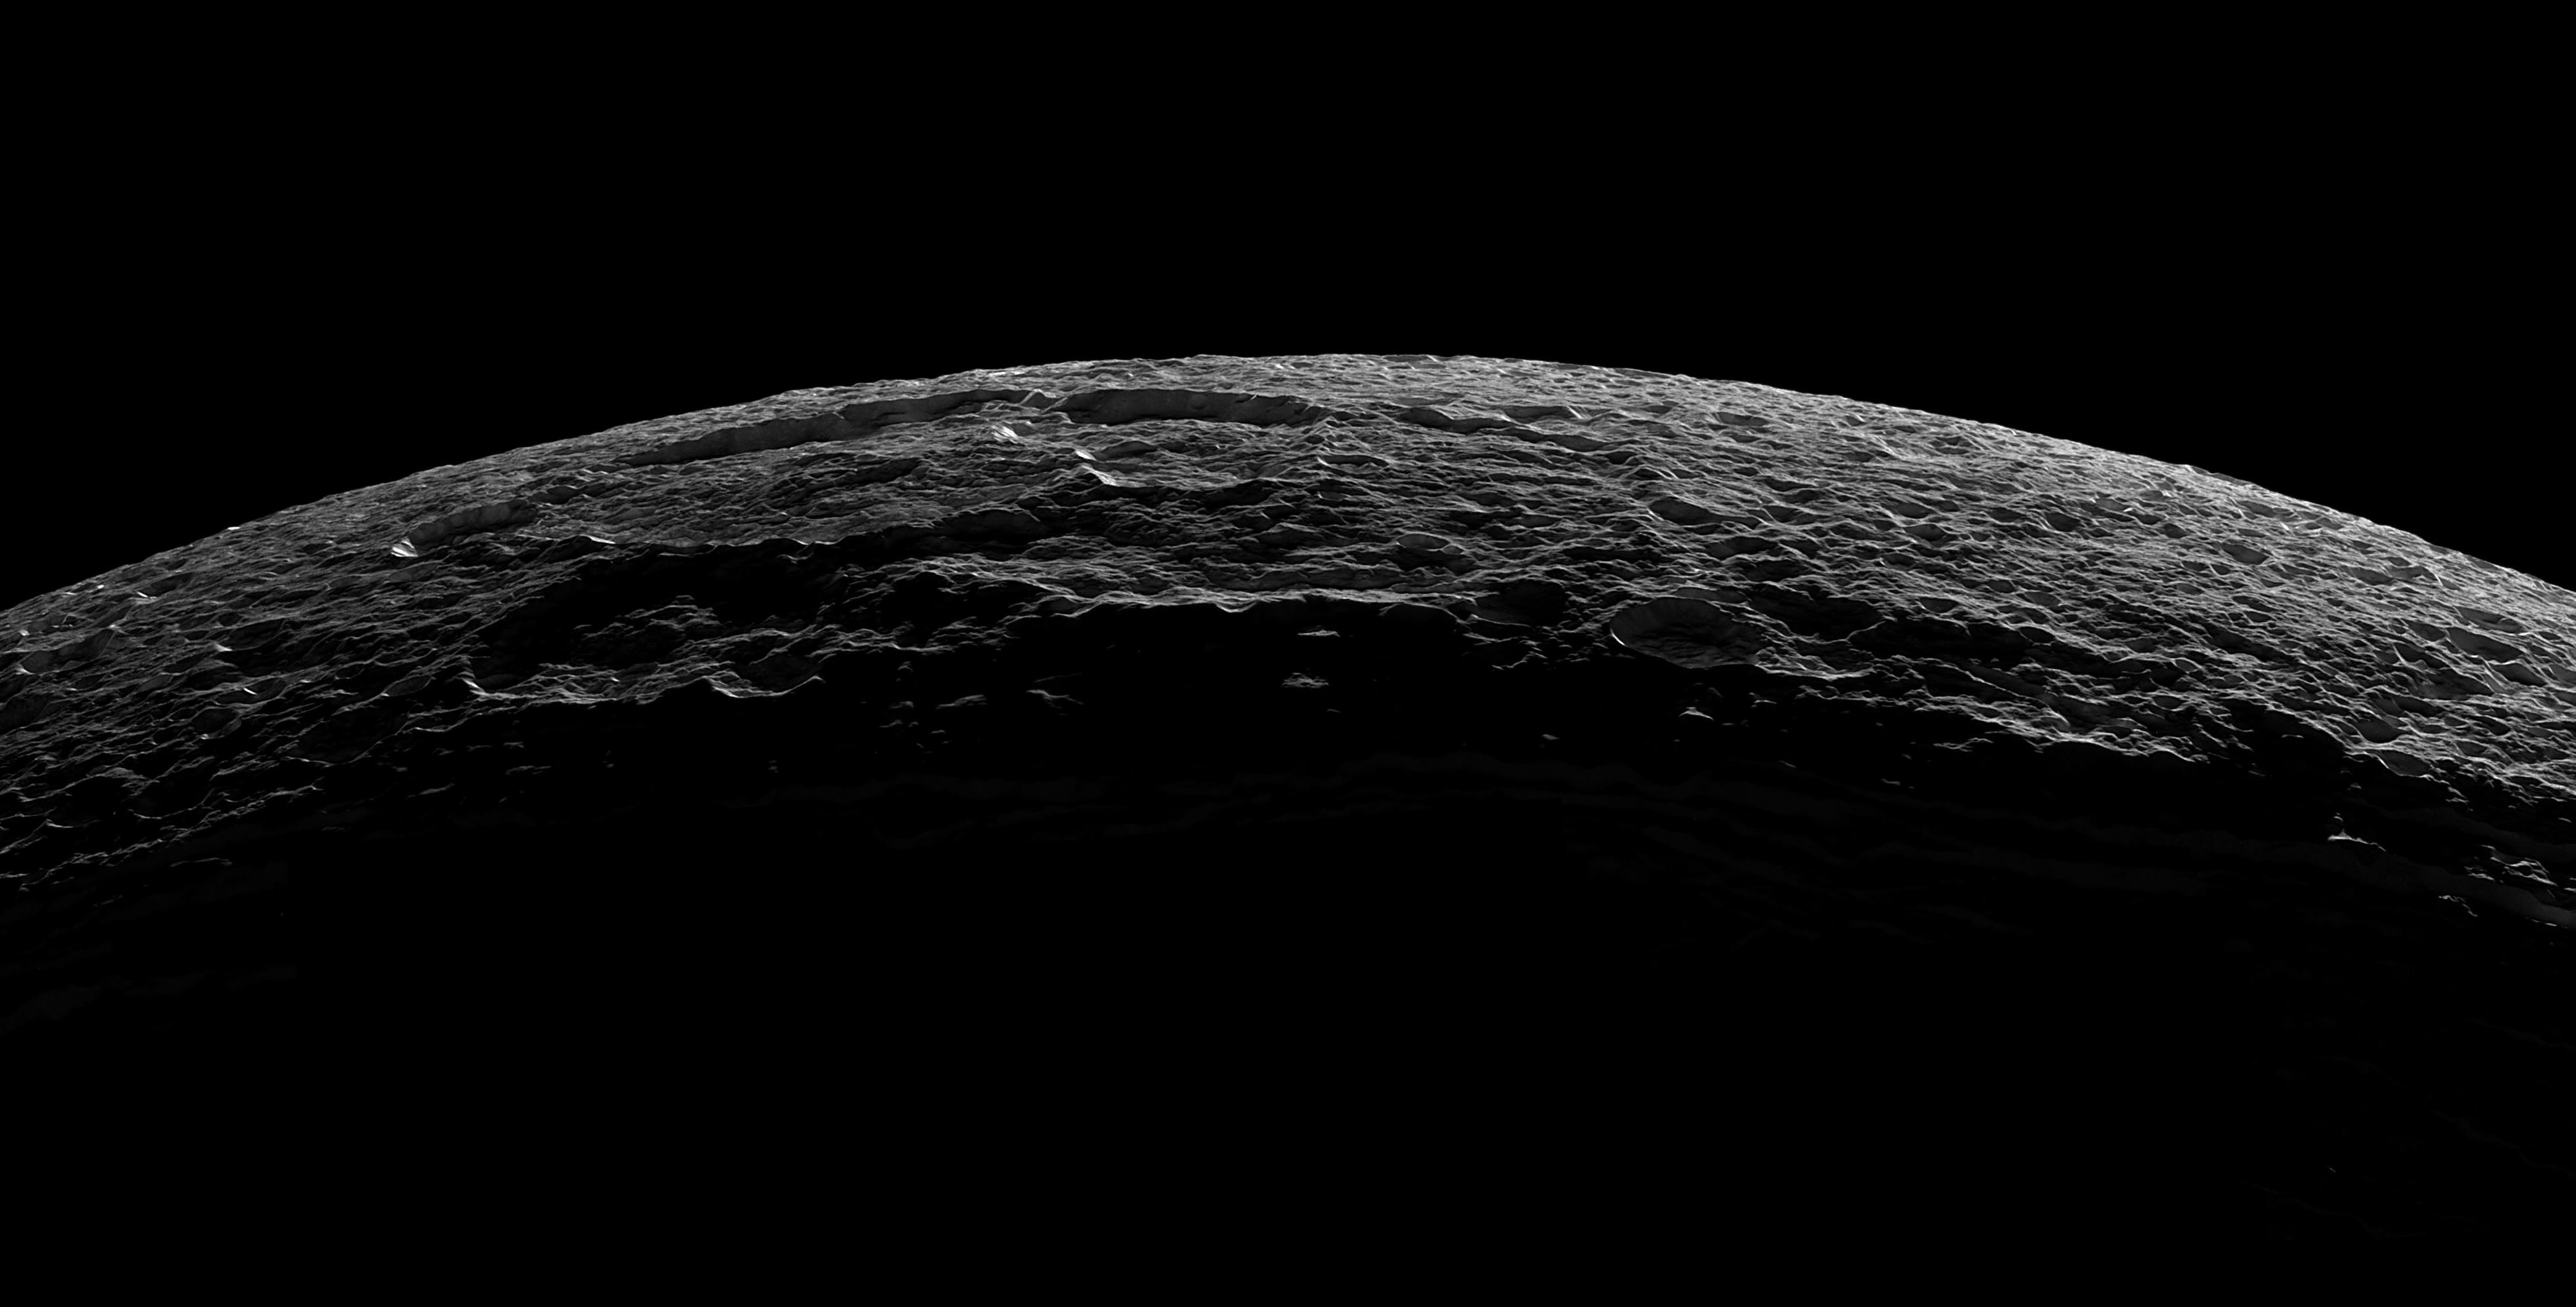
This hypothesis was proven wrong by the Cassini probe flyby of December 13th, 2004, which produced close-up images. These revealed that the ‘wisps’ were, in fact, not ice deposits at all, but rather bright ice cliffs created by tectonic fractures (chasmata). During this flyby, Cassini also captured oblique images of the cliffs which showed that some of them are several hundred meters high.
Atmosphere:
Dione also has a very thin atmosphere of oxygen ions (O+²), which was first detected by the Cassini space probe in 2010. This atmosphere is so thin that scientists prefer to call it an exosphere rather than a tenuous atmosphere. The density of molecular oxygen ions determined from the Cassini plasma spectrometer data ranges from 0.01 to 0.09 per cm3 .
Dione viewed by Cassini on October 11th, 2005, showing the Alcander crater (top) and the larger Prytanis crater to its left. Credit: NASA/JPL/SSI
Unfortunately, the prevalence of water molecules in the background (from Saturn’s E-Ring) obscured detection of water ice on the surface, so the source of oxygen remains unknown. However, photolysis is a possible cause (similar to what happens on Europa), where charged particles from Saturn’s radiation belt interact with water ice on the surface to create hydrogen and oxygen, the hydrogen being lost to space and the oxygen retained.
Exploration:
Dione was first imaged by the Voyager 1 and 2 space probes as they passed by Saturn on their way to the Outer Solar System in 1980 and 1981, respectively. Since that time, the only probe to conduct a flyby or close-up imaging of Dione has been the Cassini orbiter, which conducted five flybys of the moon between 2005 and 2015.
The first close flyby took place on October 11th, 2005, at a distance of 500 km (310 mi), followed by another on April 7th, 2010, (again at a distance of 500 km). A third flyby was performed on December 12th, 2011, and was the closest, at an distance of 99 km (62 mi). The fourth and fifth flybys took place on June 16th and August 17th, 2015, at a distance of 516 km (321 mi) and 474 km (295 mi), respectively.
In addition to obtaining images of Cassini’s cratered and differently-colored surface, the Cassini mission was also responsible for detecting the moon’s tenuous atmosphere (exosphere). Beyond that, Cassini also provided scientists with new evidence that Dione could be more geologically active than previously predicted.
Based on models constructed by NASA scientists, it is now believed that Dione’s core experiences tidal heating, which increases the closer it gets to Saturn. Because of this, scientists also believe that Dione may also have a liquid water ocean at its core-mantle boundary, thus joining moons like Enceladus, Europa and others in being potential environments where extra-terrestrial life could exist.
This, as well as Dione’s geological history and the nature of its surface (which could be what gives rise to its atmosphere) make Dione a suitable target for future research. Though no missions to study the moon are currently being planned, any mission to the Saturn system in the coming years would likely include a flyby or two!


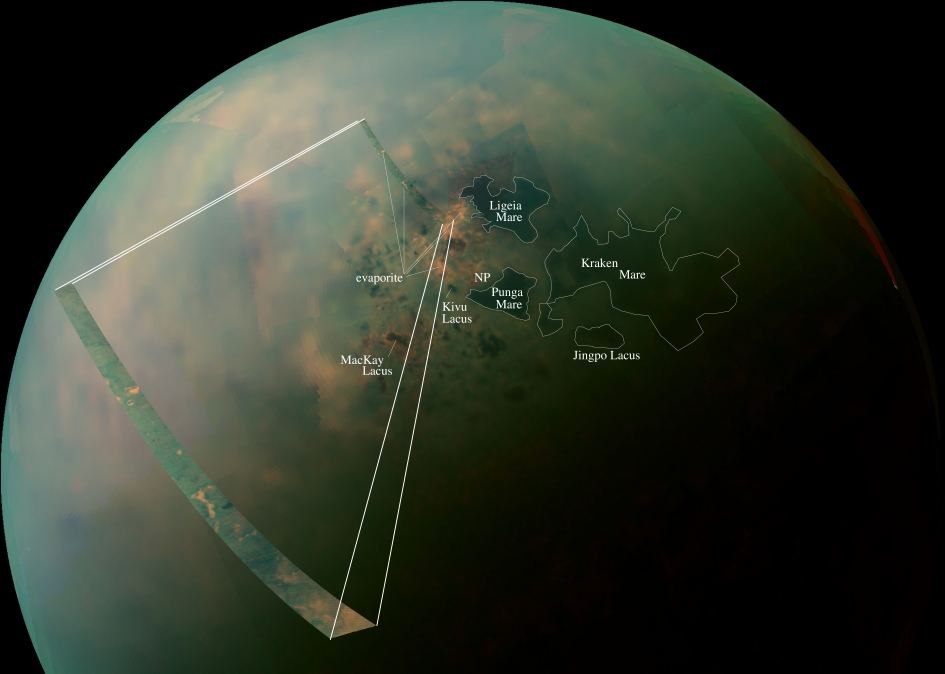


![The northern polar area of Titan and Vid Flumina drainage basin. (left) On top of the image, the Ligeia Mare; in the lower right the North Kraken Mare; the two seas are connected each other by a labyrinth of channels. On the left, near the North pole, the Punga Mare. Red arrows indicate the position of the two flumina significant for this work. At the end of its mission (15 September 2017) the Cassini RADAR in its imaging mode (SAR+ HiSAR) will have covered a total area of 67% of the surface of Titan [Hayes, 2016]. Map credits: R. L. Kirk. (right) Highlighted in yellow are the half-power altimetric footprints within the Vid Flumina drainage basin and the Xanthus Flumen course for which specular reflections occurred. At 1400?km of spacecraft altitude, the Cassini antenna 0.35° central beam produces footprints of about 8.5?km in diameter (diameter of yellow circles). Credit: NASA/JPL](https://www.universetoday.com/wp-content/uploads/2016/11/grl54735-fig-0001.png)