According to multiple sources – which includes NASA, the NOAA, the Berkeley Earth research group, and the Met Office Hadley Centre (UK) – global temperatures over the past few years have been some of the hottest on record. This is the direct result of anthropogenic factors like overpopulation, urbanization, deforestation, and increased greenhouse gas emissions (like carbon dioxide and methane).
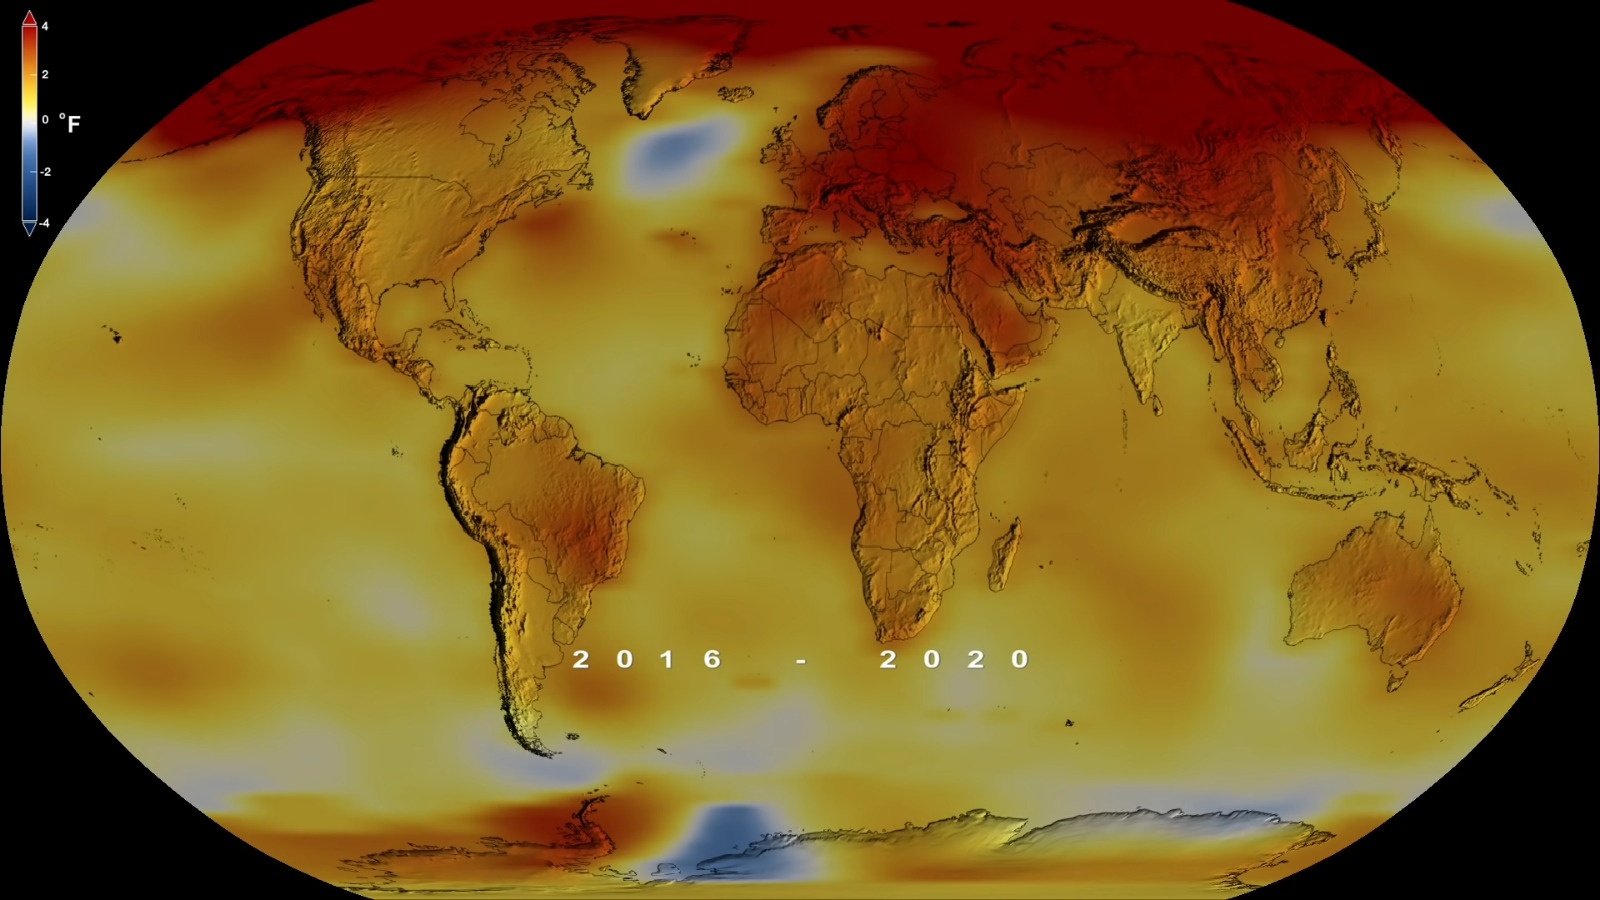
According to a recent press release from NASA, in terms of global temperatures, 2020 was the hottest year on record – effectively tying it with 2016 (the previous record-holder). The release includes a dramatic video that illustrates average temperature increases since 1880 and the ecological crises that have taken place just this past year. This is yet another warning of how human agency is impacting the very systems we depend upon for our continued survival.
MESSENGER image of Mercury from its third flyby (NASA/Johns Hopkins University Applied Physics Laboratory/Carnegie Institution of Washington)
Of all the planets in the Solar System, Mercury is the closest to our Sun. As such, you would think it is the hottest of all the Solar planets. But strangely enough, it is not. That honor goes to Venus, which experiences an average surface temperature of 750 K (477 °C; 890 °F). Not only that, but Mercury is also cold enough in some regions to maintain water in ice form.
Overall, Mercury experiences considerable variations in temperatures, ranging from the extremely hot to the extremely cold. All of this arises from the fact that Mercury has an extremely thin atmosphere, as well as the nature of its orbit. Whereas the side facing the Sun experiences temperatures hot enough to melt lead, the darkened areas are cold enough to freeze water.
Orbital Characteristics:
Mercury has the most eccentric orbit of any planet in the Solar System (0.205). Because of this, its distance from the Sun varies between 46 million km (29 million mi) at its closest (perihelion) to 70 million km (43 million mi) at its farthest (aphelion). And with an average orbital velocity of 47.362 km/s (29.429 mi/s), it takes Mercury a total 87.969 Earth days to complete a single orbit around the Sun.
With an average rotational speed of 10.892 km/h (6.768 mph), Mercury also takes 58.646 days to complete a single rotation. This means that Mercury has a spin-orbit resonance of 3:2, which means that it completes three rotations on its axis for every two orbits around the Sun. This does not, however, mean that three days last the same as two years on Mercury.
In fact, its high eccentricity and slow rotation mean that it takes 176 Earth days for the Sun to return to the same place in the sky (aka. a solar day), which means that one day is twice as long as a single year on Mercury. The planet also has the lowest axial tilt of any planet in the Solar System – approximately 0.027° compared to Jupiter’s 3.1°, (the second smallest). This means that there is virtually no seasonal variation in surface temperature.
Exosphere:
Another factor that affects Mercury’s surface temperatures is its extremely thin atmosphere. Mercury is essentially too hot and too small to retain anything more than a variable “exosphere”, one which is made up of hydrogen, helium, oxygen, sodium, calcium, potassium and water vapor.
The Fast Imaging Plasma Spectrometer on board MESSENGER has found that the solar wind is able to bear down on Mercury enough to blast particles from its surface into its wispy atmosphere. Credit: Carolyn Nowak/Media Academica, LLC
These trace gases have a combined atmospheric pressure of about 10-14 bar (one-quadrillionth of Earth’s atmospheric pressure). It is believed this exosphere was formed from particles captured from the Sun, volcanic outgassing and debris kicked into orbit by micrometeorite impacts.
Surface Temperatures:
Because it lacks a viable atmosphere, Mercury has no way to retain the heat from the Sun. As a result of this and its high eccentricity, the planet experiences considerable variations in temperature between its light side and dark side. Whereas the side that faces the Sun can reach temperatures of up to 700 K (427° C; 800 °F), the side in shadow dips down to 100 K (-173° C: -279 °F).
Despite its extreme highs in temperature, the existence of water ice and even organic molecules has been confirmed on Mercury’s surface, specifically in the cratered northern polar region. Since the floors of these deep craters are never exposed to direct sunlight, temperatures there remain below the planetary average.
View of Mercury’s north pole. based on MESSENGER probe data, showing polar deposits of water ice. Credit: NASA/JHUAPL/Carnegie/National Astronomy and Ionosphere Center, Arecibo Observatory.
These icy regions are believed to contain about 1014–1015 kg of frozen water, and may be covered by a layer of regolith that inhibits sublimation. The origin of the ice on Mercury is not yet known, but the two most likely sources are from outgassing of water from the planet’s interior or deposition by the impacts of comets. There are thought to be craters at the south pole as well, where temperatures are similarly cold enough to sustain water in ice form.
Mercury is a planet of extremes. It has an extremely eccentric orbit, an extremely thin-atmosphere, and experiences extremely hot and cold surface temperatures. Little wonder then why there is no life on the planet (at least, that we know about!) But perhaps someday, human beings may live there, sheltered in the cratered regions and using the water ice to create a habitat.
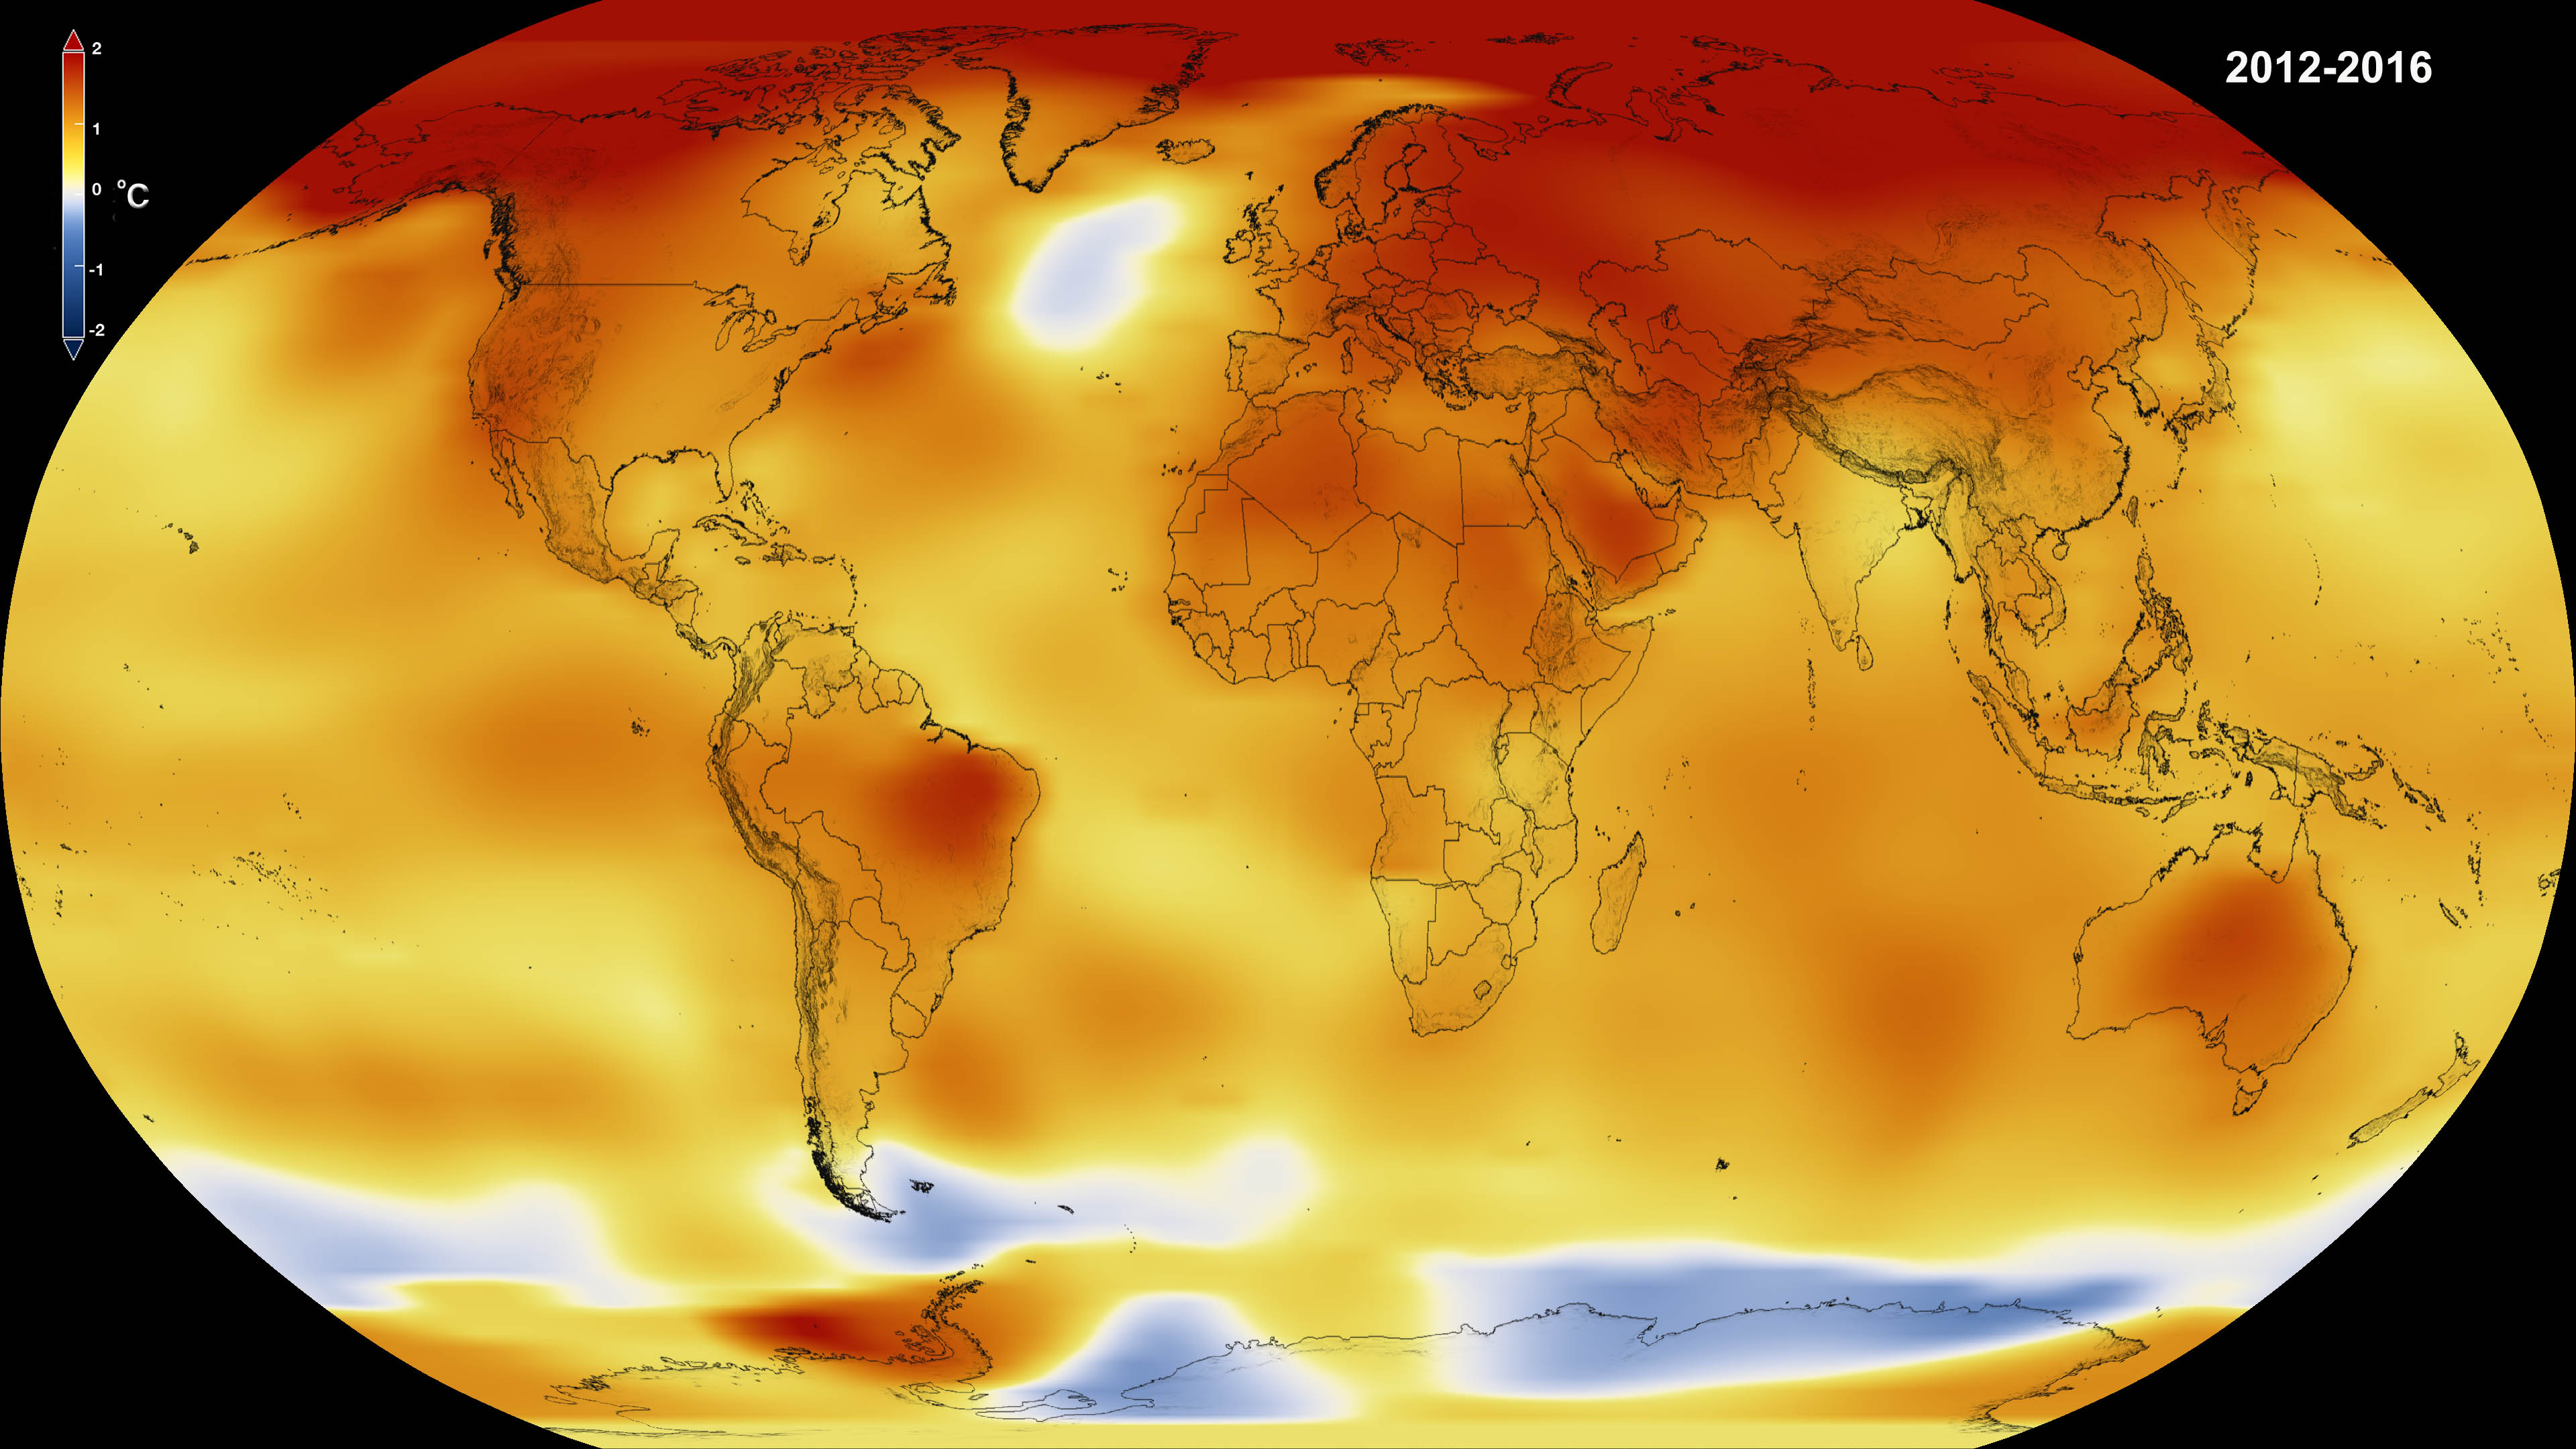
According to data from NASA and the NOAA, 2016 was the hottest year on record yet again. Credit: NASA
The reality of Climate Change has become painfully apparent in recent years, thanks to extended droughts in places like California, diminishing water tables around the world, rising tides, and coastal storms of increasing intensity and frequency. But perhaps the most measurable trend is the way that average global temperatures have kept rising year after year.
And this has certainly been the case for the year of 2016. According to independent analyses provided by NASA’s Goddard Institute for Space Studies (GISS) and the National Oceanic and Atmospheric Agency (NOAA), 2016 was the warmest year since modern record keeping began in 1880. This represents a continuation of a most alarming trend, where 16 of the 17 warmest years on record have occurred since 2001.
Based in New York, GISS conducts space and Earth sciences research, in support of the Goddard Space Flight Center’s (GSFC) Sciences and Exploration Directorate. Since its establishment in 1961, the Institute has conducted valuable research on Earth’s structure and atmosphere, the Earth-Sun relationship, and the structure and atmospheres of other planets in the Solar System.
Monthly temperature anomalies with base 1980-2015, superimposed on a 1980-2015 mean seasonal cycle. Credit: NASA/GISS/Schmidt
Their early studies of Earth and other solar planets using data collected by satellites, space probes, and landers eventually led to GISS becoming a leading authority on atmospheric modeling. Similarly, the NOAA efforts to monitor atmospheric conditions and weather in the US since 1970s has led to them becoming a major scientific authority on Climate Change.
Together, the two organizations looked over global temperature data for the year of 2016 and came to the same conclusion. Based on their assessments, GISS determined that globally-averaged surface temperatures in 2016 were 0.99 °C (1.78 °F) warmer than the mid-20th century mean. As GISS Director Gavin Schmidt put it, these findings should silence any doubts about the ongoing nature of Global Warming:
“2016 is remarkably the third record year in a row in this series. We don’t expect record years every year, but the ongoing long-term warming trend is clear.”
The NOAA’s findings were similar, with an average temperature of 14.83 °C (58.69 °F) being reported for 2016. This surpassed last year’s record by about 0.004 °C (0.07 °F), and represents a change of around 0.94 °C (1.69 F) above the 20th century average. The year began with a boost, thanks to El Nino; and for the eight consecutive months that followed (January to August) the world experienced record temperatures.
This represents a consistent change since 2001, where average global temperatures have increased, leading to of the 16 warmest years on record since 1880 in a row. In addition, on five separate occasions during this period, the annual global temperature was record-breaking – in 2005, 2010, 2014, 2015, and 2016, respectively.
Land and ocean global temperatures in 2013 from both NASA and NOAA. Credit: NASA.
With regards to the long-term trend, average global temperatures have increased by about 1.1° Celsius (2° Fahrenheit) since 1880. This too represents a change, since the rate of increase was placed at 0.8° Celsius (1.4° Fahrenheit) back in 2014. Two-thirds of this warming has occurred since 1975, which coincides with a period of rapid population growth, industrialization, and increased consumption of fossil fuels.
And while there is always a degree of uncertainty when it comes to atmospheric and temperature modelling, owing to the fact that the location of measuring stations and practices change over time, NASA indicated that they were over 95% certain of these results. As such, there is little reason to doubt them, especially since they are consistent with what is at this point a very well-documented trend.
To see an animated graph of average global temperature increases since 1880, click here. To see the full data set and learn about the methods employed by GISS, click here.
And be sure to check out this NASA video that shows these changes on a global map:
Earth's axial tilt (or obliquity) and its relation to the rotation axis and plane of orbit. Credit: Wikipedia Commons
In ancient times, the scholars, seers and magi of various cultures believed that the world took a number of forms – ranging from a ziggurat or a cube to the more popular flat disc surrounded by a sea. But thanks to the ongoing efforts of astronomers, we have come to understand that it is in fact a sphere, and one of many planets in a system that orbits the Sun.
Within the past few centuries, improvements in both scientific instruments and more comprehensive observations of the heavens have also helped astronomers to determine (with extreme accuracy) what the nature of Earth’s orbit is. In addition to knowing the precise distance from the Sun, we also know that our planet orbits the Sun with one pole constantly tilted towards it.
Earth’s Axis:
This is what is known axial tilt, where a planet’s vertical axis is tilted a certain degree towards the ecliptic of the object it orbits (in this case, the Sun). Such a tilt results in there being a difference in how much sunlight reaches a given point on the surface during the course of a year. In the case of Earth, the axis is tilted towards the ecliptic of the Sun at approximately 23.44° (or 23.439281° to be exact).
Earth’s axis points north to Polaris, the northern hemisphere’s North Star, and south to dim Sigma Octantis. Credit: Bob King
Seasonal Variations:
This tilt in Earth’s axis is what is responsible for seasonal changes during the course of the year. When the North Pole is pointed towards the Sun, the northern hemisphere experiences summer and the southern hemisphere experiences winter. When the South Pole is pointed towards the Sun, six months later, the situation is reversed.
In addition to variations in temperature, seasonal changes also result in changes to the diurnal cycle. Basically, in the summer, the day last longer and the Sun climbs higher in the sky. In winter, the days become shorter and the Sun is lower in the sky. In northern temperate latitudes, the Sun rises north of true east during the summer solstice, and sets north of true west, reversing in the winter. The Sun rises south of true east in the summer for the southern temperate zone, and sets south of true west.
The situation becomes extreme above the Arctic Circle, where there is no daylight at all for part of the year, and for up to six months at the North Pole itself (known as a “polar night”). In the southern hemisphere, the situation is reversed, with the South Pole oriented opposite the direction of the North Pole and experiencing what is known as a “midnight sun” (a day that lasts 24 hours).
The four seasons can be determined by the solstices (the point of maximum axial tilt toward or away from the Sun) and the equinoxes (when the direction of tilt and the Sun are perpendicular). In the northern hemisphere, winter solstice occurs around December 21st, summer solstice around June 21st, spring equinox around March 20th, and autumnal equinox on or about September 22nd or 23rd. In the southern hemisphere, the situation is reversed, with the summer and winter solstices exchanged and the spring and autumnal equinox dates swapped.
Changes Over Time:
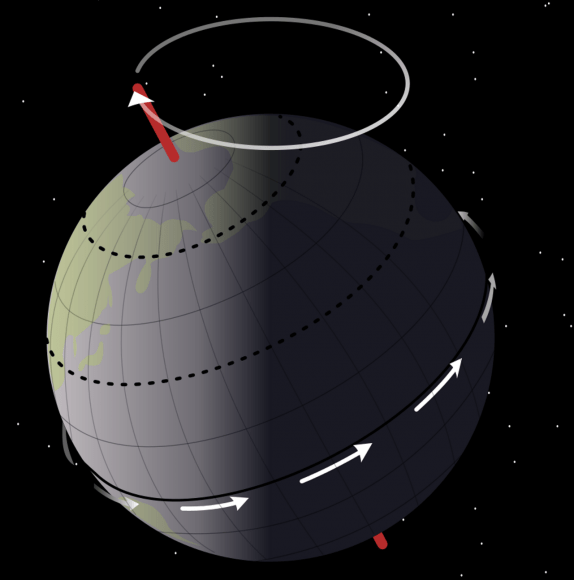
The angle of the Earth’s tilt is relatively stable over long periods of time. However, Earth’s axis does undergo a slight irregular motion known as nutation – a rocking, swaying, or nodding motion (like a gyroscope) – that has a period of 18.6 years. Earth’s axis is also subject to a slight wobble (like a spinning top), which is causing its orientation to change over time.
Known as precession, this process is causing the date of the seasons to slowly change over a 25,800 year cycle. Precession is not only the reason for the difference between a sidereal year and a tropical year, it is also the reason why the seasons will eventually flip. When this happens, summer will occur in the northern hemisphere during December and winter during June.
Artist’s rendition of the Earth’s rotation and the precession of the Equinoxes. Credit: NASA
Precession, along with other orbital factors, is also the reason for what is known as “length-of-day variation”. Essentially, this is a phenomna where the dates of Earth’s perihelion and aphelion (which currently take place on Jan. 3rd and July 4th, respectively) change over time. Both of these motions are caused by the varying attraction of the Sun and the Moon on the Earth’s equatorial region.
Needless to say, Earth’s rotation and orbit around the Sun are not as simple we once though. During the Scientific Revolution, it was a huge revelation to learn that the Earth was not a fixed point in the Universe, and that the “celestial spheres” were planets like Earth. But even then, astronomers like Copernicus and Galileo still believed that the Earth’s orbit was a perfect circle, and could not imagine that its rotation was subject to imperfections.
It’s only been with time that the true nature of our planet’s inclination and movements have come to be understood. And what we know is that they lead to some serious variations over time – both in the short run (i.e. seasonal change), and in the long-run.
Earth Observation of sun-glinted ocean and clouds. Credit: NASA
Earth is the only planet in our Solar System where life is known to exists. Note the use of the word “known”, which is indicative of the fact that our knowledge of the Solar System is still in its infancy, and the search for life continues. However, from all observable indications, Earth is the only place in our Solar System where life can – and does – exist on the surface.
This is due to a number of factors, which include Earth’s position relative to the Sun. Being in the “Goldilocks Zone” (aka. habitable zone), and the existence of an atmosphere (and magnetosphere), Earth is able to maintain a stable average temperature on its surface that allows for the existence of warm, flowing water on its surface, and conditions favorable to life.
Variations:
The average temperature on the surface of Earth depends on a number of factors. These include the time of day, the time of year, and where the temperatures measurements are being taken. Given that the Earth experiences a sidereal rotation of approximately 24 hours – which means one side is never always facing towards the Sun – temperatures rise in the day and drop in the evening, sometimes substantially.
And given that Earth has an inclined axis (approximately 23° towards the Sun’s equator), the Northern and Southern Hemispheres of Earth are either tilted towards or away from the Sun during the summer and winter seasons, respectively. And given that equatorial regions of the Earth are closer to the Sun, and certain parts of the world experience more sunlight and less cloud cover, temperatures range widely across the planet.
However, not every region on the planet experiences four seasons. At the equator, the temperature is on average higher and the region does not experience cold and hot seasons in the same way the Northern and Southern Hemispheres do. This is because the amount of sunlight the reaches the equator changes very little, although the temperatures do vary somewhat during the rainy season.
Measurement:
The average surface temperature on Earth is approximately 14°C; but as already noted, this varies. For instance, the hottest temperature ever recorded on Earth was 70.7°C (159°F), which was taken in the Lut Desert of Iran. These measurements were part of a global temperature survey conducted by scientists at NASA’s Earth Observatory during the summers of 2003 to 2009. For five of the seven years surveyed (2004, 2005, 2006, 2007, and 2009) the Lut Desert was the hottest spot on Earth.
However, it was not the hottest spot for every single year in the survey. In 2003, the satellites recorded a temperature of 69.3°C (156.7°F) – the second highest in the seven-year analysis – in the shrublands of Queensland, Australia. And in 2008, the Flaming Mountain got its due, with a yearly maximum temperature of 66.8°C (152.2°F) recorded in the nearby Turpan Basin in western China.
Meanwhile, the coldest temperature ever recorded on Earth was measured at the Soviet Vostok Station on the Antarctic Plateau. Using ground-based measurements, the temperature reached a historic low of -89.2°C (-129°F) on July 21st, 1983. Analysis of satellite data indicated a probable temperature of around -93.2 °C (-135.8 °F; 180.0 K), also in Antarctica, on August 10th, 2010. However, this reading was not confirmed by ground measurements, and thus the previous record remains.
All of these measurements were based on temperature readings that were performed in accordance with the World Meteorological Organization standard. By these regulations, air temperature is measured out of direct sunlight – because the materials in and around the thermometer can absorb radiation and affect the sensing of heat – and thermometers are to be situated 1.2 to 2 meters off the ground.
Comparison to Other Planets:
Despite variations in temperature according to time of day, season, and location, Earth’s temperatures are remarkably stable compared to other planets in the Solar System. For instance, on Mercury, temperatures range from molten hot to extremely cold, due to its proximity to the Sun, lack of an atmosphere, and its slow rotation. In short, temperatures can reach up to 465 °C on the side facing the Sun, and drop to -184°C on the side facing away from it.
Venus, thanks to its thick atmosphere of carbon dioxide and sulfur dioxide, is the hottest planet in our Solar System. At its hottest, it can reach temperatures of up to 460 °C on a regular basis. Meanwhile, Mars’ average surface temperature is -55 °C, but the Red Planet also experiences some variability, with temperatures ranging as high as 20 °C at the equator during midday, to as low as -153 °C at the poles.
On average though, it is much colder than Earth, being just on the outer edge of the habitable zone, and because of its thin atmosphere – which is not sufficient to retain heat. In addition, its surface temperature can vary by as much as 20 °C due to Mars’ eccentric orbit around the Sun (meaning that it is closer to the Sun at certain points in its orbit than at others).
Since Jupiter is a gas giant, and has no solid surface, an accurate assessment of it’s “surface temperature” is impossible. But measurements taken from the top of Jupiter’s clouds indicate a temperature of approximately -145°C. Similarly, Saturn is a rather cold gas giant planet, with an average temperature of -178 °Celsius. But because of Saturn’s tilt, the southern and northern hemispheres are heated differently, causing seasonal temperature variation.
Uranus is the coldest planet in our Solar System, with a lowest recorded temperature of -224°C, while temperatures in Neptune’s upper atmosphere reach as low as -218°C. In short, the Solar System runs the gambit from extreme cold to extreme hot, with plenty of variance and only a few places that are temperate enough to sustain life. And of all of those, it is only planet Earth that seems to strike the careful balance required to sustain it perpetually.
Variations Throughout History:
Estimates on the average surface temperature of Earth are somewhat limited due to the fact that temperatures have only been recorded for the past two hundred years. Thus, throughout history the recorded highs and lows have varied considerably. An extreme example of this would during the early history of the Solar System, some 3.75 billion years ago.
At this time, the Sun roughly 25% fainter than it is today, and Earth’s atmosphere was still in the process of formation. Nevertheless, according to some research, it is believed that the Earth’s primordial atmosphere – due to its concentrations of methane and carbon dioxide – could have sustained surface temperatures above freezing.
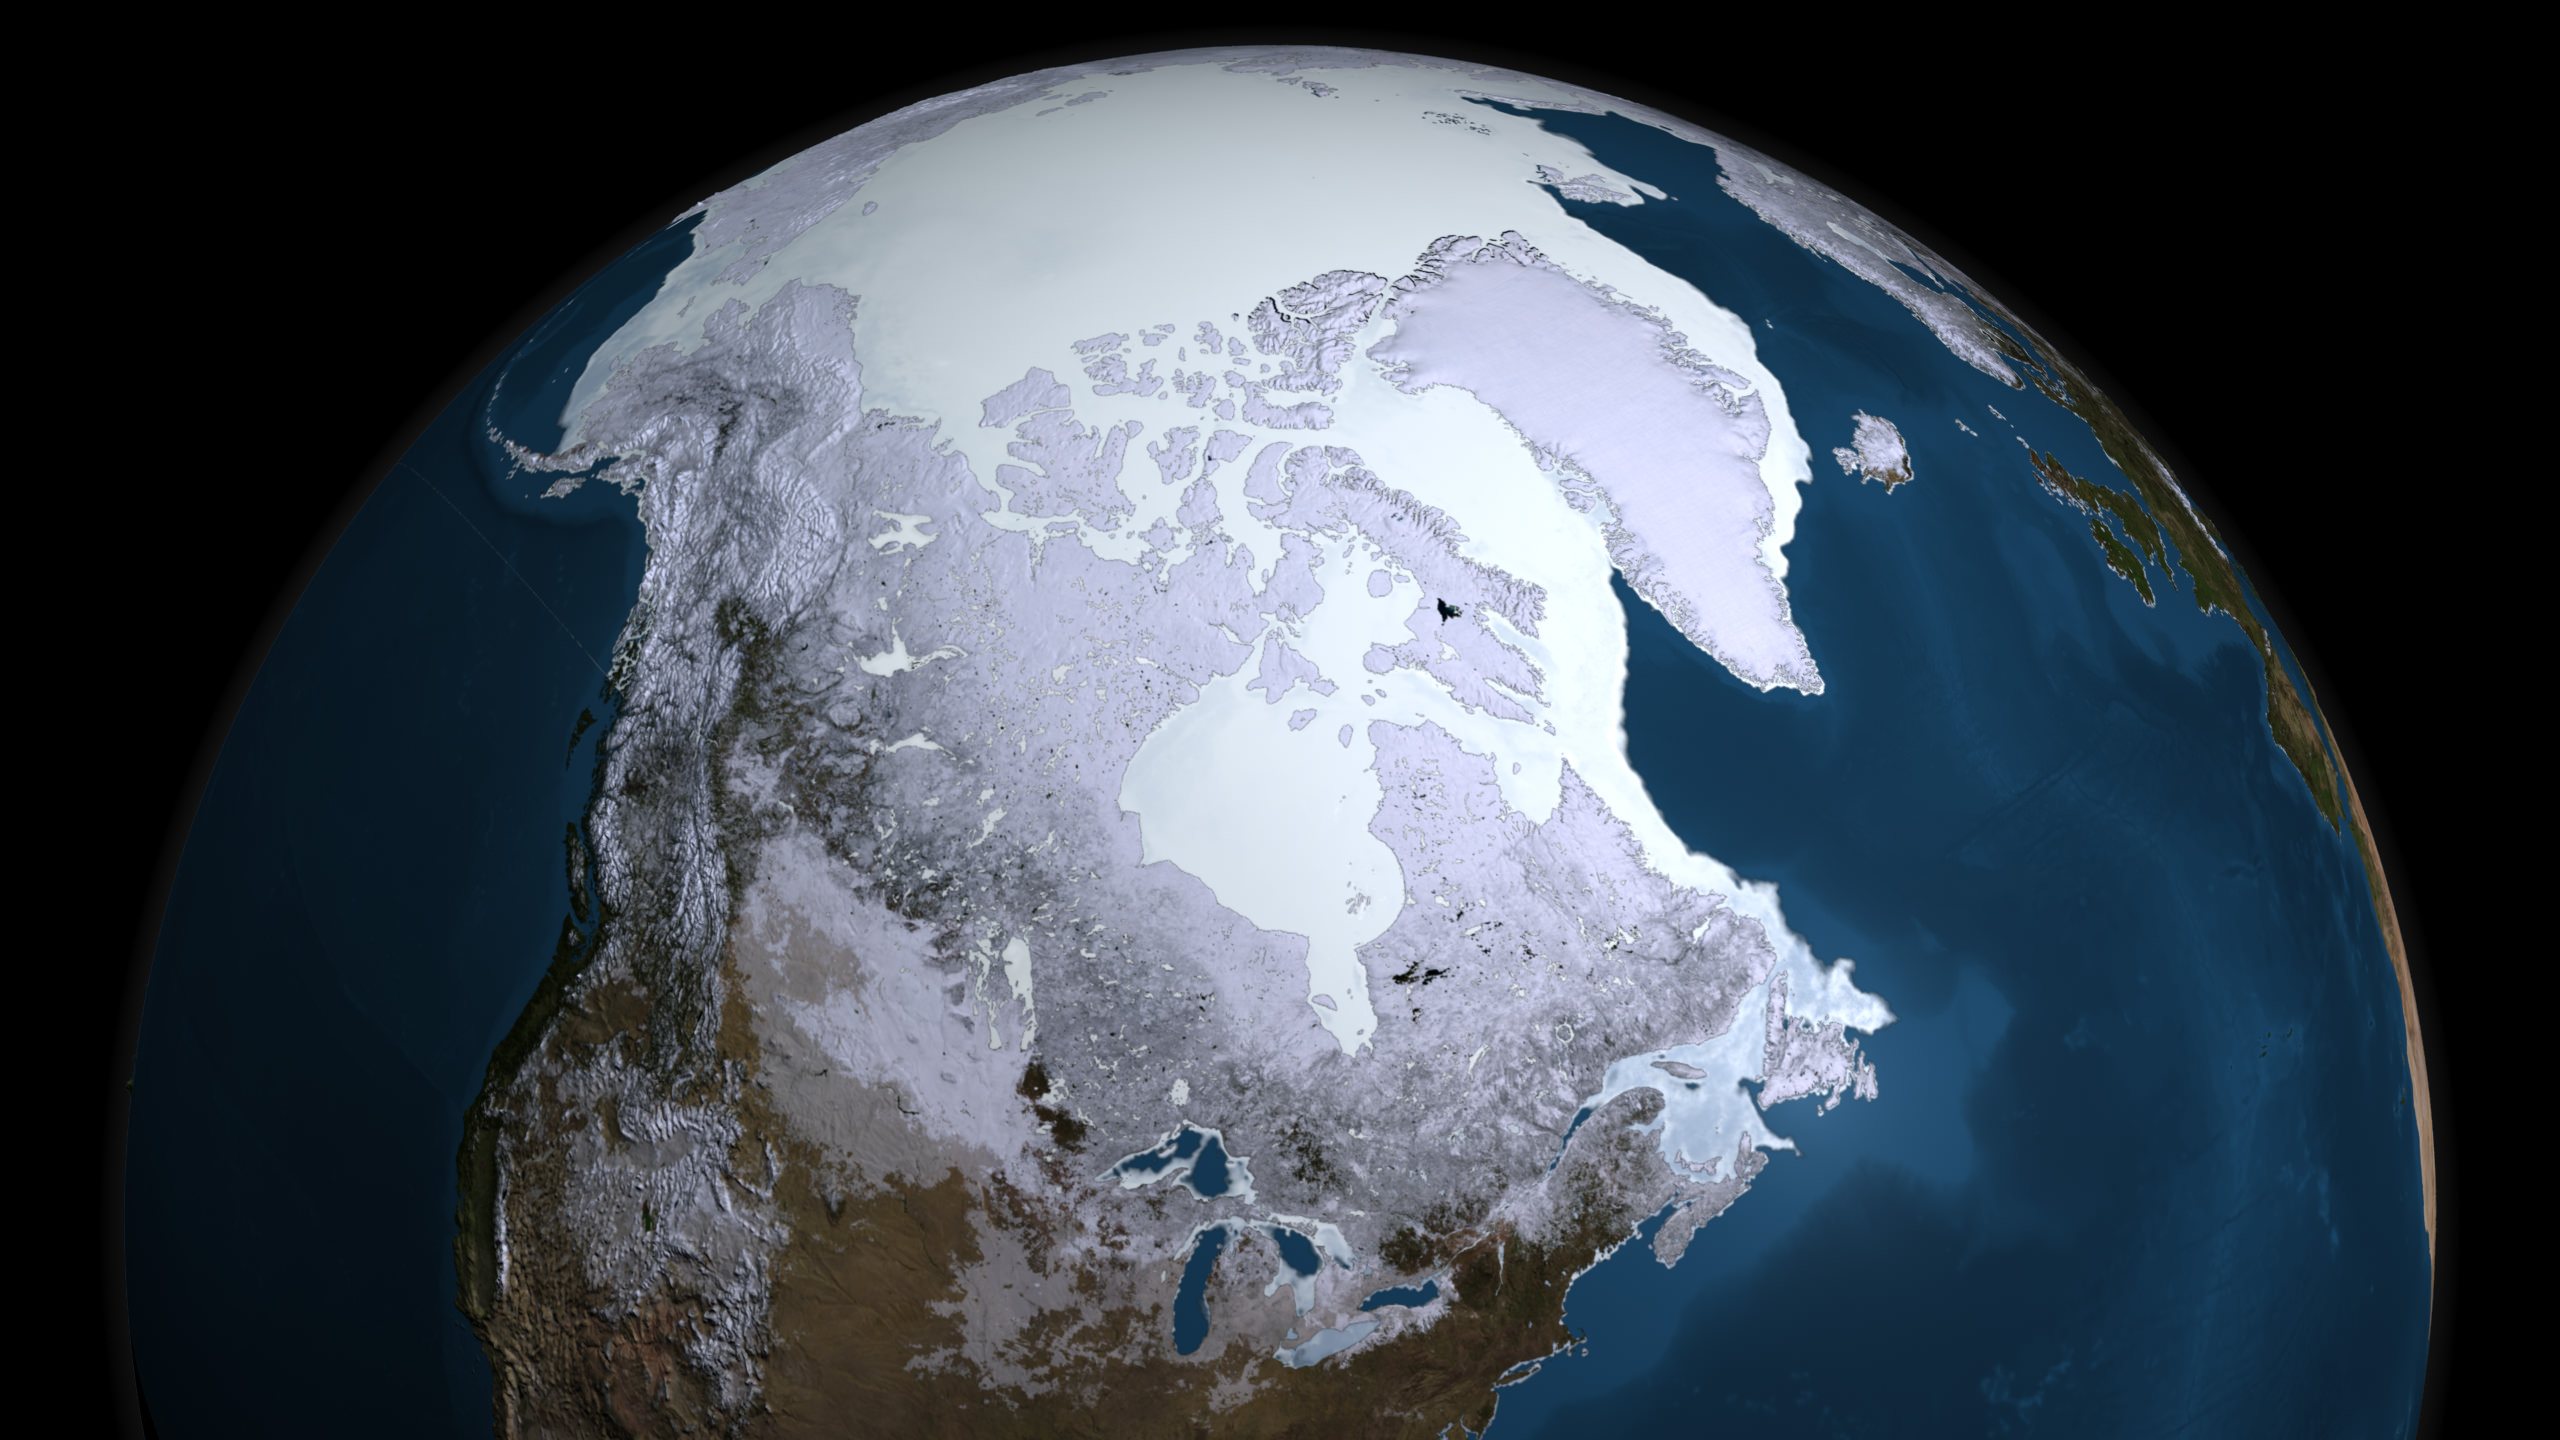
The Earth has been through five major ice ages in the past 2.4 billion years, including the one we are currently living in. Credit: NASA Goddard’s Scientific Visualization Studio
Earth has also undergone periodic climate shifts in the past 2.4 billion years, including five major ice ages – known as the Huronian, Cryogenian, Andean-Saharan, Karoo, and Pliocene-Quaternary, respectively. These consisted of glacial periods where the accumulation of snow and ice increased the surface albedo, more of the Sun’s energy was reflected into space, and the planet maintained a lower atmospheric and average surface temperature.
These periods were separated by “inter-glacial periods”, where increases in greenhouse gases – such as those released by volcanic activity – increased the global temperature and produced a thaw. This process, which is also known as “global warming”, has become a source of controversy during the modern age, where human agency has become a dominant factor in climate change. Hence why some geologists use the term “Anthropocene” to refer to this period.
This map represents global temperature anomalies averaged from 2008 through 2012. Credit: NASA Goddard Institute for Space Studies/NASA Goddard’s Scientific Visualization Studio.
Internal Temperatures:
When talking about the temperatures of planets, there is a major difference between what is measured at the surface and what conditions exist within the planet’s interior. Essentially, the temperature gets cooler the farther one ventures from the core, which is due to the planet’s internal pressure steadily decreasing the father out one goes. And while scientists have never sent a probe to our planet’s core to obtain accurate measurements, various estimates have been made.
For instance, it is believed that the temperature of the Earth’s inner core is as high as 7000 °C, whereas the outer core is thought to be between 4000 and 6000 °C. Meanwhile, the mantle, the region that lies just below the Earth’s outer crust, is estimated to be around 870 °C. And of course, the temperature continues to steadily cool as you rise in the atmosphere.
In the end, temperatures vary considerably on every planet in our Solar System, due to a multitude of factors. But from what we can tell, Earth is alone in that it experiences temperature variations small enough to achieve a degree of stability. Basically, it is the only place we know of that it is both warm enough and cool enough to support life. Everywhere else is just too extreme!


