Dark Energy Illuminated By Largest Galactic Map Ten Years In The Making

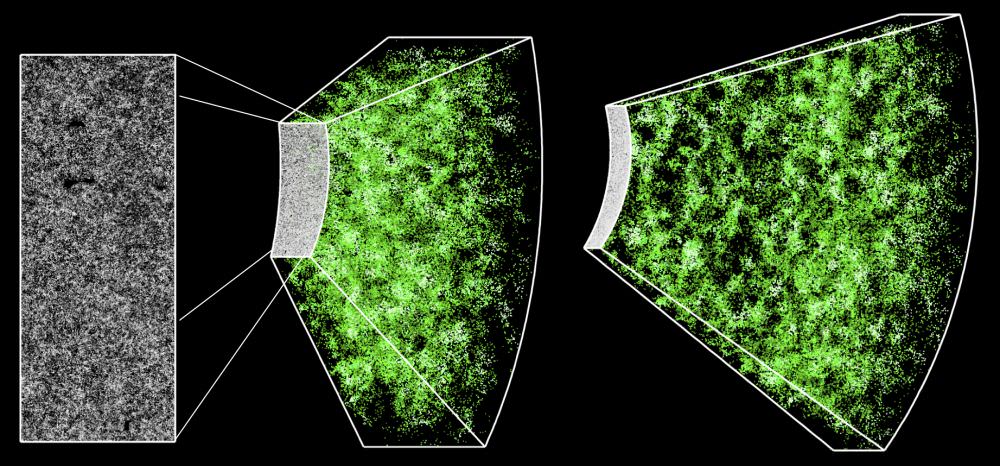
A section of the 3D map constructed by BOSS. The rectangle on the far left shows a cutout of 1000 sq. degrees in the sky containing nearly 120,000 galaxies, or roughly 10% of the total survey. Credit: Jeremy Tinker/SDSS-III

In 1929, Edwin Hubble forever changed our understanding of the cosmos by showing that the Universe is in a state of expansion. By the 1990s, astronomers determined that the rate at which it is expanding is actually speeding up, which in turn led to the theory of “Dark Energy“. Since that time, astronomers and physicists have sought to determine the existence of this force by measuring the influence it has on the cosmos.

The latest in these efforts comes from the Sloan Digital Sky Survey III (SDSS III), where an international team of researchers have announced that they have finished creating the most precise measurements of the Universe to date. Known as the Baryon Oscillation Spectroscopic Survey (BOSS), their measurements have placed new constraints on the properties of Dark Energy.

The new measurements were presented by Harvard University astronomer Daniel Eisenstein at a recent meeting of the American Astronomical Society. As the director of the Sloan Digital Sky Survey III (SDSS-III), he and his team have spent the past ten years measuring the cosmos and the periodic fluctuations in the density of normal matter to see how galaxies are distributed throughout the Universe.
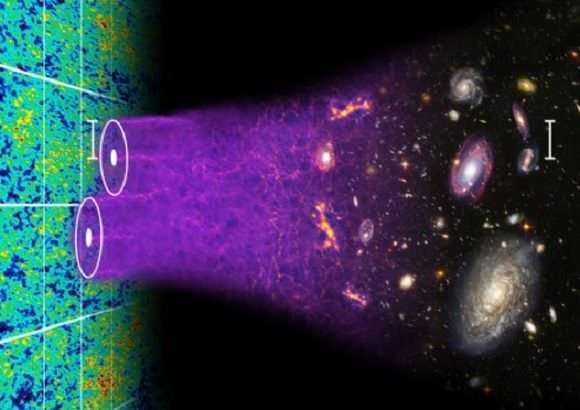
An illustration of the concept of baryon acoustic oscillations, which are imprinted in the early universe and can still be seen today in galaxy surveys like BOSS (Illustration courtesy of Chris Blake and Sam Moorfield).
An illustration of baryon acoustic oscillations, which are imprinted in the early universe and can still be seen today in galaxy surveys like BOSS. Credit: Chris Blake and Sam Moorfield

And after a decade of research, the BOSS team was able to produce a three-dimensional map of the cosmos that covers more than six billion light-years. And while other recent surveys have looked further afield – up to distances of 9 and 13 billion light years – the BOSS map is unique in that it boasts the highest accuracy of any cosmological map.

In fact, the BOSS team was able to measure the distribution of galaxies in the cosmos, and at a distance of 6 billion light-years, to within an unprecedented 1% margin of error. Determining the nature of cosmic objects at great distances is no easy matter, due the effects of relativity. As Dr. Eisenstein told Universe Today via email:

“Distances are a long-standing challenge in astronomy. Whereas humans often can judge distance because of our binocular vision, galaxies beyond the Milky Way are much too far away to use that. And because galaxies come in a wide range of intrinsic sizes, it is hard to judge their distance. It’s like looking at a far-away mountain; one’s judgement of its distance is tied up with one’s judgement of its height.”

In the past, astronomers have made accurate measurements of objects within the local universe (i.e. planets, neighboring stars, star clusters) by relying on everything from radar to redshift – the degree to which the wavelength of light is shifted towards the red end of the spectrum. However, the greater the distance of an object, the greater the degree of uncertainty.
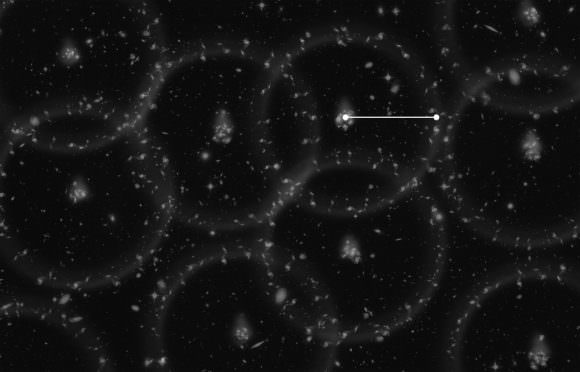
 An artist's concept of the latest, highly accurate measurement of the Universe from BOSS. The spheres show the current size of the "baryon acoustic oscillations" (BAOs) from the early universe, which have helped to set the distribution of galaxies that we see in the universe today. Galaxies have a slight tendency to align along the edges of the spheres — the alignment has been greatly exaggerated in this illustration. BAOs can be used as a "standard ruler" (white line) to measure the distances to all the galaxies in the universe. Credit: Zosia Rostomian, Lawrence Berkeley National Laboratory
An artist’s concept of the latest, highly accurate measurement of the Universe from BOSS. Credit: Zosia Rostomian/Lawrence Berkeley National Laboratory

And until now, only objects that are a few thousand light-years from Earth – i.e. within the Milky Way galaxy – have had their distances measured to within a one-percent margin of error. As the largest of the four projects that make up the Sloan Digital Sky Survey III (SDSS-III), what sets BOSS apart is the fact that it relies primarily on the measurement of what are called “baryon acoustic oscillations” (BAOs).

These are essentially subtle periodic ripples in the distribution of visible baryonic (i.e. normal) matter in the cosmos. As Dr. Daniel Eisenstein explained:

“BOSS measures the expansion of the Universe in two primary ways. The first is by using the baryon acoustic oscillations (hence the name of the survey). Sound waves traveling in the first 400,000 years after the Big Bang create a preferred scale for separations of pairs of galaxies. By measuring this preferred separation in a sample of many galaxies, we can infer the distance to the sample. 

“The second method is to measure how clustering of galaxies differs between pairs oriented along the line of sight compared to transverse to the line of sight. The expansion of the Universe can cause this clustering to be asymmetric if one uses the wrong expansion history when converting redshifts to distance.”

With these new, highly-accurate distance measurements, BOSS astronomers will be able to study the influence of Dark Matter with far greater precision. “Different dark energy models vary in how the acceleration of the expansion of the Universe proceeds over time,” said Eisenstein. “BOSS is measuring the expansion history, which allows us to infer the acceleration rate. We find results that are highly consistent with the predictions of the cosmological constant model, that is, the model in which dark energy has a constant density over time.”
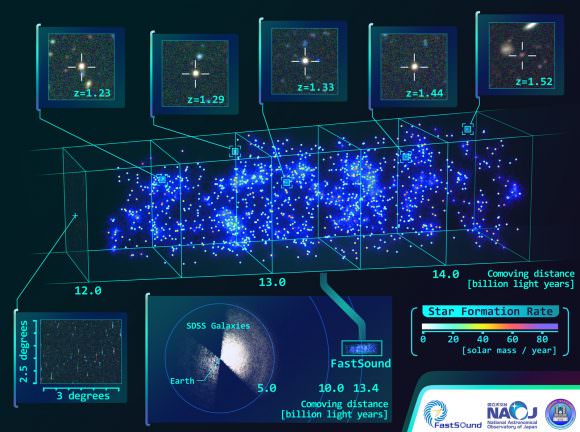
An international team of researchers have produced the largest 3-D map of the universe to date, which validates Einstein's theory of General Relativity. Credit: NAOJ/CFHT/ SDSS
Discerning the large-scale structure of the universe, and the role played by Dark Energy, is key to unlocking its mysteries. Credit: NAOJ/CFHT/ SDSS

In addition to measuring the distribution of normal matter to determine the influence of Dark Energy, the SDSS-III Collaboration is working to map the Milky Way and search for extrasolar planets. The BOSS measurements are detailed in a series of articles that were submitted to journals by the BOSS collaboration last month, all of which are now available online.

And BOSS is not the only effort to understand the large-scale structure of our Universe, and how all its mysterious forces have shaped it. Just last month, Professor Stephen Hawking announced that the COSMOS supercomputing center at Cambridge University would be creating the most detailed 3D map of the Universe to date.

Relying on data obtained by the CMB data obtained by the ESA’s Planck satellite and information from the Dark Energy Survey, they also hope to measure the influence Dark Energy has had on the distribution of matter in our Universe. Who knows? In a few years time, we may very well come to understand how all the fundamental forces governing the Universe work together.

Further Reading: SDSIII

Distant Galaxies Reveal 3D Cosmic Web for the First Time

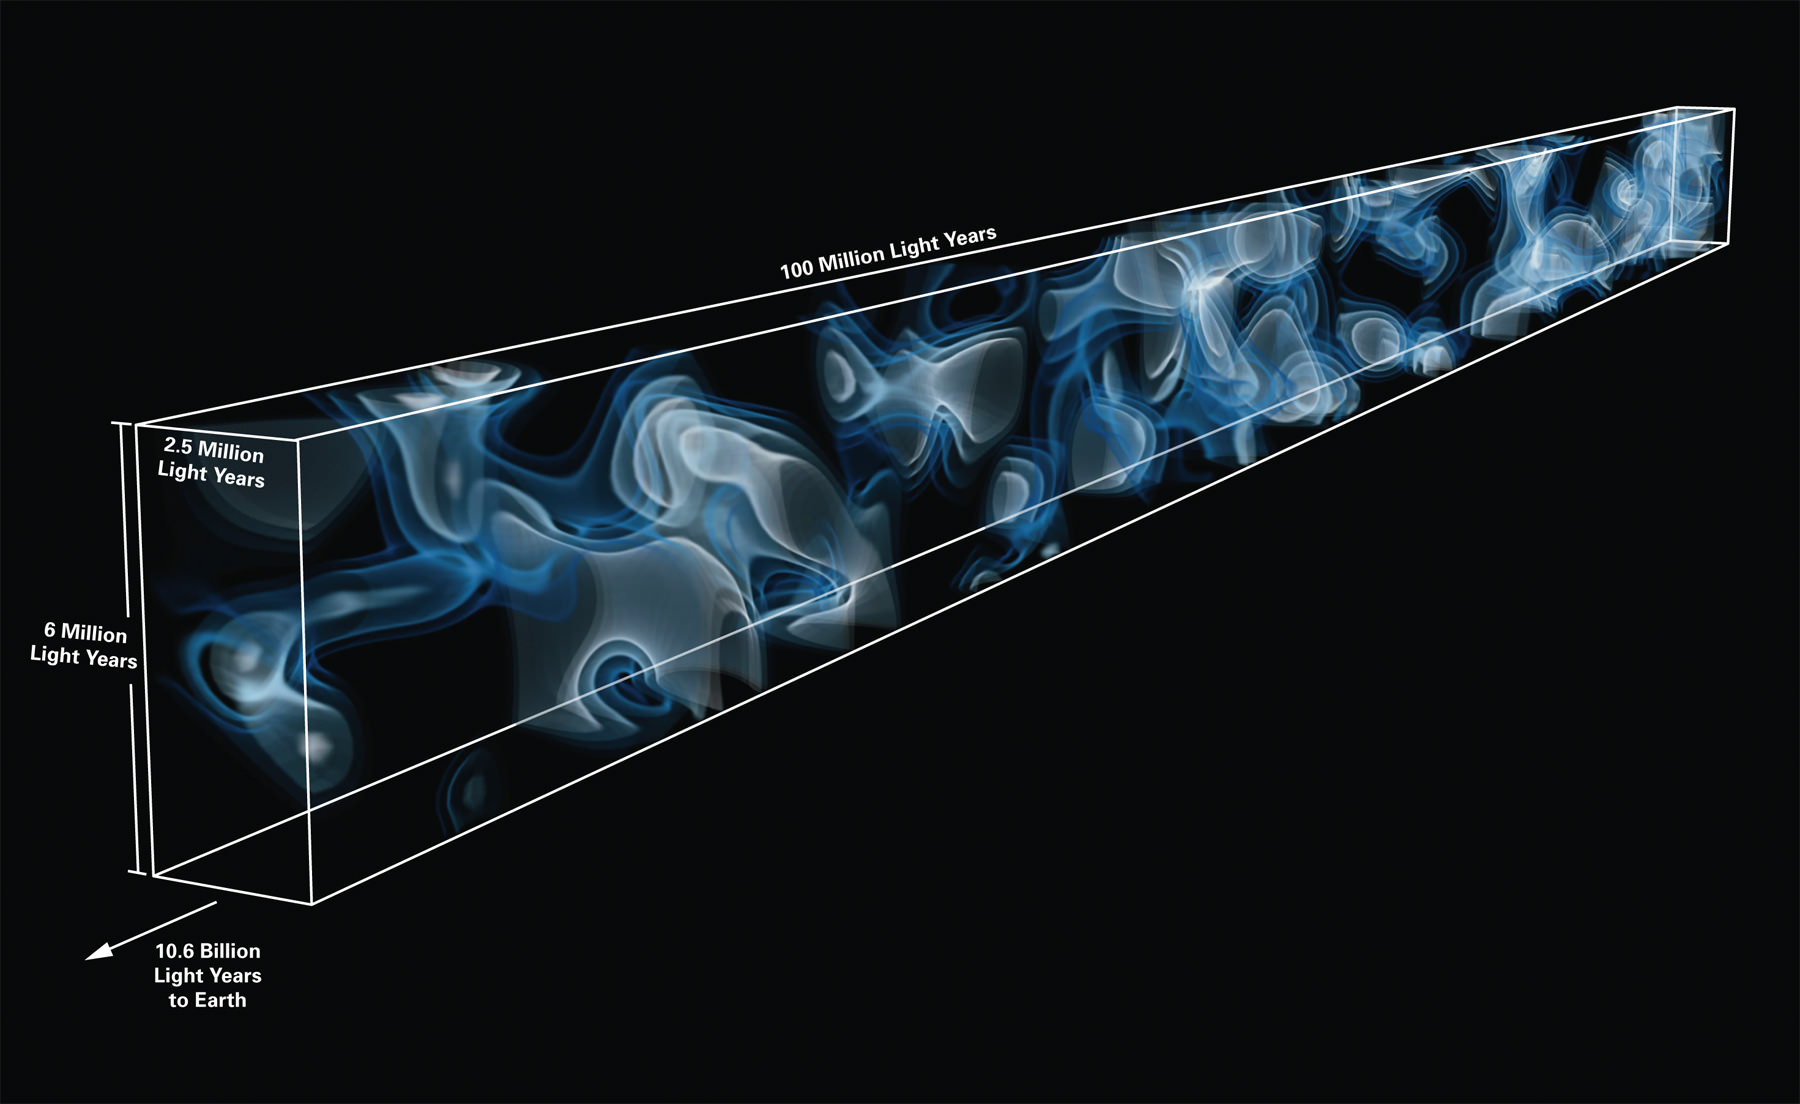
3D map of the cosmic web at a distance of 10.8 billion light years from Earth. The map was generated from imprints of hydrogen gas observed in the spectrum of 24 background galaxies, which are located behind the volume being mapped. This is the first time that large-scale structures in such a distant part of the Universe have been mapped directly. The coloring represents the density of hydrogen gas tracing the cosmic web, with brighter colors representing higher density. Credit: Casey Stark (UC Berkeley) and Khee-Gan Lee (MPIA)

On the largest scales, networks of gaseous filaments span hundreds of millions of light-years, connecting massive galaxy clusters. But this gas is so rarified, it’s impossible to see directly.

For years, astronomers have used quasars — brilliant galactic centers fueled by supermassive black holes rapidly accreting material — to map the otherwise invisible matter.

But now, for the first time, a team of astronomers led by Khee-Gan Lee, a post-doc at the Max Planck Institute for Astronomy, has managed to create a three-dimensional map of the large-scale structure of the Universe using distant galaxies. And the advantages are numerous.

The science has always gone a little something like this: as the bright light from a distant quasar travels toward Earth, it encounters the intervening clouds of hydrogen gas and is partially absorbed. This leaves dark absorption lines in the quasar’s spectrum.

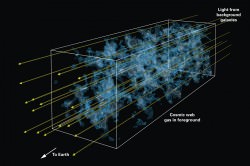
Artist's impression illustrating the technique of Lyman-alpha tomography: as light from distant background galaxies (yellow arrows) travels through the Universe towards Earth, hydrogen gas in the foreground leaves a characteristic imprint ("absorption signature"). From this imprint, astronomers can reconstruct which clouds the light has encountered as it traverses the "cosmic web" of dark matter and gas that accounts for the biggest structures in our universe. By observing a number of background galaxies in a small patch of the sky, astronomers were able to create a 3D map of the cosmic web using a technique similar to medical computer tomography (CT) scans. The coloring represents the density of hydrogen gas tracing the cosmic web, with brighter colors representing higher density. The rendition of the cosmic web in this image is based on a supercomputer simulation of cosmic structure formation. Credit: Khee-Gan Lee (MPIA) and Casey Stark (UC Berkeley)
Artist’s impression illustrating how a distant quasar’s or galaxy’s spectrum becomes clouded with absorption lines from intervening hydrogen gas. Credit: Khee-Gan Lee (MPIA) and Casey Stark (UC Berkeley)

If the Universe were static, the dark absorption lines would always be located at the same spot (121 nanometers for the so-called Lyman-alpha line) in the quasar’s spectrum. But because the Universe is expanding, the distant quasar is flying away from the Earth at a rapid speed. This stretches the quasar’s light, such that each intervening hydrogen gas cloud imprints its absorption signature on a different region of the quasar’s spectrum, leaving a forest of lines.

Therefore detailed measurements of multiple quasars’ spectra close together can actually reveal the three-dimensional nature of the intervening hydrogen clouds. But galaxies are nearly 100 times more numerous than quasars. So in theory they should provide a much more detailed map.

The only problem is that galaxies are also about 15 times fainter than quasars. So astronomers thought they were simply not bright enough to see well in the distant universe. But Lee carried out calculations that suggested otherwise.

“I was surprised to find that existing large telescopes should already be able to collect sufficient light from these faint galaxies to map the foreground absorption, albeit at a lower resolution than would be feasible with future telescopes,” said Lee in a news release. “Still, this would provide an unprecedented view of the cosmic web which has never been mapped at such vast distances.”

Lee and his colleagues used the 10-meter Keck I telescope on Mauna Kea, Hawaii to take a look a closer look at the distant galaxies and the forest of hydrogen absorption embedded in their spectra. But even the weather in Hawaii can turn ugly.

“We were pretty disappointed as the weather was terrible and we only managed to collect a few hours of good data,” said coauthor Joseph Hennawi, also from the Max Planck Institute for Astronomy. “But judging by the data quality as it came off the telescope, it was already clear to me that the experiment was going to work.”

The team was only able to collect data for four hours. But it was still unprecedented. They looked at 24 distant galaxies, which provided sufficient coverage of a small patch of the sky and allowed them to combine the information into a three-dimensional map.

The map reveals the large-scale structure of the Universe when it was only a quarter of its current age. But the team hopes to soon parse the map for more information about the structure’s function — following the flows of cosmic gas as it funneled away from voids and onto distant galaxies. It will provide a unique historical record on how the galaxy clusters and voids grew from inhomogeneities in the Big Bang.

The results have been published in the Astrophysical Journal and are available online.