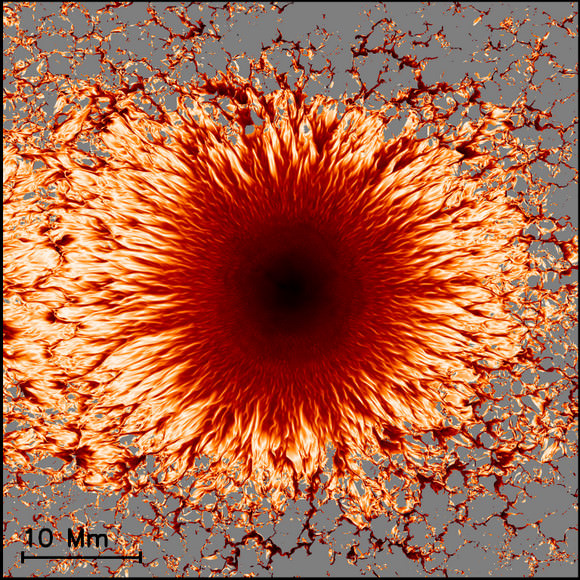
Seriously, I don’t think we should stare at this too long … but for scientists who plan to, this new, high-resolution view of a sunspot stands to unlock secrets of the Sun’s mysterious energetics.
In the just-released image above, the interface between a sunspot’s umbra (dark center) and penumbra (lighter outer region) shows a complex structure with narrow, almost horizontal (lighter to white) filaments embedded in a background having a more vertical (darker to black) magnetic field. Farther out, extended patches of horizontal field dominate. For the first time, scientists have modeled this complex structure in a comprehensive 3D computer simulation, giving scientists their first glimpse below the visible surface.
The international team of scientists, led by the National Center for Atmospheric Research (NCAR) in Boulder, Colorado, say the high-resolution simulations of sunspot pairs open the way for researchers to learn more about the vast, mysterious dark patches on the Sun’s surface. Sunspots are the most striking surface manifestations of solar magnetism, and they are associated with massive ejections of charged plasma that can cause geomagnetic storms and disrupt communications and navigational systems. They also contribute to variations in overall solar output, which can affect weather on Earth and exert a subtle (and as-yet deciphered) influence on climate patterns.
The new research, by scientists at NCAR and the Max Planck Institute for Solar System Research (MPS) in Germany, appears this week in Science Express.
“This is the first time we have a model of an entire sunspot,” says lead author Matthias Rempel, a scientist at NCAR’s High Altitude Observatory. “If you want to understand all the drivers of Earth’s atmospheric system, you have to understand how sunspots emerge and evolve. Our simulations will advance research into the inner workings of the Sun as well as connections between solar output and Earth’s atmosphere.”
Ever since outward flows from the center of sunspots were discovered 100 years ago, scientists have worked toward explaining the complex structure of sunspots, whose number peaks and wanes during the 11-year solar cycle. Sunspots encompass intense magnetic activity that is associated with solar flares and massive ejections of plasma that can buffet Earth’s atmosphere. The resulting damage to power grids, satellites, and other sensitive technological systems takes an economic toll on a rising number of industries.
Creating such detailed simulations would not have been possible even as recently as a few years ago, before the latest generation of supercomputers and a growing array of instruments to observe the Sun. Partly because of such new technology, scientists have already made advances in solving the equations that describe the physics of solar processes.
Greetings, fellow SkyWatchers! You asked for some excitement? You got it. As it the current planetary line up wasn’t treat enough for the weekend, there’s still lots more to go. With dark skies around, we’ll be taking on some challenging studies like faint objects near bright stars… But we won’t be forgetting to chase “Butterflies”! The Celestial Scenery just keeps getting better as the weekend rolls on with a Saturday morning meteor shower. Why not grab coffee and donuts and make a date to watch? The planetary conjunction continues with a close pass on the Pleiades, too. Join the merry-go-round of stars and grab for the “Ring”! Summer Solstice is upon us and there’s no place I’d rather be than out back with you viewing the stars…
Friday, June 19, 2009 – This morning, begin by noting the 1846 birth on this date of Italian astronomer, Antonio Abetti. Although his name might seem a bit obscure, what he studied was not—small planets, comets, and star occultations. This morning your mission is to observe one of the nicest alignments you’ll see this year—the Moon, Venus, and Mars. Look for this beautiful trio on the anniversary of Abetti’s birth about a half-hour before dawn!
Ready tonight for a new direction in observing? Then look no further than the tail of the Scorpion, and get ready to head south, then north. The Summer Milky Way is upon us! Let’s start with a ‘‘bright star and globular cluster’’ view. Some of the easiest studies to find are ones residing in the same field as bright, recognizable stars. And, some the most difficult things to observe in the night sky are—you guessed it—faint studies lying near overwhelmingly bright stars! But there are compromises. . .
Less than 30 east of 3.3-magnitude G Scorpii (the tail star of the Scorpion) is 7.4-magnitude globular cluster NGC 6441 (RA 17 50 12 Dec -37 03 03). This 38,000-light-year-distant compact cluster is about 13,000 light-years from the galactic core. It was first noted from southeastern Australia in 1826 by James Dunlop. Around 2.5 degrees northeast of G Scorpii (and NGC 6441) is another interesting deep-sky twosome—bright open cluster M7 and faint globular NGC6453. M7 (RA 17 53 51 Dec -34 47 34) was first recorded as a glowing region of faint stars by Ptolemy, circa 130 BC.
Located 800 light-years away, the cluster includes more than half a dozen 6th magnitude stars. It is easily resolved with the least amount of optical aid, and as many as 80 stars can be seen in a small telescope. Now head northeast, and the faint haze of the 31,000-light-year-distant globular cluster NGC 6453 (RA 17 50 51 Dec -34 35 59) will reveal itself to mid- and large-sized scopes. Like NGC 6441, this globular was discovered from the Southern Hemisphere, in this case by John Herschel on June 8, 1837, while he was observing from the Cape of Good Hope in South Africa.
Saturday, June 20, 2009 – In the predawn hours, we welcome the ‘‘shooting stars’’ as we pass through another portion of the Ophiuchid meteor stream. The radiant for this pass lies nearer Sagittarius, and the fall rate varies from 8 to 20 per hour, but the Ophiuchids can sometimes produce more than expected! But getting up early to watch a meteor shower has even more perks on this date…
Before day breaks, enjoy the ‘‘Old Moon in the New Moon’s Arm’’ as it heads toward a later occultation of the Pleiades. Look up higher yet and enjoy the fine conjunction of Mars and Venus as they pair together and overhead for the bright visage of Jupiter. Perhaps the sky acknowledges the 1966 passing of Georges Lemaitre on this date? Lemaitre researched cosmic rays and the three-body problem and in 1927 formulated the Big Bang theory using Einstein’s theories.
Tonight locate Lyra’s southernmost pair of stars—Beta and Gamma—for the Ring Nebula (RA 18 53 35 Dec +33 01 42). Discovered by Antoine Darquier in 1779, the Ring was cataloged later that year by Charles Messier as M57. In binoculars, it appears slightly larger than a star, but cannot be focused to a sharp point. Through a modest telescope, and even at low power, M57 turns into a glowing, elongated donut against a wonderful stellar backdrop. How you see the 1,400 light-year distant ‘‘King of the Rings’’ on any given night is highly subject to conditions. As aperture and power increase, so do details. It’s not impossible to see braiding in the nebula’s structure with scopes as small as 8’’ on a fine night, or to pick up the faint 13th magnitude star caught on the edge in even smaller apertures.
Like many planetary nebulae, seeing the central illuminating star is considered the ultimate in celestial viewing. This ‘‘shy friend’’ is a peculiar blue dwarf, which gives off a continuous spectrum and might be variable. At times, this near 15th magnitude star can be seen with ease through a 12.5’’ telescope, yet remains elusive to 31’’ in aperture a few weeks later. Can you spot faint IC 1296, which floats majestically nearby?
Sunday, June 21, 2009 – Wake up, sleepyheads. The last of the very fine conjunctions is about to end and you don’t want to miss it!
If you’re out before dawn, look for Mercury a little more than 6 degrees south of the Moon. No luck spotting it? Try binoculars. Mercury is only about 3 degrees north of red Aldebaran!
Summer solstice occurs today, but what exactly is it? A solstice is nothing more than an astronomical term for the moment when one hemisphere of Earth is tilted the most toward the Sun. Today, the Sun is about 24 degrees above the celestial equator—its highest point of the year. Summer solstice is also the day of the year with the longest period of daylight—and the shortest of night; this occurs around 6 months from now for the Southern Hemisphere.
Today is also the anniversary of the 1863 birth of Maximilian Franz Joseph Cornelius Wolf. Wolf used wide-field photography to study the Milky Way, and statistical treatment of star counts to prove the existence of clouds of dark matter. Wolf was one the first to prove spiral nebulae contained star-like spectra, and he introduced photography to help discover hundreds of asteroids!
Dark skies continue tonight, and so we’ll continue following the great expanse of the Summer Milky Way. Our first stop will be the Butterfly Cluster—M6 (RA 17 40 20 Dec -32 15 15). About the size of the Full Moon, this scattering of 7–12th magnitude stars looks like its namesake. The ‘‘wings’’ of M6 are easily seen as two lobes east and west of the cluster’s main body. Around 75 blue and blue/white stars are visible at low power.
Want more? Head northeast a little more than 1 degree to reveal the expansive, 5.5-magnitude open cluster NGC 6383. Continue to sweep west at low power to find what might be expected as a very faint sheen of stars—9th magnitude NGC 6374. What’s that? You can’t find it? Then you’ve just learned an invaluable lesson. Some things in J.L.E. Dreyer’s catalogue simply don’t exist!
But we exist, don’t we fellow SkyWatchers? You betcha’. And what a terrific weekend we had together!
The week’s awesome images are (in order of appearance): Antonio Abetti (historical image), M7 (credit—Burrell Schmidt/NOAO/AURA/NSF), Georges Lemaitre and Albert Einstein (historical image), M57 and IC 1296 (credit—Palomar Observatory, courtesy of Caltech), Max Wolf (historical image) and M6 (credit—Nigel Sharp, Mark Hanna, REU program/NOAO/AURA/NSF). We thank you all so much!
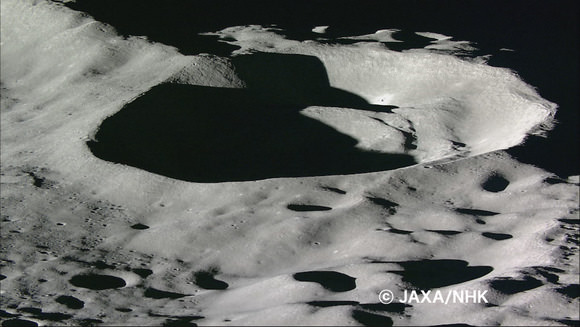
One of the last images taken by Kaguya before it impacted the Moon on June 11, 2009. Credit: JAXA
[/caption]
The Japan Aerospace Exploration Agency (JAXA) has released the final still images taken by the onboard High Definition Television (HDTV) from Kaguya, just before it completed its mission by impacting the moon on June 11, 2009. An entire series of images were taken with an interval of about one minute by the HDTV (Teltephoto) while Kaguya maneuvered its way to impact in Gill Crater.
Here’s a link to a Flash animation showing the images in succession. Click the “up” arrow to proceed through the images.
The last image taken is basically just black as it approached the darkened bottom of the crater. This is the second to the last image taken: Kaguya 2nd to last image. Credit: JAXA
Visible is the surface of the Moon getting closer as Kaguya approached impact.
Kaguya launched on September 14, 2007 and spent nearly two years studying the moon before the planned impact. An Australian telescope observed the controlled crash of Japan’s Kaguya lunar probe into the moon Wednesday, an important warm-up act before a NASA’s LCROSS impactor attempts a similar feat in October. Here’s the series of images from Australia: The image above shows a sequence of four frames around the impact time, with a bright impact flash visible in the second frame, and faintly seen in the third and fourth. Credit: Anglo-Australian Telescope by Jeremy Bailey (University of New South Wales) and Steve Lee (Anglo-Australian Observatory)
Browse through more images taken by the Kaguya HDTV Archives, the JAXA digital archives,, and the JAXA channel on YouTube.
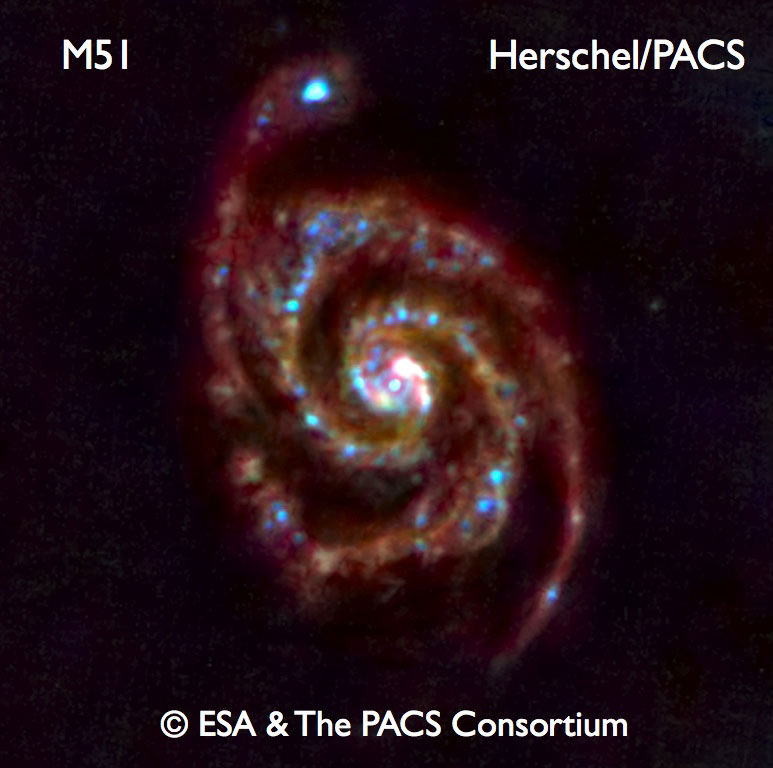
Herschel's view of M51. Credit: ESA & the PACS Consortium
[/caption]
The Herschel Telescope has given us a sneak preview of the infrared observational goodness we can expect from this new space telescope. The protective cryocover was taken off on June 14, and Herschel opened its ‘eyes,’ using the Photoconductor Array Camera and Spectrometer to take a few images of M51, ‘the whirlpool galaxy’ for a first test observation. The telescope obtained images in three colors from the observation, showing this largest of infrared space telescopes ever flown is functioning in fine form. Wonderful!
The above image shows the famous ‘whirlpool galaxy’, first observed by Charles Messier in 1773, who provided the designation Messier 51 (M51). This spiral galaxy lies relatively nearby, about 35 million light-years away, in the constellation Canes Venatici. M51 was the first galaxy discovered to harbor a spiral structure.
The image is a composite of three observations taken at 70, 100 and 160 microns, taken by Herschel’s Photoconductor Array Camera and Spectrometer (PACS) on June 14 and 15. M51 seen by Spitzer (left) and Herschel (right). Credit: ESA
As a comparision, to the left is the best image of M51, taken by NASA’s Spitzer Space Telescope, with the Multiband Imaging Photometer for Spitzer (MIPS), and on the right is Herschel’s observation at 160 microns. The obvious advantage of the larger size of the telescope is clearly reflected in the much higher resolution of the image: Herschel reveals structures that cannot be discerned in the Spitzer image.
And here is Herschel’s glimpse of M51 at 70, 100, 160 microns: M51 Herschel image at 160, 100 and 70 microns: Credit: ESA
So, the shorter the wavelength, the sharper the image, showing the quality of Herschel’s optics.
Thanks, Herschel for a wonderful sneak preview of great images to come!
“Baby, breakdown, go ahead give it to me… Breakdown, honey take me through the night. Breakdown, Im standing here, can you see? Breakdown, it’s all right… It’s all right… It’s all right.”. Oh, hi! Were you watching the IYA Live Telescope today? If you were, then you know that we encountered a real “bug” shortly after we aimed at NGC 6302. That’s right. A bipolar nebula caused our little telescope to go bipolar and blow a gasket. But don’t you worry! Dr. Bert “Can Do” is on the scene and fixing things up again. In the mean time, he did manage to capture some live footage of NGC 6302 before we went down and we’re here to share…
NGC 6302 (also called the Bug Nebula or Butterfly Nebula), is a bipolar planetary nebula in the constellation Scorpius. It is one of the most interesting and complex planetary nebulae observed. The spectrum of NGC 6302 shows its central star is one of the hottest objects in the galaxy, with a surface temperature in excess of 200,000 K, implying that the star from which it formed must have been very large. The central star has never been observed and is surrounded by a particularly dense equatorial disc composed of gas and dust. This dense disc is postulated to have caused the star’s outflows to form a bipolar structure (Gurzadyan 1997), similar to an hour-glass. This bipolar structure shows many interesting features seen in planetary nebulae such as ionization walls, knots and sharp edges to the lobes.
As it is included in the New General Catalogue, this object has been known since at least 1888. The earliest known study of NGC 6302 is Edward Emerson Barnard who, in 1907, drew and described it. (Meaburn et al. 2005). Since then it has been the focus of many works and displays many interesting characteristics worthy of study. Interest in recent years has shifted from discussions over the excitation method in the nebula (shock-excitation or photo-ionisation) to the properties of the large dust component.
NGC 6302 has a complex morphology which may be approximated as bipolar with two primary lobes, though there is evidence for a second pair of lobes that may have belonged to a previous phase of mass loss A dark lane runs through the waist of the PN obscuring the central star at all wavelengths. Observations of NGC 6302 suggest that there may be an orthogonal skirt (or chakram) similar to that found in Menzel 3. (Meaburn et al. 2005). The nebula is orientated at an angle of 12.8° against the plane of the sky.
This PN contains a prominent North-West lobe which extends up to 3?.0 away from the central star and is estimated to have formed from an eruptive event around 1,900 years ago. It has a circular part whose walls precisely follow a Hubble-type outflow (where outflow speed is proportional to distance from the central source). At an angular distance of 1?.71 from the central star, the flow velocity of this lobe is measured to be 263 km/s. At the extreme periphery of the lobe, the outward velocity exceeds 600 km/s. The western edge of the lobe displays characteristics suggestive of a collision with pre-existing globules of gas which modified the outflow in that region. (Meaburn et al. 2005)
The prominent dark lane that runs through the centre of the nebula has been shown to have an extraordinary dust chemistry, showing evidence for multiple crystalline silicates and features that have been interpreted by some to be the first extra-solar detection of carbonates. This detection has been disputed, due to the difficulties in forming carbonates in a non-aqueous environment. Other solid state features detected include crystalline water ice and quartz.
One of the most interesting characteristics of the dust detected in NGC 6302 is the existence of both oxygen-rich (i.e. silicates) and carbon-rich (i.e. poly-aromatic-hydrocarbons or PAHs) material. Stars are usually either O-rich or C-rich, the change from the former to the latter occurring late in the evolution of the star due to nuclear and chemical changes in the star’s atmosphere. When a star or nebula is observed to have a dual chemistry it is indicative of a recent change from O-rich chemistry to C-rich chemistry.
Look for the IYA Live Telescope to be up and running again soon, so keep on checking the link to the right and we’ll see you when skies are clear and dark in central Victoria! Ciao for now…
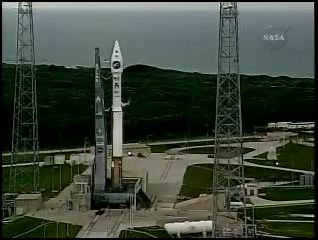
Liftoff! A patient launch control team waited out stormy weather on Thursday, and finally were able to give a green light for the last launch opportunity of the day for the Atlas rocket carrying the Lunar Reconnaissance Orbiter (LRO) and Lunar Crater Observation and Sensing Satellite (LCROSS). The duo lifted off at 21:42 pm GMT (5:32 pm EDT), climbing through some impressive looking clouds and quickly heading to space. For more information about the missions, see our LRO/LCROSS preview article. View the video of the launch, above, and using the wonders of NASA TV on the web and my image clipping tool here are more pictures from the launch:
Here are a few pre-launch images:
[/caption]
Credit: NASA TV
Shortly after liftoff with the launch complex visible below: Credit: NASA TV
View from the spacecraft heading up through the clouds.
Credit: NASA TV
The curvature of Earth and the blackness of space visible from this image taken by cameras on the spacecraft. Credit: NASA TV
As of this writing, all systems are in good shape.
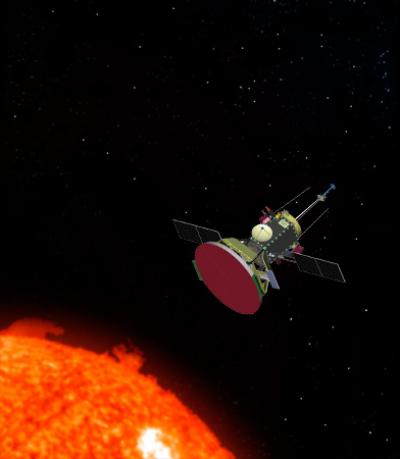
Solar Probe Spacecraft. Credit: NASA/Johns Hopkins University Applied Physics Laboratory
Astronomy is a complex field that has slowly evolved to encompass several disciplines. An astronomer can not solely be a science person, they have to be techno-savvy, well written, and able to communicate well verbally. An astronomer has to be able to compel with empirical data and convincing verbage.
Here are a few facts about astronomy followed by a long list of links to as much information as you can handle on the topic.
Ancient astronomy was more of a branch of philosophy than real science. Astronomers had no way to directly observe any celestial bodies in detail, so had to make best guesses and then convince everyone else that they were right.
Before Copernicus came on the scene, astronomers believed that the Earth was the center of the Universe, the Sun and the ‘four’ planets orbited around it in a series of complex movements.
Did you know that despite the advent of space telescopes and launching many space probes, we have only observed a minor fraction of the known Universe? That doesn’t even take into account the Universe that we have no knowledge of at this time.
In the links below you will find a great deal of information about astronomy: some of the terminology used, images, and different discoveries made in the field. Hopefully, what you read will inspire you to delve even more deeply into the vastness of space.
Planets and other objects in our Solar System. Credit: NASA.
Mercury is the closest planet to the Sun but not the hottest. That distinction goes to Venus. The planet was named after the Roman messenger of the gods because it orbits the Sun so quickly. Mercury is a small, grayish planet that is often said to resemble the Earth’s Moon.
Venus, the second planet from the Sun, is the hottest planet because its atmosphere tends to trap heat. Named after the Roman goddess of beauty, Venus is the brightest planet. In fact, the only celestial body that is brighter is the Moon. Venus is around the same size as Earth with similar gravity, causing it to be referred to as Earth’s twin.
Earth is the third planet from the Sun. It is the only planet where life has been confirmed to exist. Roughly two-thirds of Earth’s surface is covered with oceans, and so far Earth is the only place where liquid water is known to exist.
Mars was named after the Roman god of war because of its red color, which is caused by rust in the rocks on the surface. Since it is the closest planet to Earth, people have long wondered if life could exist on Mars. Although no life has been discovered so far, some people still think that there may be life on Mars.
Jupiter, a gas giant, is the largest planet in this solar system. It was named after the Roman king of the gods, probably because of its size. Jupiter has 63 moons, one of which, Ganymede, is the solar system’s largest moon. Jupiter is also home to an enormous storm, the Great Red Spot, which has been raging for over two hundred years.
Saturn, the sixth planet from the sun, was named after the Roman god of agriculture and harvest, Saturnus. It is also a gas giant and therefore does not have a solid surface. One distinctive feature of the planet is its rings, which are composed of small pieces of rock and ice.
Uranus, the third largest planet, is also a gas giant. One interesting fact is that its moons were named after characters from works of literature by Shakespeare and Alexander Pope. Uranus orbits very slowly; it takes the planet 84 years to circle the sun.
Neptune is the furthest planet from the Sun. It was named after the Roman god of the sea; this is not surprising because it is bright blue, reminding one of a beautiful ocean. Neptune has four rings, although they are difficult to see. When Pluto was reclassified as a dwarf planet, Neptune became the eighth and last planet in the solar system.
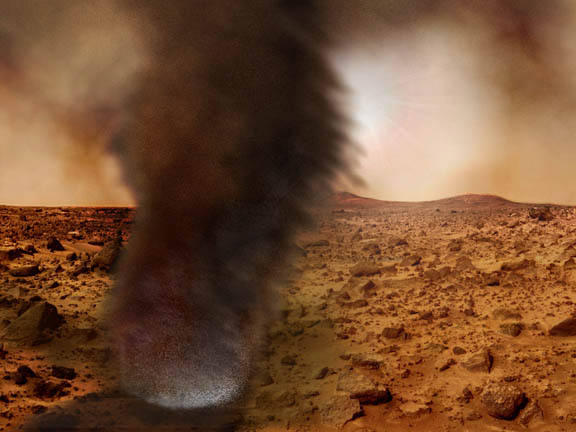
An illustration of a dust storm on Mars. Credit: Brian Grimm and Nilton Renno
[/caption]
The first direct evidence of lightning has been detected on Mars. Researchers from the University of Michigan found signs of electrical discharges during dust storms on the red planet using an innovative microwave detector . The bolts were dry lightning, said Professor Chris Ruf. “What we saw on Mars was a series of huge and sudden electrical discharges caused by a large dust storm. Clearly, there was no rain associated with the electrical discharges on Mars. However, the implied possibilities are exciting.”
The Space Physics Research Laboratory at the University of Michigan developed the kurtosis detector, which is capable of differentiating between thermal and non-thermal radiation. The device took measurements of microwave emissions from Mars for approximately five hours a day for 12 days between May 22 and June 16, 2006.
On June 8, 2006 both an unusual pattern of non-thermal radiation and an intense Martian dust storm occurred, the only time that non-thermal radiation was detected. Non-thermal radiation would suggest the presence of lightning.
Electric activity in Martian dust storms has important implications for Mars science, the researchers said.
“It affects atmospheric chemistry, habitability and preparations for human exploration. It might even have implications for the origin of life, as suggested by experiments in the 1950s,” said Professor Nilton Renno of the university’s Department of Atmospheric, Oceanic and Space Sciences.
“Mars continues to amaze us,” said Michael Sanders, manager of exploration systems and technology at the National Aeronautics and Space Administration’s Jet Propulsion Laboratory and a researcher involved in the study. “Every new look at the planet gives us new insights.”
The new findings are to appear in an upcoming issue of the journal Geophysical Research Letters.
[/caption]
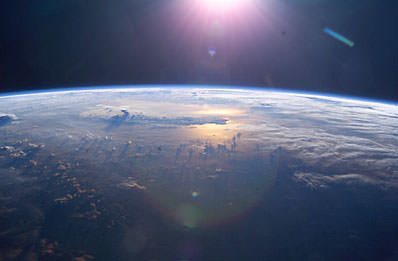
Researchers have been able to determine the atmospheric carbon dioxide levels over the past 2.1 million years in the sharpest detail yet by analyzing the shells of single–celled plankton. Their findings shed new light on CO2’s role in the earth’s cycles of cooling and warming, confirming many researchers’ suspicions that higher carbon dioxide levels coincided with warmer intervals during the study period. But it also rules out a drop in CO2 as the cause for earth’s ice ages growing longer and more intense some 850,000 years ago.
The study, published in the June 19 issue of the journal Science shows that peak CO2 levels over the last 2.1 million years averaged only 280 parts per million; but today, CO2 is at 385 parts per million, or 38% higher. This finding means that researchers will need to look back further in time for an analog to modern day climate change. Bärbel Hönisch diving for plankton in an early phase of the study. Credit: Steve Doo
In the study, Bärbel Hönisch, a geochemist at Lamont-Doherty Earth Observatory, and her colleagues reconstructed CO2 levels by analyzing the shells of single-celled plankton buried under the Atlantic Ocean, off the coast of Africa. By dating the shells and measuring their ratio of boron isotopes, they were able to estimate how much CO2 was in the air when the plankton were alive. This method allowed them to see further back than the precision records preserved in cores of polar ice, which go back only 800,000 years.
Around 850,000 years ago, the climate cycles on Earth switched from being dominated by 40,000 year cycles, to the stronger 100,000 year cycles of the more recent times. The time period from 800 – 1,000 kyr ago is called the mid-Pleistocene transition, and since the rhythms of the Earth’s orbit didn’t change, some scientists have attributed that shift to falling CO2 levels. But the study found that CO2 was flat during this transition and unlikely to have triggered the change.
“Previous studies indicated that CO2 did not change much over the past 20 million years, but the resolution wasn’t high enough to be definitive,” said Hönisch. “This study tells us that CO2 was not the main trigger, though our data continues to suggest that greenhouse gases and global climate are intimately linked.”
The timing of the ice ages is believed to be controlled mainly by the earth’s orbit and tilt, which determines how much sunlight falls on each hemisphere. Two million years ago, the earth underwent an ice age every 41,000 years. But some time around 850,000 years ago, the cycle grew to 100,000 years, and ice sheets reached greater extents than they had in several million years—a change too great to be explained by orbital variation alone. Barbel Honisch with a mass spectrometer used to measure boron isotopes to reconstruct past CO2. Credit: Lamont-Doherty Earth Observatory
A global drawdown in CO2 is just one theory proposed for the transition. A second theory suggests that advancing glaciers in North America stripped away soil in Canada, causing thicker, longer lasting ice to build up on the remaining bedrock. A third theory challenges how the cycles are counted, and questions whether a transition happened at all.
The low carbon dioxide levels outlined by the study through the last 2.1 million years make modern day levels, caused by industrialization, seem even more anomalous, says Richard Alley, a glaciologist at Pennsylvania State University, who was not involved in the research.
“We know from looking at much older climate records that large and rapid increase in C02 in the past, (about 55 million years ago) caused large extinction in bottom-dwelling ocean creatures, and dissolved a lot of shells as the ocean became acidic,” he said. “We’re heading in that direction now.”
The idea to approximate past carbon dioxide levels using boron, an element released by erupting volcanoes and used in household soap, was pioneered over the last decade by the paper’s coauthor Gary Hemming, a researcher at Lamont-Doherty and Queens College. The study’s other authors are Jerry McManus, also at Lamont; David Archer at the University of Chicago; and Mark Siddall, at the University of Bristol, UK.


 and Steve Lee (Anglo-Australian Observatory)")
 and Herschel (right). Credit: ESA")