IYA (Almost) Live Telescope!

Greetings! In case you weren’t tuned into Galactic TV yesterday… We had us a regular skyfest! Truly pristine dark skies ruled and the IYA “Live” telescope rocked the Aussie night away. For more than 8 hours we went from target to target – and loved every minute of it. While we could have done a lot more than four objects, allowing you time to enjoy them is a worthwhile effort, too. While I’d ordinarily spread this over a couple of days I’m going to post all our objects – M2, M41, M93 and M46 – right now because I’m outta’ here for the Hidden Hollow Star Party. Want to party at your end? Then check out information on our iPhone Galactic TV Weekend Marathon! Enjoy!!

Messier 2 or M2 (also designated NGC 7089) is a globular cluster in the constellation Aquarius, five degrees north of the star Beta Aquarii. It was discovered by Jean-Dominique Maraldi in 1746 and is one of the largest known globular clusters.

M2 was discovered by the French astronomer Jean-Dominique Maraldi in 1746 while observing a comet with Jacques Cassini. Charles Messier rediscovered it in 1760 but thought it a nebula without any stars associated with it. William Herschel was the first to resolve individual stars in the cluster, in 1794. M2 is, under extremely good conditions, just visible to the naked eye. Binoculars or small telescopes will identify this cluster as non-stellar while larger telescopes will resolve individual stars, of which the brightest are of apparent magnitude 13.1.

M2 is about 37,500 light-years away from Earth. At 175 light-years in diameter, it is one of the larger globular clusters known. The cluster is rich, compact, and significantly elliptical. It is 13 billion years old and one of the older globulars associated with the Milky Way Galaxy. M2 contains about 150,000 stars, including 21 known variable stars. Its brightest stars are red and yellow giants. The overall spectral type is F4.

Messier 41 (also known as M41 or NGC 2287) is an open cluster in the Canis Major constellation. It was discovered by Giovanni Batista Hodierna before 1654 and was perhaps known to Aristotle about 325 BC.

M41 lies about four degrees almost exactly south of Sirius. It contains about 100 stars including several red giants, the brightest being a spectral type K3 giant near the cluster’s center. The cluster is estimated to be moving away from us at 23.3 km/s. The diameter of the cluster is between 25 and 26 light years. Its age is estimated at between 190 and 240 million years old. M41 is also referred to as NGC 2287.

Messier 93 (also known as M 93 or NGC 2447) is an open cluster in the constellation Puppis. It was discovered by Charles Messier in 1781.

M93 is at a distance of about 3,600 light years from Earth and has a spatial radius of some 10 to 12 light years. Its age is estimated at some 100 million years.

Messier 46 (also known as M 46 or NGC 2437) is an open cluster in the constellation of Puppis. It was discovered by Charles Messier in 1771. Dreyer described it as “very bright, very rich, very large.” M46 is about 5,500 light-years away with an estimated age on the order of several 100 million years.

The planetary nebula NGC 2438 appears to lie within the cluster near its northern edge, but it is most likely unrelated since it does not share the cluster’s radial velocity. The case is yet another example of a superposed pair, joining the famed case of NGC 2818.

M46 is about a degree east of M47 in the sky, so the two fit well in a binocular or wide-angle telescope field.

If you had fun with this, then make sure to tune into your TVU Channel Number 79924 on your iPhone for a weekend marathon of all the best of our IYA Live Telescope! Wishing you all clear skies and a great weekend….

Factual information courtesy of Wikipedia.

Planck First Light

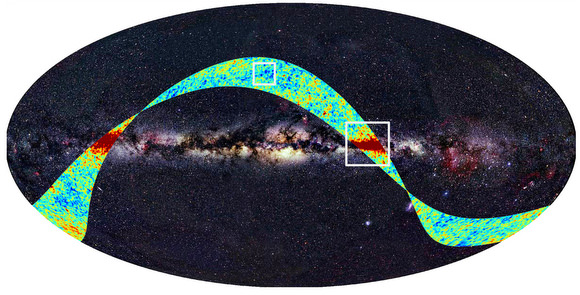
Strips of the sky measured by Planck. Credit: ESA

[/caption]
One of the newest telescopes in space, the Planck spacecraft, recently completed its “first light” survey which began on August 13. Astronomers say the initial data, gathered from Planck’s vantage point at the L2 point in space, is excellent. Planck is studying the Cosmic Microwave Background, looking for variations in temperature that are about a million times smaller than one degree. This is comparable to measuring from Earth the body heat of a rabbit sitting on the Moon.

The initial survey yielded maps of a strip of the sky, one for each of Planck’s nine frequencies. Each map is a ring, about 15° wide, stretching across the full sky.

The the differences in color in the strips indicate the magnitude of the deviations of the temperature of the Cosmic Microwave Background from its average value, as measured by Planck at a frequency close to the peak of the CMB spectrum (red is hotter and blue is colder).

The large red strips trace radio emission from the Milky Way, whereas the small bright spots high above the galactic plane correspond to emission from the Cosmic Microwave Background itself.

In order to do its work, Planck’s detectors must be cooled to extremely low temperatures, some of them being very close to absolute zero (–273.15°C, or zero Kelvin, 0K).

Routine operations are now underway, and surveying will continue for at least 15 months without a break. In approximately 6 months, the first all-sky map will be assembled.

Within its projected operational life of 15 months, Planck will gather data for two complete sky maps. To fully exploit the high sensitivity of Planck, the data will require delicate adjustments and careful analysis. It promises to return a treasure trove that will keep both cosmologists and astrophysicists busy for decades to come.

Source: ESA

A New “Drake” Equation for Potential of Life

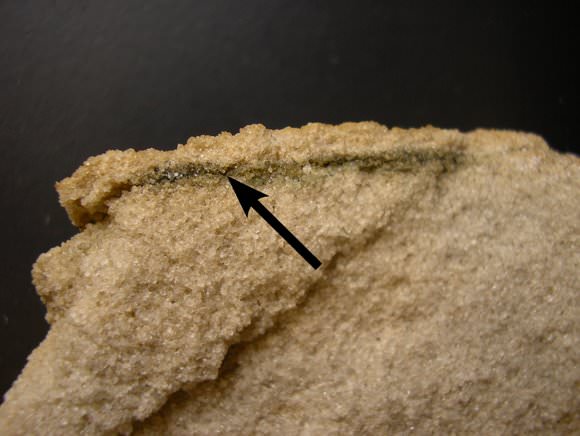
An image showing microbes living in sandstone in Antarctica (credit: C Cockell)

[/caption]
The famed Drake equation estimates the number of technologically advanced civilizations that might exist in our Galaxy. But is there a way to mathematically quantify a habitat’s potential for hosting life?
“At present, there is no easy way of directly comparing the suitability of different environments as a habitat for life” said Dr. Axel Hagermann, who is proposing a method to find a “habitability index” at the European Planetary Science Congress.

“The classical definition of a habitable environment,” said Hagermann, “is one that has the presence of a solvent, for example water, availability of the raw materials for life, clement conditions and some kind of energy source, so we tend to define a place as ‘habitable’ if it falls into the area where these criteria overlap on a Venn diagram. This is fine for specific instances, but it gives us no quantifiable way of comparing exactly how habitable one environment is in comparison with another, which I think is very important.”
Drake Equation
Hagermann and colleague Charles Cockell have the ambitious aim of developing a single, normalized indicator of habitability, mathematically describing all the variables of each of the four habitability criteria. Initially, they are focusing on describing all the qualities of an energy source that may help or hinder the development of life.

“Electromagnetic radiation may seem simple to quantify in terms of wavelengths and joules, but there are many things to consider in terms of habitability,” Hagermann said. “For instance, while visible and infrared wavelengths are important for life and processes such as photosynthesis, ultraviolet and X-rays are harmful. If you can imagine a planet with a thin atmosphere that lets through some of this harmful radiation, there must be a certain depth in the soil where the ‘bad’ radiation has been absorbed but the ‘good’ radiation can penetrate. We are looking to be able to define this optimal habitable region in a way that we can say that it is ‘as habitable’ or ‘less habitable’ than a desert in Morocco, for example.”

The pair will be presenting their initial study and asking for feedback from colleagues at the European Planetary Science Congress. “There may be good reasons why such a habitability index is not going to work and, with so many variables to consider, it is not going to be an easy task to develop. However, this kind of index has the potential to be an invaluable tool as we begin to understand more about the conditions needed for life to evolve and we find more locations in our Solar System and beyond that might be habitable.”

Source: Europlanet

This Week’s Where In The Universe Challenge

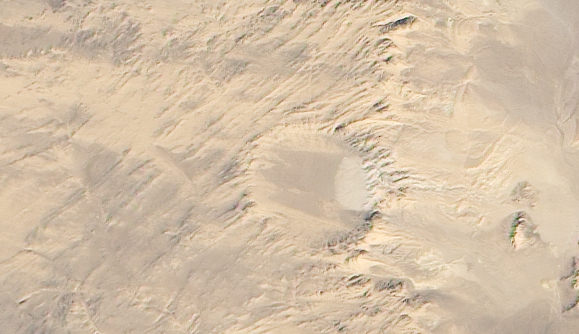
Here’s this week’s image for the WITU Challenge, to test your visual knowledge of the cosmos. You know what to do: take a look at this image and see if you can determine where in the universe this image is from; give yourself extra points if you can name the spacecraft responsible for the image. We’ll provide the image today, but won’t reveal the answer until tomorrow. This gives you a chance to mull over the image and provide your answer/guess in the comment section. Please, no links or extensive explanations of what you think this is — give everyone the chance to guess.

UPDATE: The answer has been posted below.

The location of this feature sounds like it could be on the Klingon homeworld, but this is actually a crater on Earth. You can find it in southeastern Mongolia, roughly halfway between Ulaanbaatar and Beijing. It is an ancient crater, called Tabun Khara Obo. This recent image was taken by the Advanced Land Imager (ALI) on NASA’s Earth Observing-1 (EO-1) satellite, acquired August 28, 2009. The crater was first identified as a probable impact crater in 1976, although confirmation of the hypothesis only occurred decades later. Drilling at the site in 2008 revealed rock features consistent with high-speed impacts such as those caused by meteorites.

A few of you had Qapla’ in answering this one. SoH ‘oH intelligent.

Find out more about this image as NASA’s Earth Observatory website, and check back next week for another WITU Challenge!

Composite Volcano

Mount Fuji - a composite volcano

[/caption]
Geologists have identified 3 major types of volcanoes. There’s the shield volcano, formed from low viscosity lava that can flow long distances. There are cinder cone volcanoes, which are made by the eruption of lava, ash and rocks that build up around a volcanic vent. But the last type is the composite volcano, and these are some of the most famous volcanoes (and most dangerous) in the world.

A composite volcano is formed over hundreds of thousands of years through multiple eruptions. The eruptions build up the composite volcano, layer upon layer until it towers thousands of meters tall. Some layers might be formed from lava, while others might be ash, rock and pyroclastic flows. A composite volcano can also build up large quantities of thick magma, which blocks up inside the volcano, and causes it to detonate in a volcanic explosion.

Composite volcanoes are fed by a conduit system which taps into a reservoir of magma deep within the Earth. This magma can erupt out of several vents across the composite volcano’s flanks, or from a large central crater at the summit of the volcano.

Some of the most famous volcanoes in the world are composite volcanoes. And some of the most devastating eruptions in history came from them. For example, Mount St. Helens, Mount Pinatubo, and Krakatoa are just examples of composite volcanoes that have erupted. Famous landmarks like Mount Fuji in Japan, Mount Ranier in Washington State, and Mount Kilimanjaro in Africa are composite volcanoes that just haven’t erupted recently.

When large composite volcanoes explode, they can leave behind a collapsed region called a caldera. These are deep, steep-walled depressions which marked the location of the volcano. And it’s in this region that a new composite volcano will build back up again.

Another name for composite volcanoes are stratovolcanoes.

We have written many articles about composite volcanoes for Universe Today. Here’s an article about the recent eruption of Mount Redoubt in Alaska, and here’s an article about Mount Etna.

You can learn more about composite volcanoes from the USGS.

And we have recorded an entire episode of Astronomy Cast just about volcanoes. Listen to it here, Episode 141: Volcanoes, Hot and Cold.

Who Discovered Jupiter?

Jupiter from the newly refurbished Hubble. Credit: NASA, ESA, M. Wong (Space Telescope Science Institute, Baltimore, Md.), H. B. Hammel (Space Science Institute, Boulder, Colo.), and the Jupiter Impact Team

[/caption]
Jupiter is one of the 5 planets visible with the unaided eye. That means you can go out on a clear night, when Jupiter is up in the sky, and see it with your own eyes. No telescope is necessary. In fact, it’s one of the brightest objects in the sky. When Jupiter is there, it’s hard not to see it. So it’s kind of hard to wonder who discovered Jupiter, since humans would have known about it for tens of thousands of years.

Ancient astronomers didn’t have telescopes, but they knew there was something strange about the planets. They tracked the motion of the planets with incredible accuracy and believed that they were somehow associated with gods in their mythologies. Jupiter is named after the Roman god, thought to be the head of the gods; he’s the same as Zeus in Greek mythology.

Perhaps a better question might be, who discovered Jupiter the planet. In other words, when did astronomers realize that Jupiter was really a planet. That discovery happened when astronomers realized that the Earth was really just a planet as well, orbiting the Sun in the Solar System. The new model for the Solar System was developed by Nicolaus Copernicus in the 16th century. By placing the Sun at the center of the Solar System, Copernicus developed a model that better explained the motions of the planets as they moved through the sky.

This model was confirmed when Galileo pointed his first rudimentary telescope at Jupiter. What he saw was the disk of Jupiter and the 4 largest moons orbiting the planet. Since all the heavenly bodies were thought to orbit the Earth, it was thought to be impossible for objects to orbit one another.

Once astronomers knew that Jupiter was a planet, and they had better telescopes to study it, the exploration of Jupiter could really begin. Better and better images were taken of the planet, and more moons and even rings were discovered orbiting the planet.

And then in the space age, the first spacecraft were sent to explore Jupiter. The first spacecraft to arrive at Jupiter was NASA’s Pioneer 10 in 1973, followed by Pioneer 11 a few months later. These spacecraft returned images of Jupiter’s swirling cloud tops, discovered more about its composition, and revealed features of its moons.

We have written many articles about the discovery of planets in the Solar System. Here’s an article about the discovery of Uranus, and another about the discovery of Neptune.

You can also learn more about Jupiter from NASA’s Solar System Exploration Guide to Jupiter.

We have also recorded an episode of Astronomy Cast all about Jupiter. Listen to it here, Episode 56: Jupiter.

Reference:
NASA

Best Ever View of Andromeda in Ultraviolet

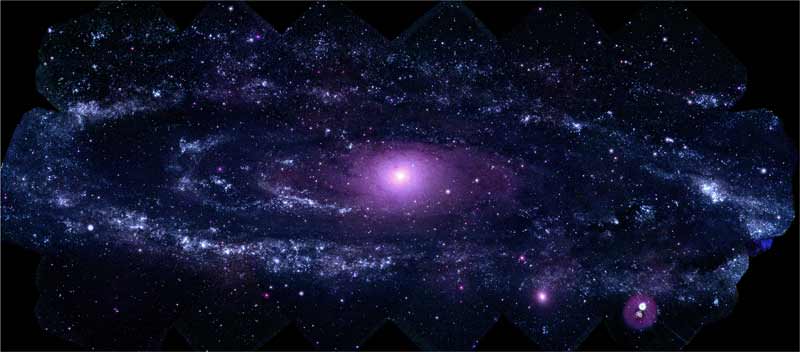
Andromeda by the Swift Telescope. Credit: NASA/Swift/Stefan Immler (GSFC) and Erin Grand (UMCP)

[/caption]
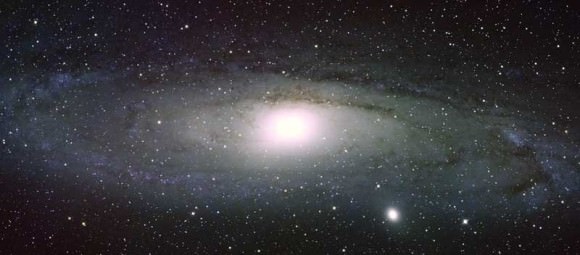
Normally, the Swift satellite is searching for distant cosmic explosions. But recently it took some time to take a long look (total exposure time: 24 hours) with its ultraviolet eyes at the Andromeda galaxy, a.k.a. M31. The result is this gorgeous image. “Swift reveals about 20,000 ultraviolet sources in M31, especially hot, young stars and dense star clusters,” said Stefan Immler, a research scientist on the Swift team at NASA’s Goddard Space Flight Center. “Of particular importance is that we have covered the galaxy in three ultraviolet filters. That will let us study M31’s star-formation processes in much greater detail than previously possible.”

Compare this image to an optical version taken by a ground-based telescope:

Andromeda.  Credit: Bill Schoening, Vanessa Harvey/REU program/NOAO/AURA/NSF
Andromeda. Credit: Bill Schoening, Vanessa Harvey/REU program/NOAO/AURA/NSF

M31, also known as the Andromeda Galaxy, is more than 220,000 light-years across and lies 2.5 million light-years away. On a clear, dark night, the galaxy is faintly visible as a misty patch to the naked eye.

Between May 25 and July 26, 2008, Swift’s Ultraviolet/Optical Telescope (UVOT) acquired 330 images of M31 at wavelengths of 192.8, 224.6, and 260 nanometers.

“Swift is surveying nearby galaxies like M31 so astronomers can better understand star- formation conditions and relate them to conditions in the distant galaxies where we see gamma-ray bursts occurring,” said Neil Gehrels, the mission’s principal investigator. Since Swift’s November 2005 launch, the satellite has detected more than 400 gamma-ray bursts — massive, far-off explosions likely associated with the births of black holes.

For more info on this image see this page from NASA. There’s also a podcast from Swift about this image, as well.

Exosphere

Exosphere

[/caption]
The Earth’s atmosphere is broken up into several distinct layers. We live down in the troposphere, where the atmosphere is thickest. Above that is the stratosphere, then there’s the mesosphere, thermosphere and finally the exosphere. The top of the exosphere marks the line between the Earth’s atmosphere and interplanetary space.

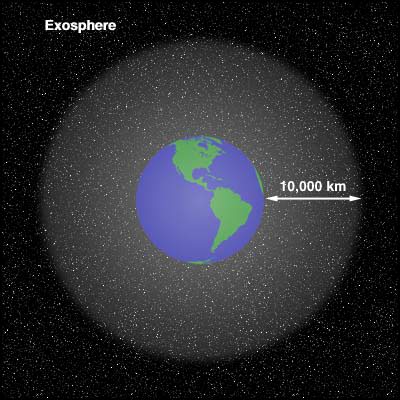
The exosphere is the outermost layer of the Earth’s atmosphere. It starts at an altitude of about 500 km and goes out to about 10,000 km. Within this region particles of atmosphere can travel for hundreds of kilometers in a ballistic trajectory before bumping into any other particles of the atmosphere. Particles escape out of the exosphere into deep space.

The lower boundary of the exosphere, where it interacts with the thermosphere is called the thermopause. It starts at an altitude of about 250-500 km, but its height depends on the amount of solar activity. Below the thermopause, particles of the atmosphere have atomic collisions, like what you might find in a balloon. But above the thermopause, this switches over to purely ballistic collisions.

The theoretical top boundary of the exosphere is 190,000 km (half way to the Moon). This is the point at which the solar radiation coming from the Sun overcomes the Earth’s gravitational pull on the atmospheric particles. This has been detected to about 100,000 km from the surface of the Earth. Most scientists consider 10,000 km to be the official boundary between the Earth’s atmosphere and interplanetary space.

We have written several articles about the Earth’s atmosphere for Universe Today. Here’s an article about an evaporating extrasolar planet, and this article explains how far away space is.

You can learn more about the layers of the atmosphere, including the exosphere from this page at NASA.

We have recorded a whole episode of Astronomy Cast talking about the Earth’s (and it’s atmosphere). Check it out here, Episode 51: Earth.

Phoenix’s Telltale Tells All About Winds and Weather on Mars

The Telltale instrument on the Phoenix lander. Credit: University of Aarhus.

[/caption]
On board the plucky little Phoenix Mars lander was an even pluckier and littler device called the Telltale. It measured, for the first time, wind speeds and directions at the Mars polar region. Scientists have now been able to summarize the results from the Telltale, and presented their findings at the European Planetary Science Conference in Potsdam, Germany. They shared some unexpected new findings about the weather on Mars.

“Telltale has given us a wealth of information about the local Martian wind velocities and directions. At the Phoenix landing site, we were able to see meteorological changes caused by interactions between the dynamic north pole, where there are ever changing evaporation processes, and the Martian atmosphere,” said Dr. Haraldur Gunnlaugsson.

Artists rendition of Phoenix on Mars. Credit: NASA/JPL

As you recall, Phoenix landed in the North polar region of Mars on May 25, 2008 and operated successfully for about 5 Earth months, or 151 Martian sols. The Telltale device consisted of a lightweight tube suspended on top of a meteorological mast, roughly two meters above the local surface. The device had to be sensitive enough to detect very light breezes, but also be able to withstand the violent vibrations during the mission launch. After landing on Mars, Phoenix’s onboard camera continuously imaged the deflection of the tube in the wind, taking more than 7,500 images during the mission.

The astronomers/meteorologists found the wind speeds and directions varied as the seasons changed. Easterly winds of approximately 15-20 kilometers per hour prevailed during the Martian mid-summer, but when autumn approached, the winds increased and switched to come predominantly from the West. While these winds appeared to be dominated by turbulence, the highest wind speeds recorded of up to nearly 60 kilometers per hour coincided with the passing of weather systems, when also the number of dust devils increased by an order of magnitude.

Mars is typically a rather windy place and learning more about the planet’s climatic conditions will contribute to the understanding of the Martian water cycle and the identification of areas on the red planet that could sustain life. Local wind measurements by the Telltale instrument, amended with daily images of the whole northern hemisphere by the Mars Reconnaissance Orbiter spacecraft, have allowed astronomers to gain much deeper information on weather systems on Mars.

“We’ve seen some unexpected night-time temperature fluctuations and are starting to understand the possible ways dust is put into suspension in the Martian atmosphere. For example, we could see that some of the dust storms on Mars do not require the existence of high winds,” said Dr Gunnlaugsson.

Source: Europlanet

What! No Parallel Universe? Cosmic Cold Spot Just Data Artifact

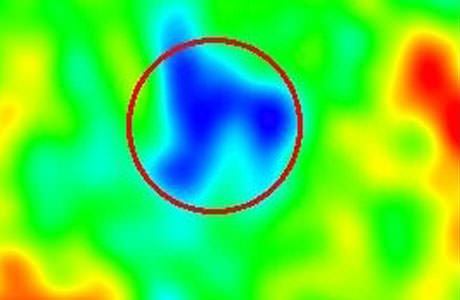
Region in space detected by WMAP cooler than its surroundings. But not really. Rudnick/NRAO/AUI/NSF, NASA.

Rats! Another perplexing space mystery solved by science. New analysis of the famous “cold spot” in the cosmic microwave background reveals, and confirms, actually, that the spot is just an artifact of the statistical methods used to find it. That means there is no supervoid lurking in the CMB, and no parallel universe lying just beyond the edge of our own. What fun is that?

Back in 2004, astronomers studying data from the Wilkinson Microwave Anisotropy Probe (WMAP) found a region of the cosmic microwave background in the southern hemisphere in the direction of the constellation of Eridanus that was significantly colder than the rest by about 70 microkelvin. The probability of finding something like that was extremely low. If the Universe really is homogeneous and isotropic, then all points in space ought to experience the same physical development, and appear the same. This just wasn’t supposed to be there.

Some astronomers suggested the spot could be a supervoid, a remnant of an early phase transition in the universe. Others theorized it was a window into a parallel universe.

Well, it turns out, it wasn’t there.

Ray Zhang and Dragan Huterer at the University of Michigan in Ann Arbor say that the cold spot is simply an artifact of the statistical method–called Spherical Mexican Hat Wavelets–used to analyze the WMAP data. Use a different method of analysis and the cold spot disappears (or at least is no colder than expected).

“We trace this apparent discrepancy to the fact that WMAP cold spot’s temperature profile just happens to favor the particular profile given by the wavelet,” the duo says in their paper. “We find no compelling evidence for the anomalously cold spot in WMAP at scales between 2 and 8 degrees.”

This confirms another paper from 2008 also by Huterer along with colleague Kendrick Smith from the University of Cambridge who showed that the huge void could be considered as a statistical fluke because it had stars both in front of and behind it.

And in fact, one of the earlier papers suggesting the cold spot by Lawrence Rudnick from the University of Minnesota does indeed say that statistical uncertainties have not been accounted for.

Oh well. Now, on to the next cosmological mysteries like dark matter and dark energy!

Zhang and Huterer’s paper.

Huterer and Smith’s paper (2008)

Rudnick’s paper 2007

Original paper “finding” the cold spot

Sources: Technology Review Blog, Science