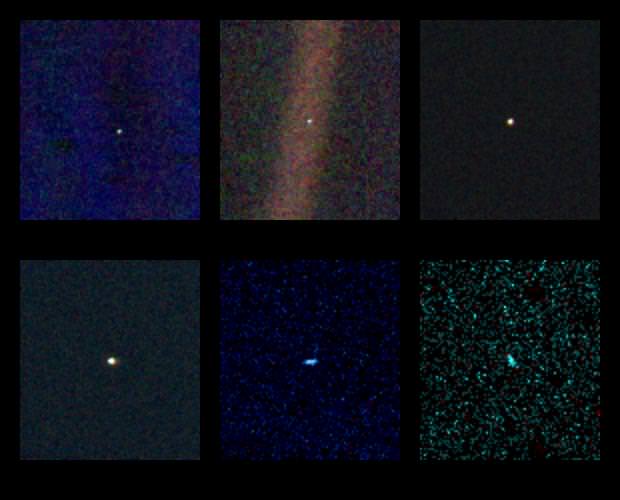
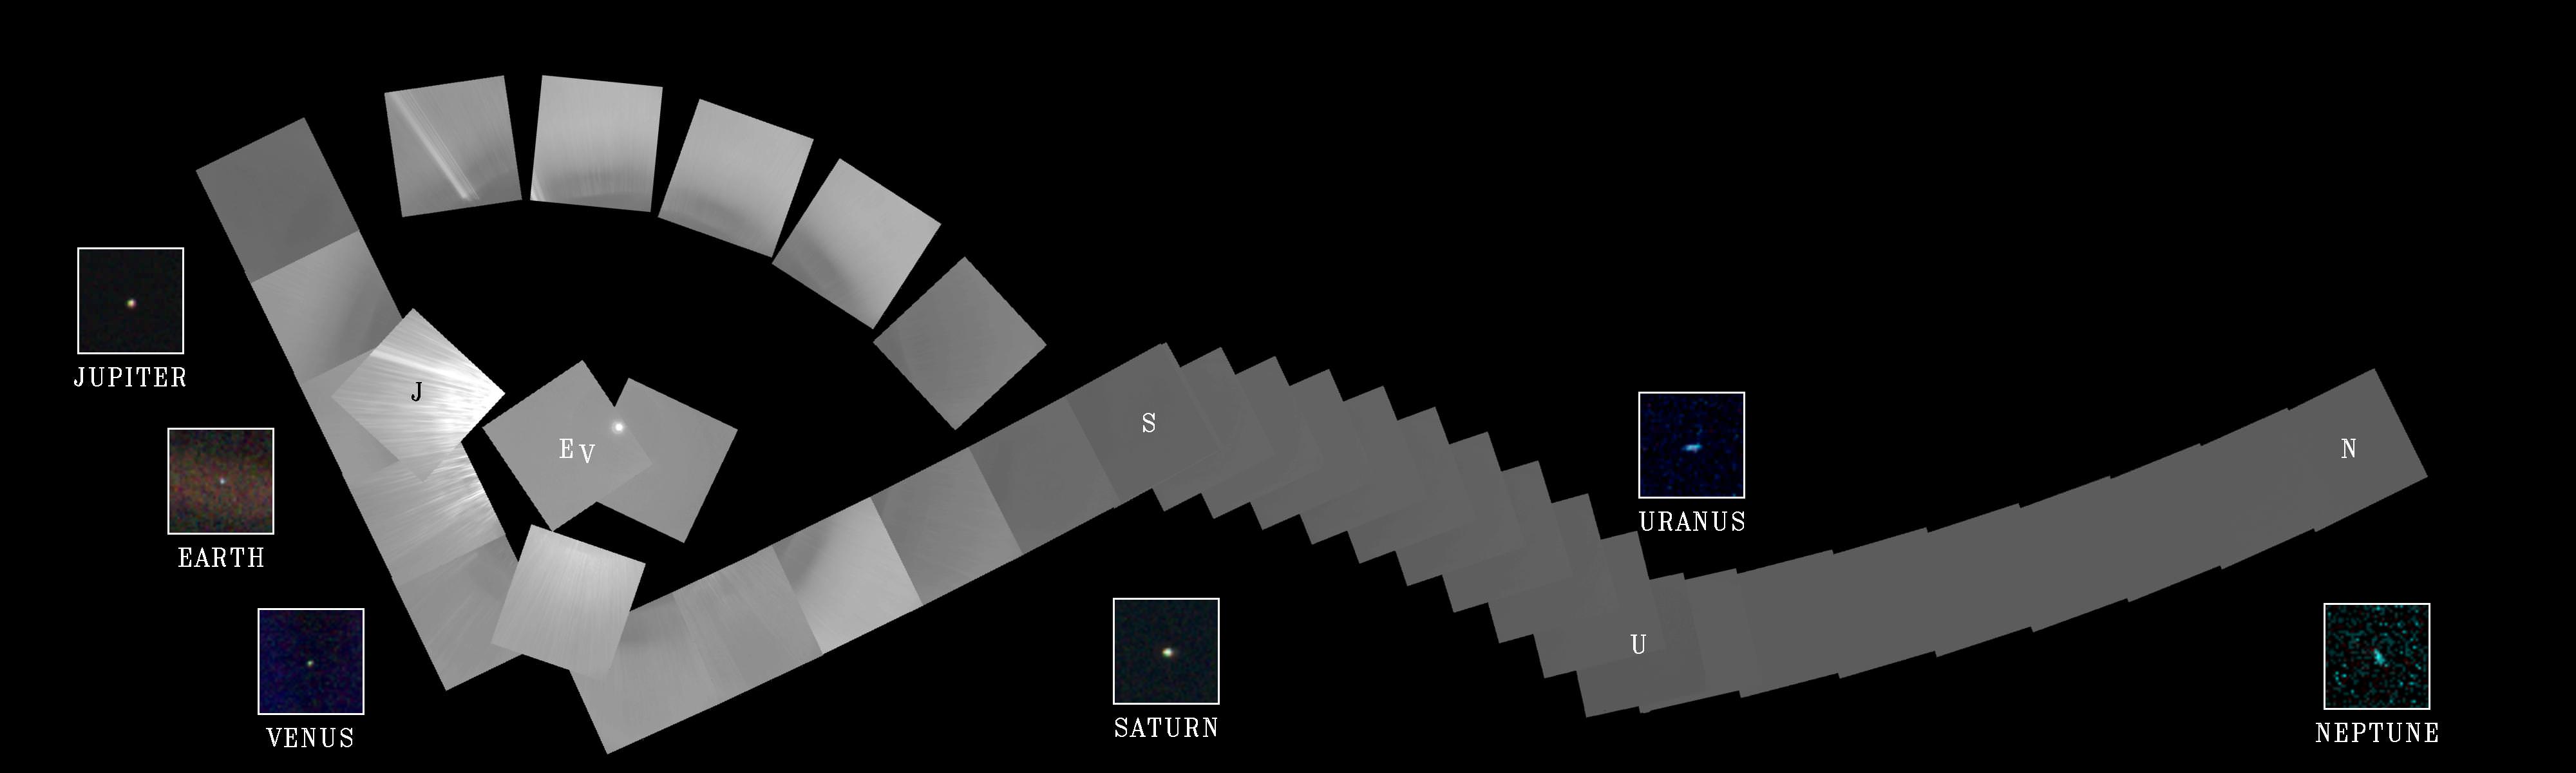
Venus, Earth, Jupiter, Saturn, Uranus and Neptune as seen by Voyager 1 on Valentine's Day in 1990
On February 14, 1990, after nearly 13 years of travel through the outer Solar System, NASA’s Voyager 1 spacecraft crossed the orbit of Pluto and turned its camera around, capturing photos of the planets as seen from that vast distance. It was a family portrait taken from over 4.4 billion kilometers away — the ultimate space Valentine.
Who says astronomy isn’t romantic?
Full mosaic of Voyager 1 images taken on Feb. 14, 1990 (NASA/JPL)
“That’s here. That’s home. That’s us. On it everyone you love, everyone you know, everyone you ever heard of, every human being who ever was, lived out their lives… There is perhaps no better demonstration of the folly of human conceits than this distant image of our tiny world.”
– Carl Sagan
It was the unique perspective above provided by Voyager 1 that inspired Carl Sagan to first coin the phrase “Pale Blue Dot” in reference to our planet. And it’s true… from the edges of the solar system Earth is just a pale blue dot in a black sky, a bright speck just like all the other planets. It’s a sobering and somewhat chilling image of our world… but also inspiring, as the Voyager 1 and 2 spacecraft are now the farthest human-made objects in existence — and getting farther every second. They still faithfully transmit data back to us even now, over 35 years since their launches, from 18.5 and 15.2 billion kilometers away.
The Voyagers sure know the value of a long-term relationship.
Satellite image of a cloud vortex off the coast of Greenland (NASA/MODIS/Chelys)
Looking south across the southern tip of Greenland, this satellite image shows an enormous cloud vortex spiraling over the northern Atlantic ocean on January 26, 2013. An example of the powerful convection currents in the upper latitudes, these polar low cyclones are created when the motion of cold air is energized by the warmer ocean water beneath.
Sometimes referred to as Arctic cyclones, these spiraling storms can bring gale-force winds and heavy snowfall over a wide area of ocean during their 12- to 36-hour lifespans. Hurricane-type storms don’t only form in the tropics!
This image was captured by the MODIS instrument on NASA’s Aqua satellite from its polar orbit 705 km (438 miles) above the Earth. The view has been rotated so south is up; the southernmost tip of Greenland can be seen at lower right. Click for an impressive high-resolution view.
Video Caption: At NASA, we’ve been a little busy: landing on Mars, developing new human spacecraft, going to the space station, working with commercial partners, observing the Earth and the Sun, exploring our solar system and understanding our universe. And that’s not even everything.Credit: NASA
Check out this cool action packed video titled “NASA: Reaching for New Heights” – to see NASA’s ‘Greatest Hits’ from the past year
The 4 minute film is a compilation of NASA’s gamut of Robotic Science and Human Spaceflight achievements to explore and understand Planet Earth here at home and the heavens above- ranging from our Solar System and beyond to the Galaxy and the vast expanse of the Universe.
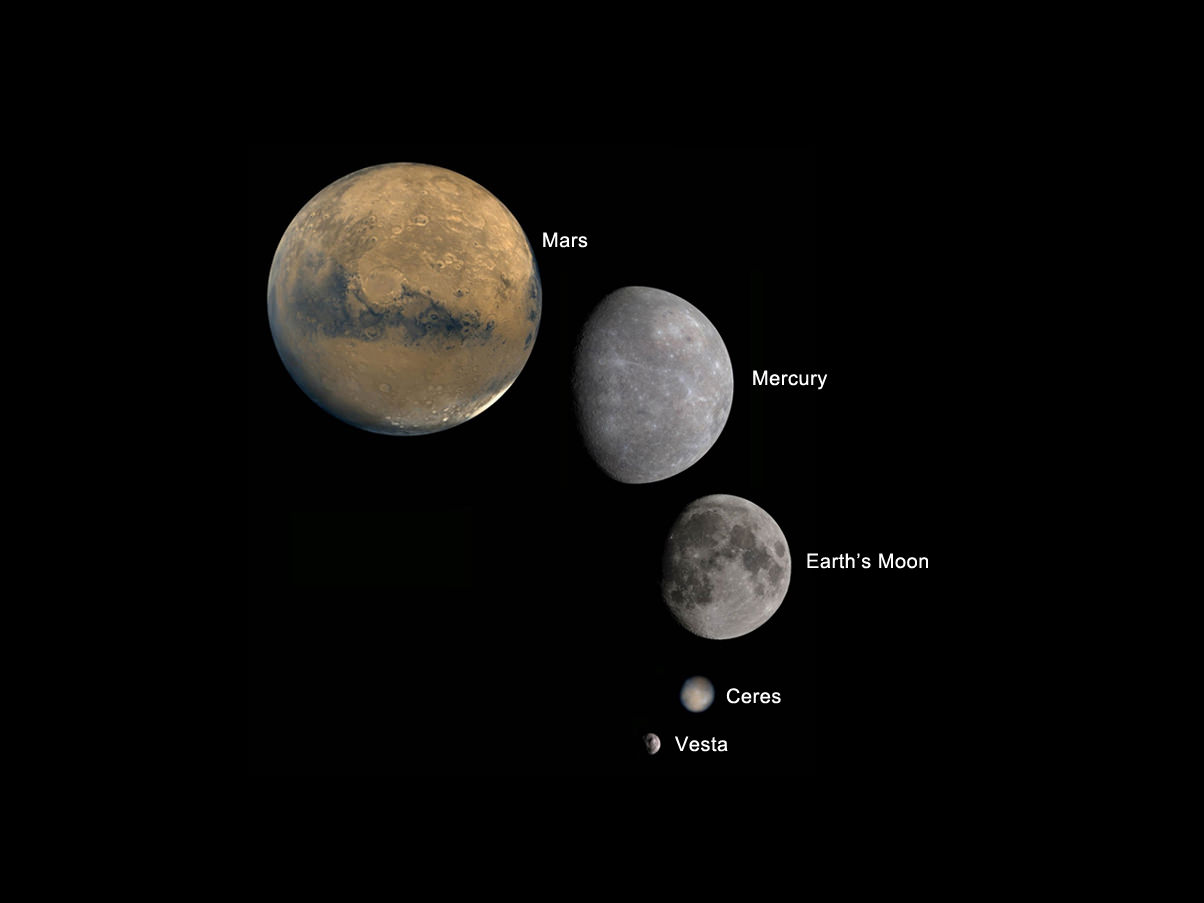
Image caption: Planets and Moons in perspective. Credit: NASA
The missions and programs featured include inspiringly beautiful imagery from : Curiosity, Landsat, Aquarius, GRACE, NuSTAR, GRAIL, Dawn at Asteroid Vesta, SDO, X-48C Amelia, Orion, SLS, Apollo, SpaceX, Sierra Nevada Dream Chaser, Boeing CST-100, Commercial Crew, Hurricane Sandy from the ISS, Robonaut and more !
And even more space exploration thrills are coming in 2013 !
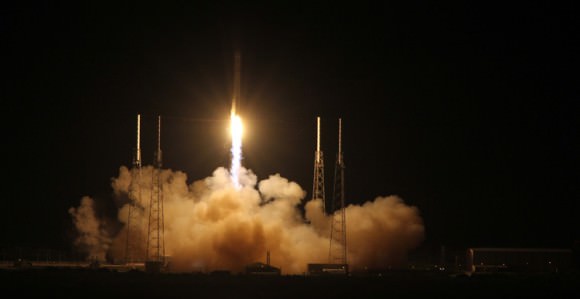
Image caption: SpaceX Falcon 9 rocket blasts off on May 22, 2012 with Dragon cargo capsule from Space Launch Complex-40 at Cape Canaveral Air Force Station, Fla., on the first commercial mission to the International Space Station. The next launch is set for March 1, 2013. Credit: Ken Kremer
This map represents global temperature anomalies averaged from 2008 through 2012. Credit: NASA Goddard Institute for Space Studies/NASA Goddard's Scientific Visualization Studio.
This week, scientists at NASA released their global climate analysis for 2012 which revealed that Earth continues to experience warmer temperatures than several decades ago. The past year was the ninth warmest year on record since 1880, continuing what appears to be a long-term global trend of rising temperatures. The ten warmest years in the 132-year record have all occurred since 1998, and the last year that was cooler than average was 1976. The hottest years on record were 2010 and 2005.
The analysis was done by NASA’s Goddard Institute for Space Studies (GISS) which monitors global surface temperatures on an ongoing basis, comparing temperatures around the globe to the average global temperature from the mid-20th century.
In 2012, the average temperature was about 14.6 degrees Celsius (58.3 degrees Fahrenheit). This is .55 degrees C (1.0 degree F) warmer than the mid-20th century baseline, with the global average temperature having risen about 0.8 degrees C (1.4 degrees F) since 1880. The majority of that change has occurred in the past forty years.
Additionally, last week the US National Climatic Data Center (NCDC) released their latest climate report from 2012 and found that it was the warmest year ever recorded in the contiguous United States. The average temperature for the contiguous United States for 2012 was 13 degrees C (55.3 degrees F) which was 3.2°F above the 20th century average.
The map depicts temperature anomalies, or changes, by region in 2012; while the line plot above shows yearly temperature anomalies from 1880 to 2011 as recorded by NASA GISS, the National Oceanic and Atmospheric Administration (NOAA) National Climatic Data Center, the Japanese Meteorological Agency, and the Met Office Hadley Centre in the United Kingdom. NASA Goddard Institute for Space Studies.
The data was gathered by NASA GISS, the National Oceanic and Atmospheric Administration (NOAA) National Climatic Data Center, the Japanese Meteorological Agency, and the Met Office Hadley Centre in the United Kingdom. All four institutions tally temperature data from stations around the world and make independent judgments about whether the year was warm or cool compared to other years. Though there are minor variations from year to year, all four records show peaks and valleys in sync with each other. All show rapid warming in the past few decades, and all show the last decade as the warmest.
Scientists emphasize that weather patterns cause fluctuations in average temperatures from year to year, but the continued increase in greenhouse gas levels in the atmosphere assures that there will be a long-term rise in global temperatures. Each individual year will not necessarily be warmer than the previous year, but scientists expect each decade to be warmer than the previous decade.
“One more year of numbers isn’t in itself significant,” GISS climatologist Gavin Schmidt said. “What matters is this decade is warmer than the last decade, and that decade was warmer than the decade before. The planet is warming. The reason it’s warming is because we are pumping increasing amounts of carbon dioxide into the atmosphere.”
See an interactive global temperature map from New Scientist.
Carbon dioxide traps heat and largely controls Earth’s climate. It occurs naturally but is also released by the burning of fossil fuels for energy. The level of carbon dioxide in Earth’s atmosphere has been rising consistently for decades, largely driven by increasing man-made emissions. The carbon dioxide level in the atmosphere was about 285 parts per million in 1880, the first year of the GISS temperature record. By 1960, the atmospheric carbon dioxide concentration, measured at NOAA’s Mauna Loa Observatory, was about 315 parts per million. Today, that measurement exceeds 390 parts per million.
The continental U.S. endured its warmest year on record by far, according to NOAA, the official keeper of U.S. weather records. NOAA also announced that global temperatures were 10th warmest on record by their analysis methods.
“The U.S. temperatures in the summer of 2012 are an example of a new trend of outlying seasonal extremes that are warmer than the hottest seasonal temperatures of the mid-20th century,” NASA GISS director James E. Hansen said. “The climate dice are now loaded. Some seasons still will be cooler than the long-term average, but the perceptive person should notice that the frequency of unusually warm extremes is increasing. It is the extremes that have the most impact on people and other life on the planet.”
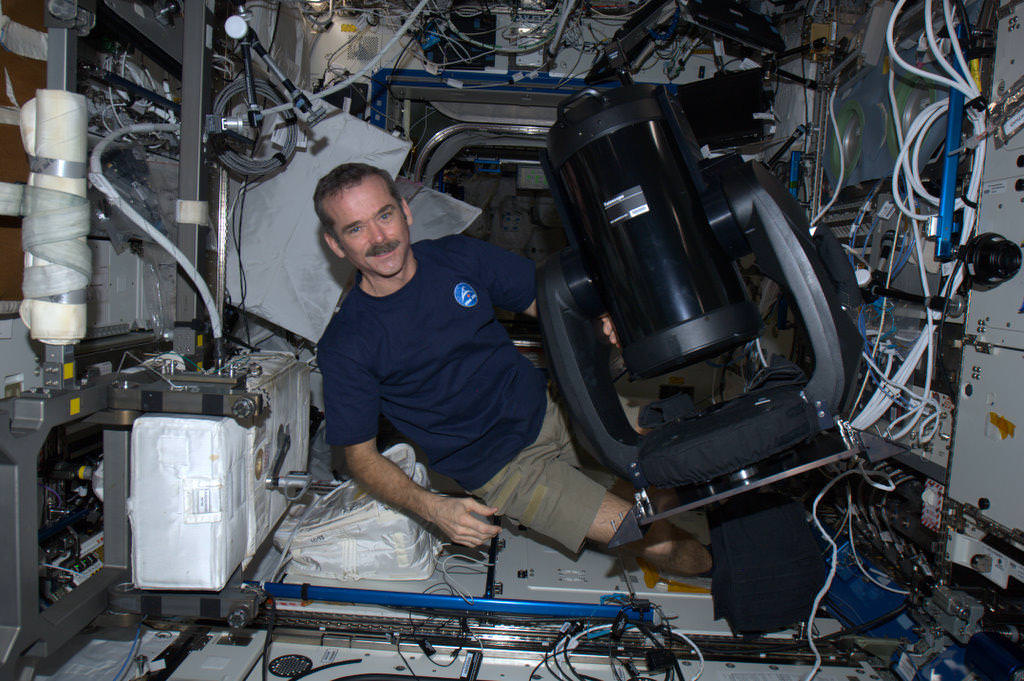
Canadian astronaut Chris Hadfield with the new ISERV (International Space Station SERVIR Environmental Research and Visualization System), a modified Celestron telescope for Earth observation. Credit: NASA/CSA
Astronauts on the International Space Station today are installing a new modified Celestron telescope. This won’t be used to observe the stars, but instead look back to Earth to acquire imagery of specific areas of the world for disaster analysis and environmental studies. Called ISERV (International Space Station SERVIR Environmental Research and Visualization System), it is a new remote-controlled imaging system.
“Essentially, it will be pointed out of one of the windows of the Space Station, and used for Earth imaging,” Andrea Tabor, social media coordinator for Celestron told Universe Today, “especially for natural disasters and to help countries that may not have their own Earth-observing satellites to help assess damage and assist with evacuations.”
ISERV will be installed in the Window Observational Research Facility (WORF) in the station’s Destiny laboratory.
The Celestron CPC 925, is a 9.25″ diffraction limited Schmidt-Cassegrain telescope and off-the-shelf sells for $2,500 including the mount, (just the 9.25 inch optical tube sells for $1,479). It was modified at the Marshall Space Flight Center.
“They used the fork mount that comes with it,” Tabor said, “but they just removed the tripod and replaced it with a specialized mount to anchor and stabilize it on the ISS.”
Because it is pointed out of a window and because the ISS is moving so fast, it would be difficult to align it with the sky and do any celestial imaging, Tabor said.
ISERV is the first of what is hoped to be a series of space station Earth-observing instruments, each to feature progressively more capable sensors to help scientists gain operational experience and expertise, as well as help design better systems in the future. Scientists envision that future sensors could be mounted on the exterior of the station for a clearer, wider view of Earth.
It arrived on the ISS in July of 2012 on board the Japanese HTV-3.
“It’s been up there sitting in a box, so today was unboxing and assembly day,” Tabor said. She added that they hope to post some of the first images from the telescope on their Twitter and Facebook pages.
The telescope will normally be operated by remote-controlled from Earth and so the astronauts won’t likely be working with it directly except for assessing its operation or troubleshooting any problems.
“Images captured from ISERV on the ISS could provide valuable information back here on Earth,” said Dan Irwin, SERVIR program director at Marshall. “We hope it will provide new data and information from space related to natural disasters, environmental crises and the increased effects of climate variability on human populations.”
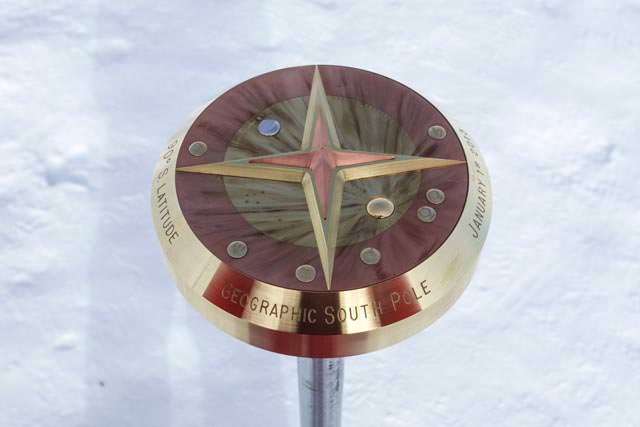
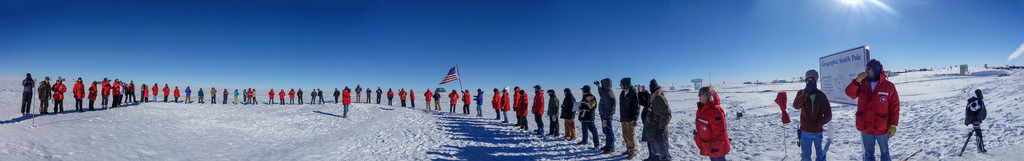
The new geographic South Pole marker that stands at 90º S latitude. (Credit: Jeffrey Donenfeld)
Because the Amundsen-Scott South Pole Station sits atop a layer of moving ice almost 2 miles thick, the location of the marker for the Earth’s geographic South Pole needs to be relocated regularly. Tradition has this done on New Year’s Day, and so this past January 1 saw the unveiling of the newest South Pole marker: a beautiful brass-and-copper design created by Station machinist Derek Aboltins.
The top of the marker has seven small discs that represent the planets in the positions they would be in on Jan. 1, 2013, as well as two larger discs representing the setting Sun and Moon. Next to the Moon disc are the engraved words “Accomplishment & Modesty,” a nod to the first man on the Moon.
“This was a reference to honor Neil Armstrong, as he passed away when I was making this section with the moon,” Aboltins said.
And for folks who might think the planet count on the new marker is one too few, a surprise has been tucked away on the reverse side.
“For those of you who still think Pluto should be a planet, you’ll find it included underneath, just to keep everyone happy,” Aboltins said. “Bring back Pluto, I say!”
And so, on the underside of the marker along with the signatures of South Pole Station researchers and workers, is one more disc — just for the distant “demoted” dwarf planet.
Underside of the South Pole marker (Credit: Jeffrey Donenfeld)
“For those of you who still think Pluto should be a planet, you’ll find it included underneath, just to keep everyone happy!”
– Derek Aboltins, designer and machinist
(See high resolution versions of these images here.)
The marker was placed during a ceremony on the ice on Jan. 1, during which time the previous flag marker was removed and put into its new position.
“Almost all hands were present for the ceremony, including station manager Bill Coughran, winter site manager Weeks Heist, and National Science Foundation representative Vladimir Papitashvili. The weather was sunny and a warm at just below minus 14 degrees Fahrenheit.”
(Even though it’s mid-summer in Antarctica, “warm” is clearly a relative term!)
Read more about this and other Antarctic news on The Antarctic Sun site, and see more photos from Antarctica by Jeffrey Donenfeld here.
_____________________
Named for explorers Roald Amundsen and Robert F. Scott, who attained the South Pole in 1911 and 1912, the Amundsen-Scott South Pole Station stands at an elevation of 2,835 meters (9,306 feet) on Antarctica’s ice sheet, which is about 2,700 meters (9,000 feet) thick at that location. The station drifts with the ice sheet at about 10 meters (33 feet) each year. Research is conducted at the station in the fields of astronomy, astrophysics, glaciology, geophysics and seismology, ocean and climate systems, biology, and medicine.
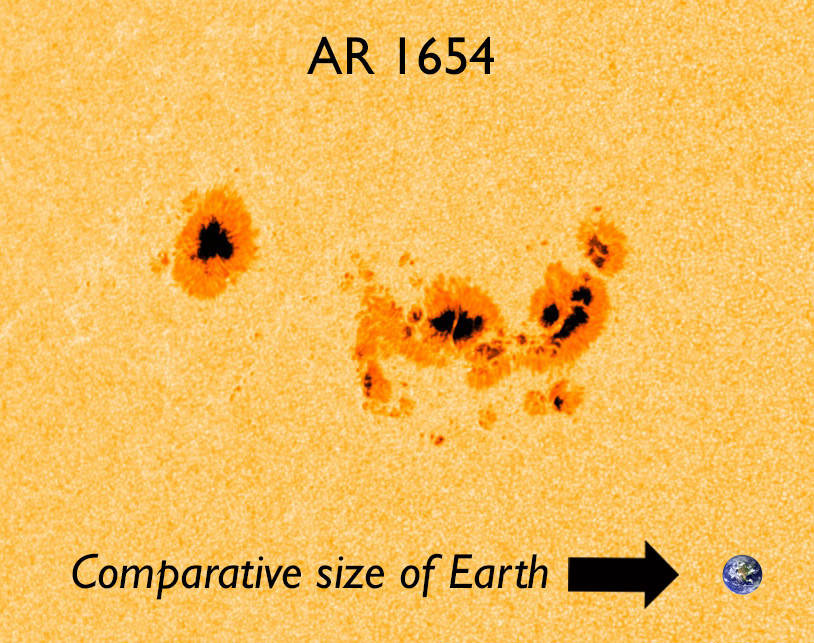
Active Region 1654 on the Sun’s western limb, seen by SDO on Jan. 11 (NASA/SDO/HMI team. Diagram by J. Major.)
Like an enormous cannon that is slowly turning its barrel toward us, the latest giant sunspot region AR1654 is steadily moving into position to face Earth, loaded with plenty of magnetic energy to create M-class flares — moderate-sized outbursts of solar energy that have the potential to cause brief radio blackouts on Earth and, at the very least, spark bright aurorae around the upper latitudes.
According to SpaceWeather.com, AR1654 “could be the sunspot that breaks the recent lengthy spell of calm space weather around our planet.”
The image above, captured by NASA’s Solar Dynamics Observatory earlier today, shows the structure of AR1654 upon the Sun’s photosphere — its light-emitting “surface” layer. Stretching many tens of thousands of miles, this magnetic solar blemish easily dwarfs our entire planet. And it’s not just a prediction that this sunspot will unleash a flare — it already has.
AR1654 came around the limb of the sun crackling with activity. Shortly after the probability of AR1654 releasing a flare was raised to 50% it did just that, letting loose with a burst of magnetic energy that was observed by SDO’s multi-channel cameras. Watch the video below:
Peaking at 9:11 UTC, this M1-class flare won’t have much more effect on Earth than perhaps some radio and GPS interference and maybe increased auroral activity. But AR1654 is still evolving and growing… and moving to face us.
In the meantime, solar astronomers and observatories like SDO are keeping an ever-watchful eye on this magnetic monster.
UPDATE 1/12: According to the NOAA, AR1654 has a 5% chance of producing an X-class flare, based on its current magnetic activity and alignment.
A sunspot is a magnetically active region on the sun that appears dark because it’s relatively cooler than the surrounding area—6,000ºF (3,300ºC) versus 10,000ºF (5,500º C). Sunspots are where solar flares are most likely to occur since the magnetic fields in these active regions can build up enough energy to break, releasing bursts of intense radiation into the solar system.
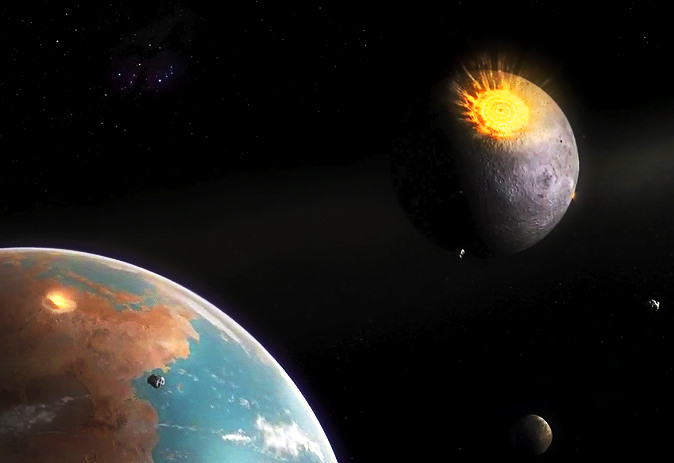
When the Moon was receiving its highest number of impacts, so was Earth. Credit: Dan Durda
Some questions about our own planet are best answered by looking someplace else entirely… in the case of impact craters and when, how and how often they were formed, that someplace can be found shining down on us nearly every night: our own companion in space, the Moon.
By studying lunar impact craters both young and old scientists can piece together the physical processes that took place during the violent moments of their creation, as well as determine how often Earth — a considerably bigger target — was experiencing similar events (and likely in much larger numbers as well.)
With no substantial atmosphere, no weather and no tectonic activity, the surface of the Moon is a veritable time capsule for events taking place in our region of the Solar System. While our constantly-evolving Earth tends to hide its past, the Moon gives up its secrets much more readily… which is why present and future lunar missions are so important to science.
Take the crater Linné, for example. A young, pristine lunar crater, the 2.2-km-wide Linné was formed less than 10 million years ago… much longer than humans have walked the Earth, yes, but very recently on lunar geologic terms.
It was once thought that the circular Linné (as well as other craters) is bowl-shaped, thus setting a precedent for the morphology of craters on the Moon and on Earth. But laser-mapping observations by NASA’s Lunar Reconnaissance Orbiter (at right) determined in early 2012 that that’s not the case; Linné is actually more of a truncated inverted cone, with a flattened interior floor surrounded by sloping walls that rise up over half a kilometer to its rim.
On our planet the erosive processes of wind, water, and earth soon distort the shapes of craters like Linné, wearing them down, filling them in and eventually hiding them from plain sight completely. But in the Moon’s airless environment where the only weathering comes from more impacts they retain their shape for much longer lengths of time, looking brand-new for many millions of years. By studying young craters in greater detail scientists are now able to better figure out just what happens when large objects strike the surface of worlds — events that can and do occur quite regularly in the Solar System, and which may have even allowed life to gain a foothold on Earth.
Most of the craters visible on the Moon today — Linné excluded, of course — are thought to have formed within a narrow period of time between 3.8 and 3.9 billion years ago. This period, called the Late Heavy Bombardment, saw a high rate of impact events throughout the inner Solar System, not only on the Moon but also on Mars, Mercury, presumably Venus and Earth as well. In fact, since at 4 times its diameter the Earth is a much larger target than the Moon, it stands to reason that Earth was impacted many more times than the Moon as well. Such large amounts of impacts introduced material from the outer Solar System to the early Earth as well as melted areas of the surface, releasing compounds like water that had been locked up in the crust… and even creating the sorts of environments where life could have begun to develop and thrive.
(It’s been suggested that there was even a longer period of heavy impact rates nicknamed the “late late heavy bombardment” that lingered up until about 2.5 billion years ago. Read more here.)
In the video below lunar geologist David Kring discusses the importance of impacts on the evolution of the Moon, Earth and eventually life as we know it today:
“Impact cratering in Earth’s past has affected not only the geologic but the biologic evolution of our planet, and we were able to deduce that in part by the lessons we learned by studying the Moon… and you just have to wonder what other things we can learn by going back to the Moon and studying that planetary body further.”
It’s these sorts of connections that make lunar exploration so valuable. Keys to our planet’s past are literally sitting on the surface of the Moon, a mere 385,000 km away, waiting for us to just scoop them up and bring them back. While the hunt for a biological history on Mars or resource-mining an asteroid are definitely important goals in their own right, only the Moon holds such direct references to Earth. It’s like an orbiting index to the ongoing story of our planet — all we have to do is make the connections.
Learn more about lunar research at the LPI site here, and see the latest news and images from LRO here.
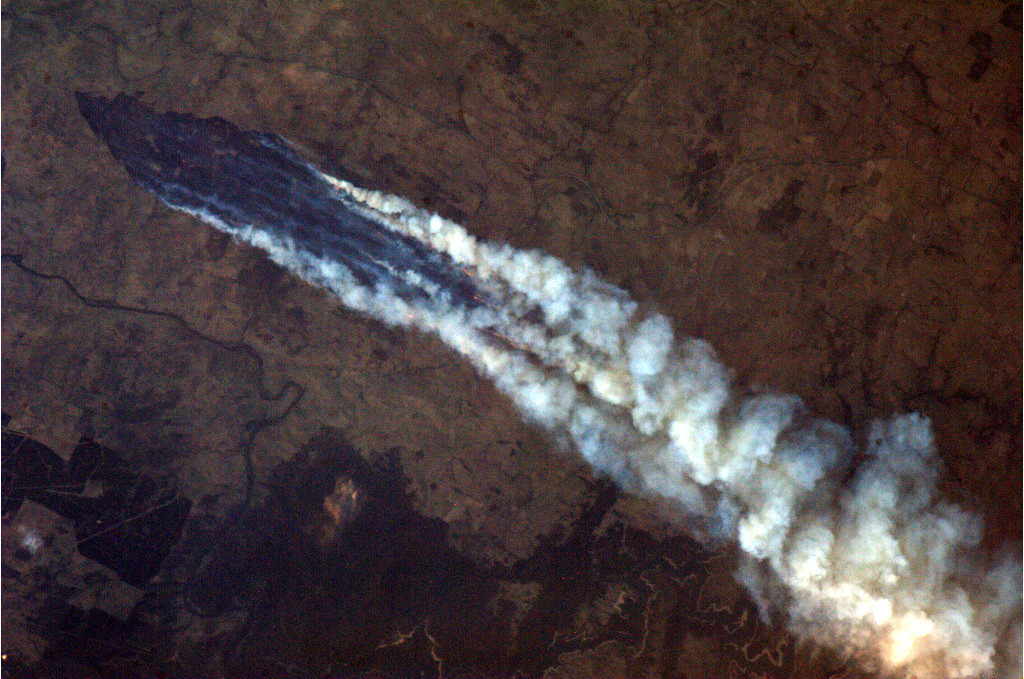
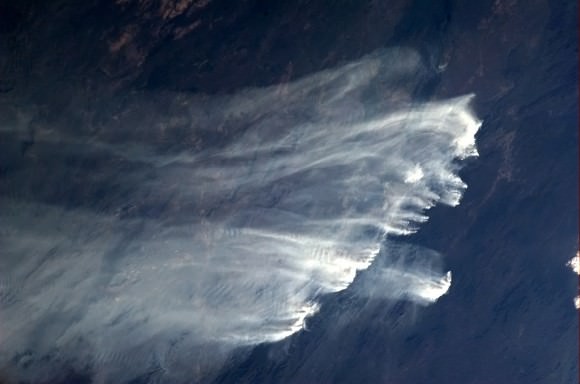
Lines of scorched earth and huge smoke plumes from wild fires in Australia were visible from the International Space Station on January 8, 2013. Credit: NASA/Chris Hadfield
Intense wild fires, or bush fires as they are called in Australia, are burning out of control across southeast Australia with authorities describing the condition as “catastrophic.” The huge fires were easily visible from the International Space Station on Tuesday and onboard, Canadian astronaut Chris Hadfield has been watching from above.
See more of his images below:
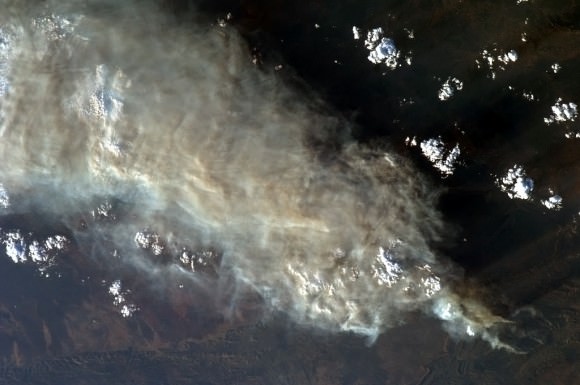
Officials say more than 130 fires, many uncontained, are burning in the heavily populated New South Wales state, where dry conditions are fueling the fires as temperatures reached 45 degrees and wind gusts reached more than 100 kilometers per hour.
Huge plumes of smoke from bush fires in Australia were visible from the International Space Station. Credit: NASA/Chris Hadfield.
In Tasmania, an island south of Australia, rescue officials are still trying to locate around 100 residents who have been missing after a fire tore through a village, destroying dozens of homes. You can see images from the Moderate Resolution Imaging Spectroradiometer (MODIS) on NASA’s Terra satellite that were taken on January 7, 2013 at the Earth Observatory website.
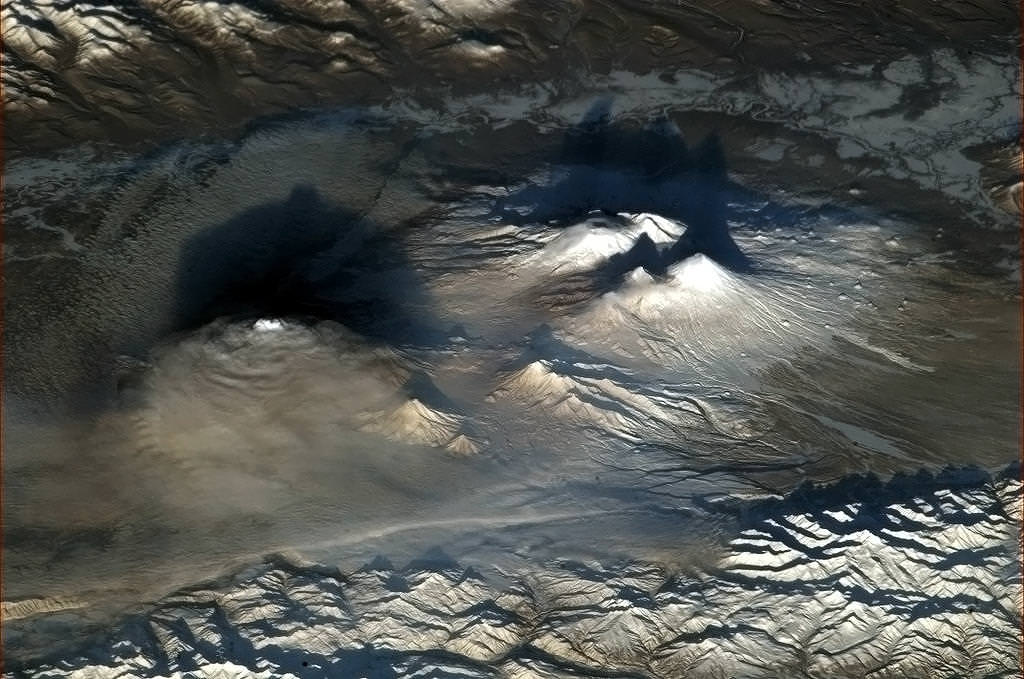
Volcanoes of Kamchatka, Russia at dawn, as seen from the International Space Station. Credit: NASA/CSA/Chris Hadfield
A stunning view from orbit! Astronaut Chris Hadfield captured this shot of the volcanoes of Kamchatka in Russia. “Volcanoes look dramatic at dawn,” Hadfield said via Twitter. “They startled me when I spotted them through the lens.”
Note the huge shadows created by the Sun, which is low on the horizon at dawn.
These are just a few of the 160 volcanoes on the Kamchatka Peninsula in the far eastern part of Russia. 29 of the 160 are active. Thanks to Peter Caltner on Twitter who identified the volcanoes seen here: Tolbachik (at left, in clouds and smoke plume, active presently); Ushkovsky (in the back, right); Kliuchevskoi (right edge, the peak in front). Little ones in the foreground: Udina (left) and Zimina (right).

 It was the unique perspective above provided by Voyager 1 that inspired Carl Sagan to first coin the phrase “Pale Blue Dot” in reference to our planet. And it’s true… from the edges of the solar system Earth is just a pale blue dot in a black sky, a bright speck just like all the other planets. It’s a sobering and somewhat chilling image of our world… but also inspiring, as the Voyager 1 and 2 spacecraft are now the farthest human-made objects in existence — and getting farther every second. They still faithfully transmit data back to us even now, over 35 years since their launches, from 18.5 and 15.2 billion kilometers away.