Future Ice Free Summers in the Arctic

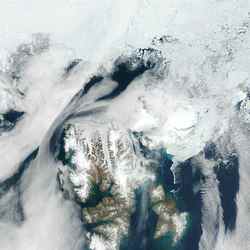
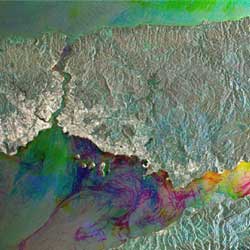
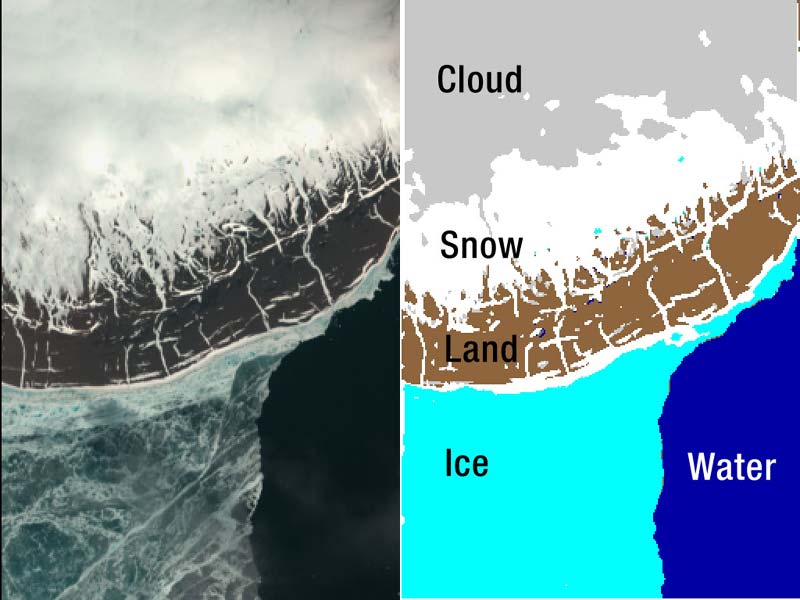
Arctic ocean. Image credit: NASA/GSFC Click to enlarge
The current warming trends in the Arctic may shove the Arctic system into a seasonally ice-free state not seen for more than one million years, according to a new report. The melting is accelerating, and a team of researchers were unable to identify any natural processes that might slow the de-icing of the Arctic.

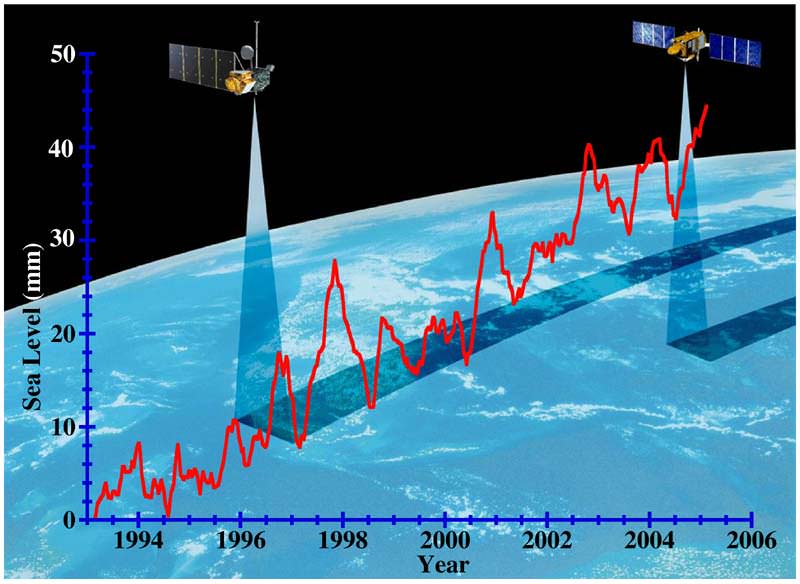
Such substantial additional melting of Arctic glaciers and ice sheets will raise sea level worldwide, flooding the coastal areas where many of the world’s people live.

Melting sea ice has already resulted in dramatic impacts for the indigenous people and animals in the Arctic, which includes parts of Alaska, Canada, Russia, Siberia, Scandinavia and Greenland.

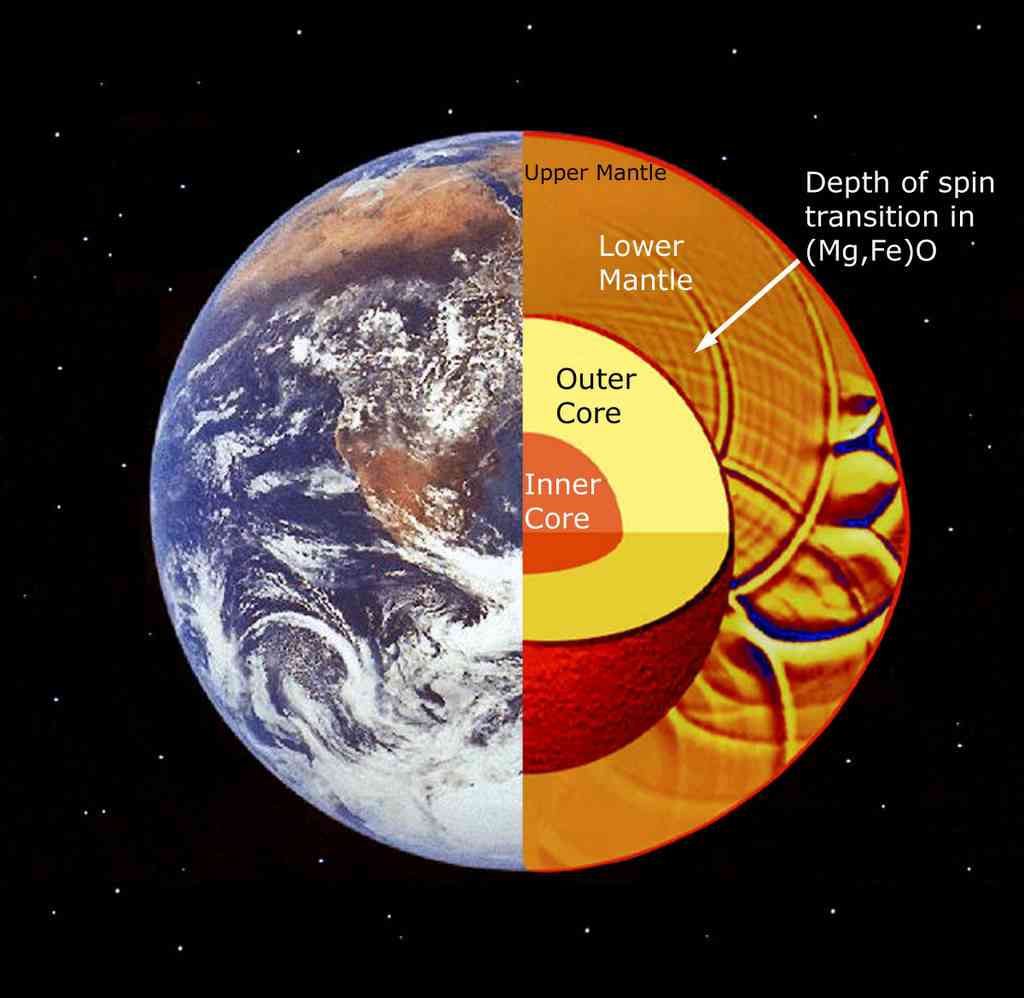
?What really makes the Arctic different from the rest of the non-polar world is the permanent ice in the ground, in the ocean and on land,? said lead author University of Arizona geoscientist Jonathan T. Overpeck. ?We see all of that ice melting already, and we envision that it will melt back much more dramatically in the future as we move towards this more permanent ice-free state.?

The report by Overpeck and his colleagues is published in the Aug. 23 Eos, the weekly newspaper of the American Geophysical Union. A complete list of authors and their affiliations is at the end of this release.

The report is the result of weeklong meeting of a team of interdisciplinary scientists who examined how the Arctic environment and climate interact and how that system would respond as global temperatures rise. The workshop was organized by the NSF Arctic System Science Committee, which is chaired by Overpeck. The National Science Foundation funded the meeting.

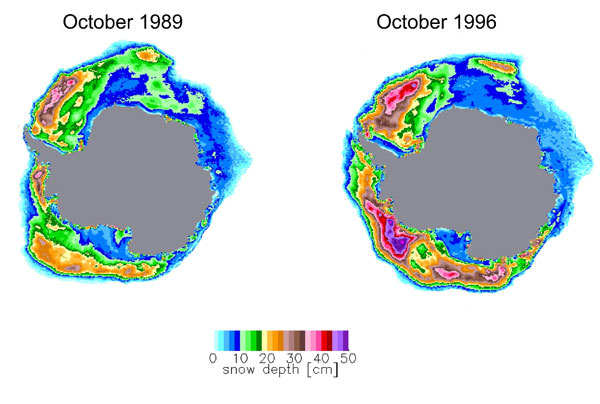
The past climates in the Arctic include glacial periods, where sea ice coverage expanded and ice sheets extended into Northern America and Europe, and warmer interglacial periods during which the ice retreats, as it has during the past 10,000 years.

By studying natural data loggers such as ice cores and marine sediments, scientists have a good idea what the ?natural envelope? for Arctic climate variations has been for the past million years, Overpeck said.

The team of scientists synthesized what is currently known about the Arctic and defined key components that make up the current system. The scientists identified how the components interact, including feedback loops that involve multiple parts of the system.

?In the past, researchers have tended to look at individual components of the Arctic,? said Overpeck. ?What we did for the first time is really look at how all of those components work together.?

The team concluded that there were two major amplifying feedbacks in the Arctic system involving the interplay between sea and land ice, ocean circulation in the North Atlantic, and the amounts of precipitation and evaporation in the system.

Such feedback loops accelerate changes in the system, Overpeck said. For example, the white surface of sea ice reflects radiation from the sun. However, as sea ice melts, more solar radiation is absorbed by the dark ocean, which heats up and results in yet more sea ice melting.

While the scientists identified one feedback loop that could slow the changes, they did not see any natural mechanism that could stop the dramatic loss of ice.

?I think probably the biggest surprise of the meeting was that no one could envision any interaction between the components that would act naturally to stop the trajectory to the new system,? Overpeck said. He added that the group investigated several possible braking mechanisms that had been previously suggested.

In addition to sea and land ice melting, Overpeck warned that permafrost?the permanently frozen layer of soil that underlies much of the Arctic?will melt and eventually disappear in some areas. Such thawing could release additional greenhouse gases stored in the permafrost for thousands of years, which would amplify human-induced climate change.

Overpeck said humans could step on the brakes by reducing carbon dioxide emissions. ?The trouble is we don?t really know where the threshold is beyond which these changes are inevitable and dangerous,” Overpeck said. ?Therefore it is really important that we try hard, and as soon as we can, to dramatically reduce such emissions.?

Original Source: University of Arizona News Release

Sea Ice May Be Increasing in the Antarctic

Antarctic Snow Depth on Sea Ice. Image credit: NASA Click to enlarge
A new NASA-funded study finds that predicted increases in precipitation due to warmer air temperatures from greenhouse gas emissions may actually increase sea ice volume in the Antarctic?s Southern Ocean. This adds new evidence of potential asymmetry between the two poles, and may be an indication that climate change processes may have different impact on different areas of the globe.

“Most people have heard of climate change and how rising air temperatures are melting glaciers and sea ice in the Arctic,” said Dylan C. Powell, co-author of the paper and a doctoral candidate at the University of Maryland-Baltimore County. “However, findings from our simulations suggest a counterintuitive phenomenon. Some of the melt in the Arctic may be offset by increases in sea ice volume in the Antarctic.”

The researchers used satellite observations for the first time, specifically from the Special Sensor Microwave/Imager, to assess snow depth on sea ice, and included the satellite observations in their model. As a result, they improved prediction of precipitation rates. By incorporating satellite observations into this new method, the researchers achieved more stable and realistic precipitation data than the typically variable data found in the polar regions. The paper was published in the June issue of the American Geophysical Union’s Journal of Geophysical Research.

“On any given day, sea ice cover in the oceans of the polar regions is about the size of the U.S.,” said Thorsten Markus, co-author of the paper and a research scientist at NASA?s Goddard Space Flight Center, Greenbelt, Md. “Far-flung locations like the Arctic and Antarctic actually impact our temperature and climate where we live and work on a daily basis.”

According to Markus, the impact of the northernmost and southernmost parts on Earth on climate in other parts of the globe can be explained by thermal haline (or saline) circulation. Through this process, ocean circulation acts like a heat pump and determines our climate to a great extent. The deep and bottom water masses of the oceans make contact with the atmosphere only at high latitudes near or at the poles. In the polar regions, the water cools down and releases its salt upon freezing, a process that also makes the water heavier. The cooler, salty, water then sinks down and cycles back towards the equator. The water is then replaced by warmer water from low and moderate latitudes, and the process then begins again.

Typically, warming of the climate leads to increased melting rates of sea ice cover and increased precipitation rates. However, in the Southern Ocean, with increased precipitation rates and deeper snow, the additional load of snow becomes so heavy that it pushes the Antarctic sea ice below sea level. This results in even more and even thicker sea ice when the snow refreezes as more ice. Therefore, the paper indicates that some climate processes, like warmer air temperatures increasing the amount of sea ice, may go against what we would normally believe would occur.

“We used computer-generated simulations to get this research result. I hope that in the future we?ll be able to verify this result with real data through a long-term ice thickness measurement campaign,” said Powell. “Our goal as scientists is to collect hard data to verify what the computer model is telling us. It will be critical to know for certain whether average sea ice thickness is indeed increasing in the Antarctic as our model indicates, and to determine what environmental factors are spurring this apparent phenomenon.”

Achim Stossel of the Department of Oceanography at Texas A&M University, College Station, Tex., a third co-author on this paper, advises that “while numerical models have improved considerably over the last two decades, seemingly minor processes like the snow-to-ice conversion still need to be better incorporated in models as they can have a significant impact on the results and therefore on climate predictions.”

Original Source: NASA News Release

Micro Vortices Seen in the Earth’s Magnetosphere

Artist’s impression of micro turbulence seen by Cluster. Image credit: ESA Click to enlarge
Thanks to measurements by ESA?s Cluster mission, a team of European scientists have identified ?micro?-vortices in Earth?s magnetosphere.

Such small-scale vortex turbulence, whose existence was predicted through mathematical models, has not been observed before in space. The results are not only relevant for space physics, but also for other applications like research on nuclear fusion.

On 9 March 2002, the four Cluster satellites, flying in tetrahedral formation at 100 kilometres distance from each other, were crossing the northern ?magnetic cusp? when they made their discovery. Magnetic cusps are the regions over the magnetic poles where the magnetic field lines surrounding Earth form a magnetic funnel.

The magnetic cusps are the two important regions in Earth?s magnetosphere where the ?solar wind? – a constant flow of charged particles generated by the Sun that crosses the whole Solar System – can directly access the upper layer of Earth?s atmosphere (the ionosphere).

Large amounts of plasma (a gas of charged particles) and energy are transported through these and other ?accessible? regions, to penetrate the magnetosphere – Earth?s natural protective shield. Only less than one percent of all the energy carried by the solar wind and hitting the Earth?s magnetosphere actually manages to sneak through, but it still can have a significant impact on earthly systems, like telecommunication networks and power lines.

The solar material sneaking in generates turbulence in the plasma surrounding Earth, similar to that in fluids but with more complex forces involved. Such turbulence is generated for instance in the areas of transition between layers of plasma of different density and temperature, but its formation mechanisms are not completely clear yet.

The turbulence exists at different scales, from few thousand to few kilometres across. With in situ ?multi-point? measurements, the four Cluster satellites reported in the year 2004 the existence of large scale turbulence – vortices up to 40 000 kilometres wide, at the flank of the ?magnetopause? (a boundary layer separating the magnetosphere from free space). The new discovery of ?micro? turbulence, with vortices of only 100 kilometres across, is a first in the study of the plasma surrounding Earth.

Cluster: an unprecedented diagnostic tool

Such a discovery is very relevant. For example, it allows scientists to start linking small and large-scale turbulence, and start questioning how it is actually formed and what are the connections. For instance, what are the basic mechanisms driving and shaping the turbulence? How much do vortices contribute to the transport of mass and energy through boundary layers? Are small vortices needed to generate large ones? Or, on the other hand, do large vortices dissipate their energy and create a cascade of smaller ones?

In trying to answer these questions, Cluster is an unprecedented diagnostic tool for the first three-dimensional map of the near-Earth environment, its exceptionality being given by its multi-spacecraft simultaneous observations. Cluster is revolutionising our understanding of the ways and the mechanisms by which solar activity affects Earth.

Besides, Cluster?s study of the turbulence in Earth?s plasma, with the dynamics and the energies involved, is contributing to the advancement of fundamental theories on plasma. This is not only important in astrophysics, but also as far as the understanding and the handling of plasma in laboratories is concerned, given the high energies involved. This is particularly relevant for research on nuclear fusion.

For example, Cluster?s data are complementing research on plasma physics in the international ITER project, an experimental step involving several research institutes around the world for tomorrow?s electricity-producing power plants. In this respect, by probing into the magnetosphere, Cluster has free access to the only open ?natural laboratory? for the study of plasma physics.

Original Source: ESA Portal

Delays for the Earth’s Oxygen Atmosphere

Looking down on Earth. Image credit: NASA Click to enlarge
A number of hypotheses have been used to explain how free oxygen first accumulated in Earth’s atmosphere some 2.4 billion years ago, but a full understanding has proven elusive. Now a new model offers plausible scenarios for how oxygen came to dominate the atmosphere, and why it took at least 300 million years after bacterial photosynthesis started producing oxygen in large quantities.

The big reason for the long delay was that processes such as volcanic gas production acted as sinks to consume free oxygen before it reached levels high enough to take over the atmosphere, said Mark Claire, a University of Washington doctoral student in astronomy and astrobiology. Free oxygen would combine with gases in a volcanic plume to form new compounds, and that process proved to be a significant oxygen sink, he said.

Another sink was iron delivered to the Earth’s outer crust by bombardment from space. Free oxygen was consumed as it oxidized, or rusted, the metal.

But Claire said that just changing the model to reflect different iron content in the outer crust makes a huge difference in when the model shows free oxygen filling the atmosphere. Increasing the actual iron content fivefold would have delayed oxygenation by more than 1 billion years, while cutting iron to one-fifth the actual level would have allowed oxygenation to happen more than 1 billion years earlier.

“We were fairly surprised that we could push the transition a billion years in either direction, because those levels of iron in the outer crust are certainly plausible given the chaotic nature of how Earth formed,” he said.

Claire and colleagues David Catling, a UW affiliate professor in atmospheric sciences, and Kevin Zahnle of the National Aeronautics and Space Administration’s Ames Research Center in California will discuss their model tomorrow (Aug. 9) in Calgary, Alberta, during the Geological Society of America’s Earth System Processes 2 meeting.

Earth’s oxygen supply originated with cyanobacteria, tiny water-dwelling organisms that survive by photosynthesis. In that process, the bacteria convert carbon dioxide and water into organic carbon and free oxygen. But Claire noted that on the early Earth, free oxygen would quickly combine with an abundant element, hydrogen or carbon for instance, to form other compounds, and so free oxygen did not build up in the atmosphere very readily. Methane, a combination of carbon and hydrogen, became a dominant atmospheric gas.

With a sun much fainter and cooler than today, methane buildup warmed the planet to the point that life could survive. But methane was so abundant that it filled the upper reaches of the atmosphere, where such compounds are very rare today. There, ultraviolet exposure caused the methane to decompose and its freed hydrogen escaped into space, Claire said.

The loss of hydrogen atoms to space allowed increasingly greater amounts of free oxygen to oxidize the crust. Over time, that slowly diminished the amount of hydrogen released from the crust by the combination of pressure and temperature that formed the rocks in the crust.

“About 2.4 billion years ago, the long-term geologic sources of oxygen outweighed the sinks in a somewhat permanent fashion,” Claire said. “Escaping to space is the only permanent escape that we envision for the hydrogen, and that drove the planet to a higher oxygen level.”

The model developed by Claire, Catling and Zahnle indicates that as hydrogen atoms stripped from methane escaped into space, greenhouse conditions caused by the methane blanket quickly collapsed. Earth’s average temperature likely cooled by about 30 degrees Celsius, or 54 degrees Fahrenheit, and oxygen was able to dominate the atmosphere because there was no longer an overabundance of hydrogen to consume the oxygen.

The work is funded by NASA’s Astrobiology Institute and the National Science Foundation’s Integrative Graduate Education and Research Traineeship program, both of which foster research to understand life in the universe by examining the limits of life on Earth.

“There is interest in this work not just to know how an oxygen atmosphere came about on Earth but to look for oxygen signatures for other Earth-like planets,” Claire said.

Original Source: UW News Release

Messenger Swoops Past the Earth

Earth taken by MESSENGER on July, 30. Image credit: NASA Click to enlarge
NASA’s MESSENGER spacecraft, headed toward the first study of Mercury from orbit, swung by Earth today for a gravity assist that propelled it deeper into the inner solar system.

Mission operators at the Johns Hopkins University Applied Physics Laboratory (APL) in Laurel, Md, said MESSENGER’s systems performed flawlessly. The spacecraft swooped around Earth, coming to a closest approach point of approximately 1,458 miles (2,347 kilometers) over central Mongolia at 3:13 p.m. EDT.

The spacecraft used the tug of Earth’s gravity to significantly change its trajectory. Its average orbit distance is nearly 18 million miles closer to the sun. The maneuver sent it toward Venus for another gravity-assist flyby next year.

Launched Aug. 3, 2004, from Cape Canaveral Air Force Station, Fla., the solar-powered spacecraft is approximately 581 million miles (930 million kilometers) into a 4.9 billion mile (7.9 billion kilometer) voyage that includes 14 more loops around the sun. MESSENGER will fly past Venus twice and Mercury three times before moving into orbit.

The Venus flybys in October 2006 and June 2007 will use the planet’s gravity to guide MESSENGER toward Mercury’s orbit. The Mercury flybys in January 2008, October 2008 and September 2009 will help MESSENGER match the planet’s speed. These events will set up the maneuver in March 2011 that starts a year-long science orbit around Mercury.

“This Earth flyby is the first of a number of critical mission milestones during MESSENGER’s circuitous journey toward Mercury orbit insertion,” said Sean C. Solomon, the mission’s principal investigator from the Carnegie Institution of Washington. “Not only did it help the spacecraft sharpen its aim toward our next maneuver, it presented a special opportunity to calibrate several of our science instruments.”

MESSENGER’s main camera snapped several approach shots of Earth and the moon during the past week. Today the camera is taking a series of color images, beginning with South America and continuing for one full Earth rotation. Science team members will string the images into a video documenting MESSENGER’s departure.

On Earth approach, the craft’s atmospheric and surface composition spectrometer made several scans of the moon in conjunction with the camera observations. In addition, the particle and magnetic field instruments spent several hours measuring Earth’s magnetosphere. The science team will download the data and images through NASA’s Deep Space Network over the next several weeks, continuing assessment of the instruments’ performance.

MESSENGER will conduct the first orbital study of Mercury, the least explored of the terrestrial planets that include Venus, Earth and Mars. During one Earth year (four Mercury years), MESSENGER will provide the first images of the entire planet. It will collect detailed information about the composition and structure of Mercury’s crust, its geologic history, nature of its atmosphere and magnetosphere, makeup of its core and polar materials.

MESSENGER, short for MErcury Surface, Space ENvironment, GEochemistry, and Ranging, is the seventh mission in NASA’s Discovery Program of lower-cost scientifically focused exploration projects. APL designed, built and operates the spacecraft and manages the mission for NASA’s Science Mission Directorate.

For information about the spacecraft and mission on the Web, visit: http://messenger.jhuapl.edu

Original Source: NASA News Release

Super Climate Simulation Models Oceans, Ice, Land and Atmosphere

Image depicts the sea surface temperature. Image credit: Shep Smithline, GFDL; Chris Hill, MIT. Click to enlarge
Researchers from MIT, NASA’s Goddard Space Flight Center and several other government and academic institutions have created four new supercomputer simulations that for the first time combine mathematical computer models of the atmosphere, ocean, land surface and sea ice.

These simulations are the first field tests of the new Earth System Modeling Framework (ESMF), an innovative software system that promises to improve predictive capability in diverse areas such as short-term weather forecasts and century-long climate-change projections.

Although still under development, groups from NASA, the National Science Foundation, the National Oceanic and Atmospheric Administration (NOAA), the Department of Energy, the Department of Defense and research universities are using ESMF as the standard for coupling their weather and climate models to achieve a realistic representation of the Earth as a system of interacting parts.

ESMF makes it easier to share and compare alternative scientific approaches from multiple sources; it uses remote sensing data more efficiently and eliminates the need for individual agencies to develop their own coupling software.

“The development of large Earth system applications often spans initiatives, institutions and agencies, and involves the geoscience, physics, mathematics and computer science communities. With ESMF, these diverse groups can leverage common software to simplify model development,” said NASA’s Arlindo da Silva, a scientist in Goddard’s Global Modeling and Assimilation Office.

The newly completed field tests, known as interoperability experiments, show that the new approach can be successful. Although most of the experiments would require exhaustive tuning and validation to be scientifically sound, they already show that ESMF can be used to assemble coupled applications quickly, easily and with technical accuracy.

The MIT experiment combines an atmosphere-land-ice model from NOAA’s Geophysical Fluid Dynamics Laboratory with an MIT ocean-sea ice model known as MITgcm (http://mitgcm.org/). This may ultimately bring new insights into ocean uptake of carbon dioxide and other atmospheric gases and information on how this process affects climate. Christopher Hill, principal research scientist in the MIT Department of Earth, Atmospheric and Planetary Sciences, and a member of the MIT Climate Modeling Iniatiative, led development of the software at MIT.

The ESMF research team plans to release the software to the scientific community via the Internet later this month.

Original Source: MIT News Release

New Revelations About the Planet Under Your Feet

Artist’s conception of the Earth’s inner layers. Image credit: S. Jacobsen, M. Wysession, and G. Caras. Click to enlarge
Recently, seismologists have observed that the speed and direction of seismic waves in Earth?s lower mantle, between 400 and 1,800 miles below the surface, vary tremendously. ?I think we may have discovered why the seismic waves travel so inconsistently there,? stated Jung-Fu Lin.* Lin was with the Carnegie Institution?s Geophysical Laboratory at the time of the study and lead author of the paper published in the July 21, issue of Nature. ?Until this research, scientists have simplified the effects of iron on mantle materials. It is the most abundant transition metal in the planet and our results are not what scientists have predicted,? he continued. ?We may have to reconsider what we think is going in that hidden zone. It?s much more complex than we imagined.?

The crushing pressures in the lower mantle squeeze atoms and electrons so closely together that they interact differently from under normal conditions, even forcing spinning electrons to pair up in orbits. In theory, seismic-wave behavior at those depths may result from the vice-gripping pressure effect on the electron spin-state of iron in lower-mantle materials. Lin?s team performed ultra high-pressure experiments on the most abundant oxide material there, magnesiow?stite (Mg,Fe)O, and found that the changing electron spin states of iron in that mineral drastically affect the elastic properties of magnesiow?stite. The research may explain the complex seismic wave anomalies observed in the lowermost mantle.

As co-author of the study Viktor Struzhkin elaborated: ?This is the first study to demonstrate experimentally that the elasticity of magnesiow?stite significantly changes under lower-mantle pressures ranging from over 500,000 to 1 million times the pressure at sea level (1 atmosphere). Magnesiow?stite, containing 20% iron oxide and 80% magnesium oxide, is believed to constitute roughly 20% of the lower mantle by volume. We found that when subjected to pressures between 530,000 and 660,000 atmospheres the iron?s electron spins went from a high-spin state (unpaired) to a low-spin state (spin-paired). While monitoring the spin-state of iron, we also measured the rate-of-change in the volume (density) of magnesiow?stite through the electronic transition. That information enabled us to determine how seismic velocities will vary across the transition.?

?Surprisingly, bulk seismic waves travel about 15% faster once the electrons of iron are spin-paired in the magnesium-iron oxide,? commented co-author Steven Jacobsen. ?The measured velocity jump across the transition might, therefore, be detectable seismically in the deep mantle.? The experiments were conducted inside a diamond-anvil pressure cell using the intense X-ray light source at the nation’s third-generation synchrotron source, Argonne National Laboratory near Chicago.

?The mysterious lower mantle region can?t be sampled directly. So we have to rely on experimentation and theory. Since what happens in Earth?s interior affects the dynamics of the entire planet, it?s important for us to find out what is causing the unusual behavior of seismic waves in that region,? stated Lin. ?Up to now, earth scientists have understood Earth?s interior by only considering pure oxides and silicates. Our results simply point out that iron, the most abundant transition metal throughout the entire Earth, gives rise to very complex properties in that deep region. We look forward to our next experiments to see if we can refine our understanding of what is happening there,? he concluded.

Original Source: Carnegie Institution News Release

Satellite Can Tell When Ice is Melting

Resolute Bay seen by the Hyperion instrument aboard Earth Observing-1. Image credit: NASA. Click to enlarge
Spring thaw in the Northern Hemisphere was monitored by a new set of eyes this year — an Earth-orbiting NASA spacecraft carrying a new version of software trained to recognize and distinguish snow, ice, and water from space.

Using this software, the Space Technology 6 Autonomous Sciencecraft Experiment autonomously tracked changes in the cryosphere, the section of Earth that is frozen, and relayed the information and images back to scientists.

The software, developed by engineers at NASA’s Jet Propulsion Laboratory, Pasadena, Calif., controls the Earth Observing-1 spacecraft. NASA’s Goddard Space Flight Center, Greenbelt, Md, manages the satellite. The software has taken more than 1,500 images of frozen lakes in Minnesota, Wisconsin, Quebec, Tibet and the Italian Alps, along with sea ice in Arctic and Antarctic bays.

While other spacecraft only capture images when they receive explicit commands to do so, for the last year Earth Observing-1 has been making its own decisions. Based on general guidelines from scientists, the spacecraft automatically tracks events such as volcano eruptions, floods and ice formation. The most recent software upgrade allows the spacecraft to accurately recognize cryosphere changes such as ice melting.

Previously, scientists spent several months developing software for Earth Observing-1 to detect changes in snow, water and ice. The new software is capable of learning by itself, and it took only a few hours for scientists to train it to recognize cryosphere changes. In fact, the new software has learned to classify the images so well that scientists plan to use it for the remainder of the mission.

“This new software is capable of a rudimentary form of learning, much the way a child learns the names of new objects,” said Dominic Mazzoni, the JPL computer scientist who developed the software. “Instead of programming the software using a complicated series of commands and mathematical equations, scientists play the role of a teacher, repeatedly showing the computer different images and giving feedback until it has correctly learned to tell them apart.”

On Earth Observing-1, the software searches for specific cryospheric events and reprograms the spacecraft to capture additional images of the event.

“The software has exceeded all of our expectations,” said Dr. Steve Chien, JPL principal investigator for the Autonomous Sciencecraft Experiment. “We have demonstrated that a spacecraft can operate autonomously, and the software has taken literally hundreds of images without ground intervention.”

Similar software has been used to distinguish between different types of clouds in images captured by JPL’s Multi-angle Imaging SpectroRadiometer, an instrument on NASA’s Terra spacecraft. Automatically identifying types of clouds from space will help scientists better understand Earth’s global energy balance and predict future climate trends.

Future versions of the software also might be used to track dust storms on Mars, search for ice volcanoes on Jupiter?s moon Europa, and monitor activity on Jupiter’s volcanically active moon Io. NASA’s New Millennium Program developed both the satellite and the software. The program is responsible for testing new technologies in space.

For more information on the Autonomous Sciencecraft Experiment on the Internet, visit: http://ase.jpl.nasa.gov .

For more information on the New Millennium Program on the Internet, visit: http://nmp.jpl.nasa.gov .

For information about the Earth Observing-1 spacecraft on the Internet, visit: http://eo1.gsfc.nasa.gov .

Original Source: NASA News Release

Seas are Rising Faster than Ever

Artist illustration of NASA satellite measuring sea levels. Image credit: NASA/JPL. Click to enlarge.
For the first time, NASA has the tools and expertise to understand the rate at which sea level is changing, some of the mechanisms that drive those changes and the effects that sea level change may have worldwide.

“It’s estimated that more than 100 million lives are potentially impacted by a one-meter (3.3-foot) increase in sea level,” said Dr. Waleed Abdalati, head of the Cryospheric Sciences Branch at NASA’s Goddard Space Flight Center, Greenbelt, Md. “When you consider this information, the importance of learning how and why these changes are occurring becomes clear,” he added.

Although scientists have directly measured sea level since the early part of the 20th century, it was not known how many of the observed changes in sea level were real and how many were related to upward or downward movement of the land. Now satellites have changed that by providing a reference by which changes in ocean height can be determined regardless of what the nearby land is doing. With new satellite measurements, scientists are able to better predict the rate at which sea level is rising and the cause of that rise.

“In the last 50 years sea level has risen at an estimated rate of .18 centimeters (.07 inches) per year, but in the last 12 years that rate appears to be .3 centimeters (.12 inches) per year. Roughly half of that is attributed to the expansion of ocean water as it has increased in temperature, with the rest coming from other sources,” said Dr. Steve Nerem, associate professor, Colorado Center for Astrodynamics Research, University of Colorado, Boulder.

Another source of sea level rise is the increase in ice melting. Evidence shows that sea levels rise and fall as ice on land grows and shrinks. With the new measurements now available, it’s possible to determine the rate at which ice is growing and shrinking.

“We’ve found the largest likely factor for sea level rise is changes in the amount of ice that covers the Earth. Three-fourths of the planet’s freshwater is stored in glaciers and ice sheets or the equivalent of about 67 meters (220 feet) of sea level,” said Dr. Eric Rignot, principal scientist for the Radar Science and Engineering Section at NASA’s Jet Propulsion Laboratory, Pasadena, Calif. “Ice cover is shrinking much faster than we thought, with over half of recent sea level rise due to the melting of ice from Greenland, West Antarctica’s Amundsen Sea and mountain glaciers,” he said.

Additionally, NASA scientists and partner researchers now are able to measure and monitor the world’s waters globally in a sustained and comprehensive way using a combination of satellite observations and sensors in the ocean. By integrating the newly available satellite and surface data, scientists are better able to determine the causes and significance of current sea level changes.

“Now the challenge is to develop an even deeper understanding of what is responsible for sea level rise and to monitor for possible future changes. That’s where NASA’s satellites come in, with global coverage and ability to examine the many factors involved,” said Dr. Laury Miller, chief of the National Oceanic and Atmospheric Administration Laboratory for Satellite Altimetry, Washington, D.C.

NASA works with agency partners such as the National Oceanic and Atmospheric Administration and the National Science Foundation to explore and understand sea level change. Critical resources that NASA brings to bear on this issue include such satellites as:

— Topex/Poseidon and Jason, the U.S. portions of which are managed by JPL, which use radar to map the precise features of the oceans’ surface, measuring ocean height and monitoring ocean circulation;

— Ice, Cloud and Land Elevation Satellite (IceSat), which studies the mass of polar ice sheets and their contributions to global sea level change;

— Gravity Recovery And Climate Experiment (Grace), also managed by JPL, which maps Earth’s gravitational field, allowing us to better understand movement of water throughout the Earth.

Original Source: NASA News Release

Satellite View of Istanbul

Radar satellite view of Istanbul. Image credit: ESA. Click to enlarge.
The city of Istanbul, located astride the eastern edge of Europe and western edge of the Asian continent, shown in an Envisat radar multi-temporal composite image.

What is today Europe’s third largest urban centre has been a major city for the last two thousand years. It has known three different names in that time: Byzantium when it was the gateway to Greek settlements on the Black Sea, Constantinople when it became the capital of the Eastern Roman Empire, then Istanbul when it fell to Muslim invaders in 1453.

In 1919 Istanbul lost its position as capital of Turkey, but remains that country’s leading economic centre. Its population has grown from 2.84 million in 1970 to around ten million today, with settlers flocking from rural areas of Anatolia. Around 30% of all the cars owned in Turkey are in Istanbul.

Urban areas show up as white in this image ? the brightest areas being the most densely built-up. Among the densest is the old town, located on the west side of the city on the Emin?nu Peninsula, below the river estuary known as the Golden Horn. Further west along the coast are the runways of Ataturk International Airport.

Istanbul owes its prosperity to its status as a link between the Balkans, the Middle East and Central Asia, and to the high level of shipping that travels through the narrow Bosporus (Bosphorus) channel dividing Europe and Asia.

Some 48 000 ships pass through the Bosporus annually, three times denser than the Suez Canal traffic and four times as dense as the Panama Canal. Around 55 million tonnes of oil are shipped through here each year. Look closely along the Bosporus and bright points from individual ships can be seen. Also visible are the two bridges connecting the two continents, crossed by at least 45 000 vehicles daily.

Note the chain of islands known as the Princes’ Islands (Kizil Islands) off the east side of Istanbul. The city faces onto the inland Sea of Marmara (Marmara Denizi), which has an area of around 11 350 square kilometres. The Bosporus links the Sea to the Black Sea. Note also Lake Iznik (Iznik Golu) towards the south-east corner of the image.

Because radar images measure surface texture rather than reflected light, there is no colour in a standard radar image.

Instead the colour in this image is due to it being a multitemporal composite, made up of three Advanced Synthetic Aperture Radar (ASAR) images acquired on different dates, with separate colours assigned to each acquisition to highlight differences between them: Red for 31 July 2003, Green for 17 April 2003 and blue for 26 February 2004.

The view was acquired in ASAR Image Mode Precision, with pixel sampling of 12.5 metres.

Original Source: ESA News Release