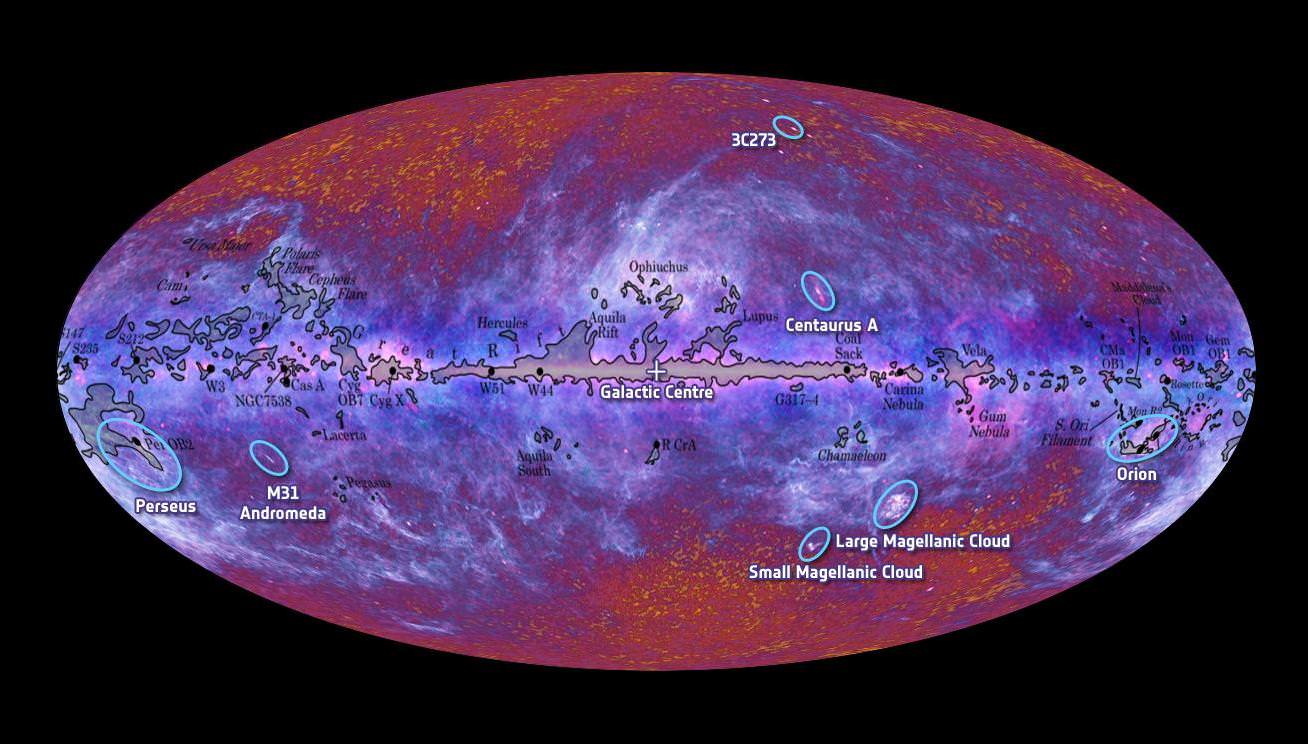
Labelled version of the Planck space observatory's all-sky survey. Credit: ESA.
[/caption]
Remember how you could once pick up a book about the first three minutes after the Big Bang and be amazed by the level of detail that observation and theory could provide regarding those early moments of the universe. These days the focus is more on what happened between 1×10-36 and 1×10-32 of the first second as we try to marry theory with more detailed observations of the cosmic microwave background.
About 380,000 years after the Big Bang, the early universe became cool and diffuse enough for light to move unimpeded, which it proceeded to do – carrying with it information about the ‘surface of last scattering’. Before this time photons were being continually absorbed and re-emitted (i.e. scattered) by the hot dense plasma of the earlier universe – and never really got going anywhere as light rays.
But quite suddenly, the universe got a lot less crowded when it cooled enough for electrons to combine with nuclei to form the first atoms. So this first burst of light, as the universe became suddenly transparent to radiation, contained photons emitted in that fairly singular moment – since the circumstances to enable such a universal burst of energy only happened once.
With the expansion of the universe over a further 13.6 and a bit billion years, lots of these photons probably crashed into something long ago, but enough are still left over to fill the sky with a signature energy burst that might have once been powerful gamma rays but has now been stretched right out into microwave. Nonetheless, it still contains that same ‘surface of last scattering’ information.
Observations tell us that, at a certain level, the cosmic microwave background is remarkably isotropic. This led to the cosmic inflation theory, where we think there was a very early exponential expansion of the microscopic universe at around 1×10-36 of the first second – which explains why everything appears so evenly spread out.
Really, the most remarkable thing about the CMB is its large scale isotropy and finding some fine grain anisotropies is perhaps not that surprising. However, it is data and it gives theorists something from which to build mathematical models about the contents of the early universe.
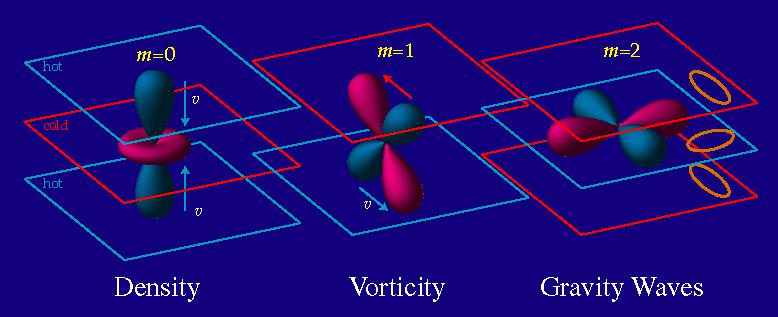
The apparent quadrupole moment anomalies in the cosmic microwave background might result from irregularities in the early universe - including density fluctuations, dynamic movement (vorticity) or even gravity waves. However, a degree of uncertainty and 'noise' from foreground light sources is apparent in the data, making firm conclusions difficult to draw. Credit: University of Chicago.
Some theorists speak of CMB quadrupole moment anomalies. The quadrupole idea is essentially an expression of energy density distribution within a spherical volume – which might scatter light up-down or back-forward (or variations from those four ‘polar’ directions). A degree of variable deflection from the surface of last scattering then hints at anisotropies in the spherical volume that represents the early universe.
For example, say it was filled with mini black holes (MBHs)? Scardigli et al (see below) mathematically investigated three scenarios, where just prior to cosmic inflation at 1×10-36 seconds: 1) the tiny primeval universe was filled with a collection of MBHs; 2) the same MBHs immediately evaporated, creating multiple point sources of Hawking radiation; or 3) there were no MBHs, in accordance with conventional theory.
When they ran the math, scenario 1 best fits with WMAP observations of anomalous quadrupole anisotropies. So, hey – why not? A tiny proto-universe filled with mini black holes. It’s another option to test when some higher resolution CMB data comes in from Planck or other future missions to come. And in the meantime, it’s material for an astronomy writer desperate for a story.
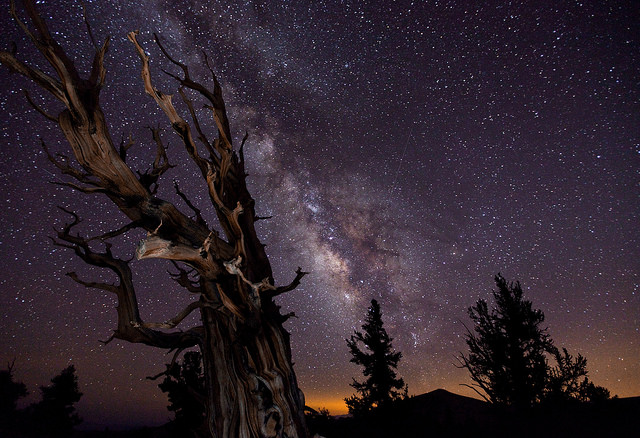
'Blazing Bristlecone' by Tom Lowe of the USA, winner of the 2010 years Astronomy Photographer of the Year competition.
[/caption]
The Royal Observatory Greenwich in the UK was the perfect setting to announce the winners of this year’s Astronomy Photographer of the Year competition, and I was privileged to be in attendance at the ceremony on Thursday evening. “We were really blown away by the quality of all of the almost 500 entries this year,” said Marek Kukula, the public astronomer at the Royal Observatory Greenwich. “So, congratulations to all who entered but in particular, congrats to the 22 winners tonight.”
The overall winner this year was Tom Lowe from the US, with this awe-striking image of our Milky Way. “I have to say, this pictures perfectly captures the spirit of the Astronomy Photographer of the Year competition,” said Kukula at the awards ceremony, “with not only the beautiful composition where the tree follows the arch of the Milky Way, but also the connection between things in space and things on Earth. The Bristlecone pines that you see in the foreground are some of the oldest living things on Earth, but yet they are dwarfed by the light shining behind them that has been traveling for almost 30,000 years. It is just a beautiful concept.”
See more of the winners below.
'Siberian Totality' by Anthony Ayiomamitis, winner of the category 'Our Solar System.'
“After the success of last year’s competition, we challenged everybody again to take the best photographs of the solar system and beyond,” said Dallas Campbell, from “Bang Goes the Theory” on BBC,” who emceed the event along with Kukula. “We asked people to submit photographs in four categories: Earth and Space, Our Solar System, Deep Space, and Young Astronomy Photographer. We also added two new categories: People and Space and Best Newcomer.” Besides being the overall winner, Lowe’s image (top) was the winner of the Earth and Space category.
This stunning image of a total solar eclipse by Anthony Ayiomamitis from Greece won the “Our Solar System” category. “On eclipse day, the clouds were present everywhere and only one hour before first contact (partial phase) did the skies clear,” said Ayiomamitis “…and they cleared beautifully and with pristine transparency. There was a slight wind, especially at the top of the roof of the Institute of Nuclear Physics, but it was a very small price to pay.”
During an eclipse, the Sun’s corona is visible but this image captures even how the Sun’s magnetic fields warp and shape the super-heated gas of the corona into loops and streamers.
Jupiter by Nick Smith, Runner-up in the category 'Our Solar System'
UK amateur astronomer Nick Smith was in attendance at the ceremony, and he was the runner-up in this category with this crisp image of Jupiter. He also received a “highly commended” prize for his image of the Sinus Iridium on the Moon.
'Sinus Iridium' by Nick Smith, Highly Commended in the category 'Our Solar System
I had the chance to talk with Smith, and he said he used a Celestron C14 14-inch Schmidt-Cassegrain telescope with a Tele Vue 1.8x Barlow lens and a Lumenera Infinity 2-1M CCD camera. “I’ve been doing astrophotography for about 5 years,” he said. “Last year I had same results, one runner up and one highly commended, so I’m still waiting for that elusive win!”
'Orion Deep Wide Field' by Rogelio Bernal Andreo (USA), winner of the 'Deep Space' category
This absolutely stunning image taken by Rogelio Bernal Andreo of the USA shows wide angle view of the constellation Orion, with the three bright stars of Orion’s Belt on the left of this image. Here, however, a long exposure reveals an epic vista of dust and gas clouds which are too faint to be seen by the naked eye. This is an immense region of space hundreds of light years across. It contains several well-known astronomical sights, including the Horsehead Nebula (bottom center) and the Orion Nebula (top right).
A Perfect Circle by Dhruv Arvind Paranjpye from India.
The fourth category was for young astrophotographers, and this stunning image of an annular solar eclipse as taken by 14 year old Dhruv Arvind Paranjpye from India. This type of perfect circle occurs when the Moon is too far from the Earth to completely cover the Sun’s disc, and Paranjpye caught the moment perfectly as a bright ring appeared as the uncovered part of the Sun shone around the edges of the Moon, and through a thin veil of clouds.
'Solar Halo' by Laurent V. Joli-Coeur from Canada.
This runner-up winner in the young astronomer category was taken by Laurent V. Joli-Coeur from Canada, who is 13 years old. He was in attendance at the ROG for the awards ceremony, and commented that he was in the family car with his mother when he saw a beautiful solar halo through the roof. “I used my mother’s camera, a simple DLSR camera,” Joli-Coeur told Universe Today. “I asked my mother to stop the car and I took the picture in manual mode, and was very pleased how it turned out.” The camera was a Canon Digital Rebel DSLR camera with a Canon EF-S 18-55 mm lens. I asked if this picture was the first attempt at any astrophotography for him, but he said, “Actually I do a lot of lunar photography, and wide field imaging of the Milky Way and solar halos.” So, look for more images from him in the future.
'The Pelican Nebula Up Close' by Elias Jordan
I had to include this “Highly Commended” image in the young astronomers group by Elias Jordan, aged 15, who I follow on Twitter. “Thanks everyone!” he said on Twitter, “It was hard to keep the news from you for three weeks!”
'Photon Worshippers' by Steven Christenson from the USA.
This is the winning image in a new category this year, “People and Space.” For a few days each year, the setting Sun shines directly through the archway of a large rock formation at Pfeiffer Beach in Big Sur, California, and Steven Christenson caught the event, plus the people watching. One of the judges, Sir Patrick Moore, said “It’s a rare event – it happens only once a year and the photographer has taken full advantage – the composition is fabulous.”
M51, the Whirlpool Galaxy by Ken Mackintosh from the UK.
Another new category this year was “Best Newcomer,” won by Ken Mackintosh from the UK, with this image of the Whirlpool Galaxy.
“I’m lucky,” Mackintosh told Universe Today. “I just started doing astronomical photography a little over a year ago and I say I’m lucky because took this image about a year ago, and just barely scraped into the time constraint. Seeing the images in the other categories, I think next year I’ll really struggle to win anything because the winners this year are just jaw dropping.”
Mackintosh used Canon 450 DSLR, along with a Max Vision 127 telescope. He said he has been interested in astronomy since he was young, but wasn’t active in astronomy for many years. “I went into business and totally lost touch with astronomy until about a year ago when I was cruising around Flickr, and saw this contest, and my interest was totally reignited. Taking images like this, there’s a lot of work and frustration but when you get a good one, it’s totally worth it, and it keeps you going. I’m so glad they’ve started this competition,as it really provided a lot of motivation for me.”
Amazingly, he took this image from his back yard garden in Sussex, so he wants others interested in astrophotography to know that even in urban areas, astronomy and astrophography can be done. “Just in the past few years the equipment has become available at reasonable prices that is powerful enough to take images like this,” he said. “I can’t stress enough this is actually not too difficult to do, so anyone who has had interest in astronomy and photography, it is not that difficult. The difficulty comes in the kind of finesse and artistry to finish the images. It’s almost like the artistic side is as difficult as the technical. But as the technology improves, that side of it will become much easier.”
The Astronomy Photographer of the Year competition started in 2009 for the International Year of Astronomy. It was so popular that the organizers and sponsors decided to do it again this year. You can find info on the websites below on how to enter in 2011.
To see all the winning astronomy pictures in the six categories, see the Royal Observatory Greenwich website, or you can see all the images submitted on the Flickr Astronomy Photographer of the Year page. And if you live in the UK or visit there soon, you can see an exhibit of the Astronomy Photographer of the Year winners at the ROG from now until February 27, 2011.
The ROG is a must-see destination for any astronomy enthusiast, and is a wonderful location that is full of history, beauty and hands-on learning. There you can straddle the Prime Meridian, see early telescopes and time pieces and look across the same beautiful vistas that early British astronomers saw from the hilltop home of the observatory.
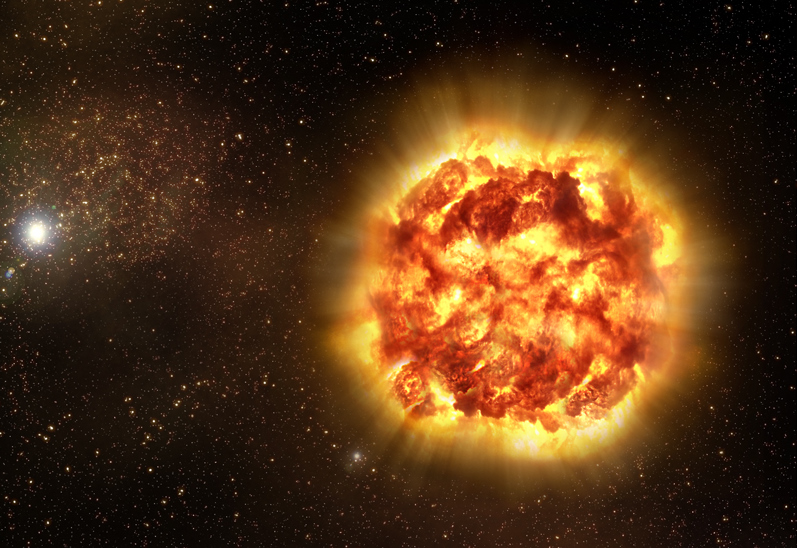
Artist illustration of a supernova. Image credit: ESO
[/caption]
Much of astronomical knowledge is built on the cosmic distance ladder. This ladder is built to determine distances to objects in our sky. Low lying rungs for nearby objects are used to calibrate the methodology for more distant objects which are, in turn, used to calibrate for more distant objects and so on. One of the reason so many runs need to be added is that techniques often become difficult to impossible to used past a certain distance. Cepheid Variables are a fantastic object to allow us to measure distances, but their luminosity is only sufficient to allow us to detect them to a few tens of millions of parsecs. As such, new techniques, based on brighter objects must be developed.
The most famous of these is the use of Type Ia Supernovae (ones that collapse just pass the Chandrasekhar limit) as “standard candles”. This class of objects has a well defined standard luminosity and by comparing its apparent brightness to the actual brightness, astronomers can determine distance via the distance modulus. But this relies on the fortuitous circumstance of having such an event occur when you want to know the distance! Obviously, astronomers need some other tricks up their sleeve for cosmological distances, and a new study discusses the possibility of using another type of supernova (SN II-P) as another form of standard candles.
Type II-P supernovae are classical, core-collapse supernovae that occur when the core of a star has passed the critical limit and can no longer support the mass of the star. But unlike other supernovae, the II-P decays more slowly, leveling off for some time creating a “plateau” in the light curve (which is where the “P” comes from). Although their plateaus are not all at the same brightness, making them initially useless as a standard candle, studies over the past decade have shown that observing other properties may allow astronomers to determine what the brightness of the plateau actually is and making these supernovae “standardizable”.
In particular, discussion has been centering recently around possible connections between the velocity of ejecta and the brightness of the plateau. A study published by D’Andrea et al. earlier this year attempted to link the absolute brightness to the velocities of the Fe II line at 5169 Angstroms. However, this method left large experimental uncertainties which translated to an error of up to 15% of the distance.
A new paper, to be published in October’s issue of the Astrophysical Journal, a new team, led by Dovi Poznanski of the Lawrence Berkley National Laboratory attempts to reduce these errors by utilizing the hydrogen beta line. One of the primary advantages to this is that hydrogen is much more plentiful allowing the hydrogen beta line to stand out whereas the Fe II lines tend to be weak. This improves the signal to noise (S/N) ratio and improves overall data.
Using data from the Sloan Digital Sky Survey (SDSS), the team was able to decrease the error in distance determination to 11%. Although this was an improvement over the D’Andrea et al. study, it is still significantly higher than many other methods for distance determination at similar distances. Poznanski suggests that this data is likely skewed due to a natural bias towards brighter supernovae. This systematic error stems from the fact that the SDSS data is supplemented up with follow-up data which the team employed, but the follow-ups are only conducted if the supernova meets certain brightness criteria. As such, their method is not fully representative of all supernovae of this type.
To improve their calibration and hopefully improve the method, the team plans to continue their study with expanded data from other studies that would be free of such biases. In particular the team intends to use the Palomar Transient Factory to supplement their results.
As the statistics improve, astronomers will gain another rung on the cosmological distance ladder, but only if they’re lucky enough to find one of this type of supernova.
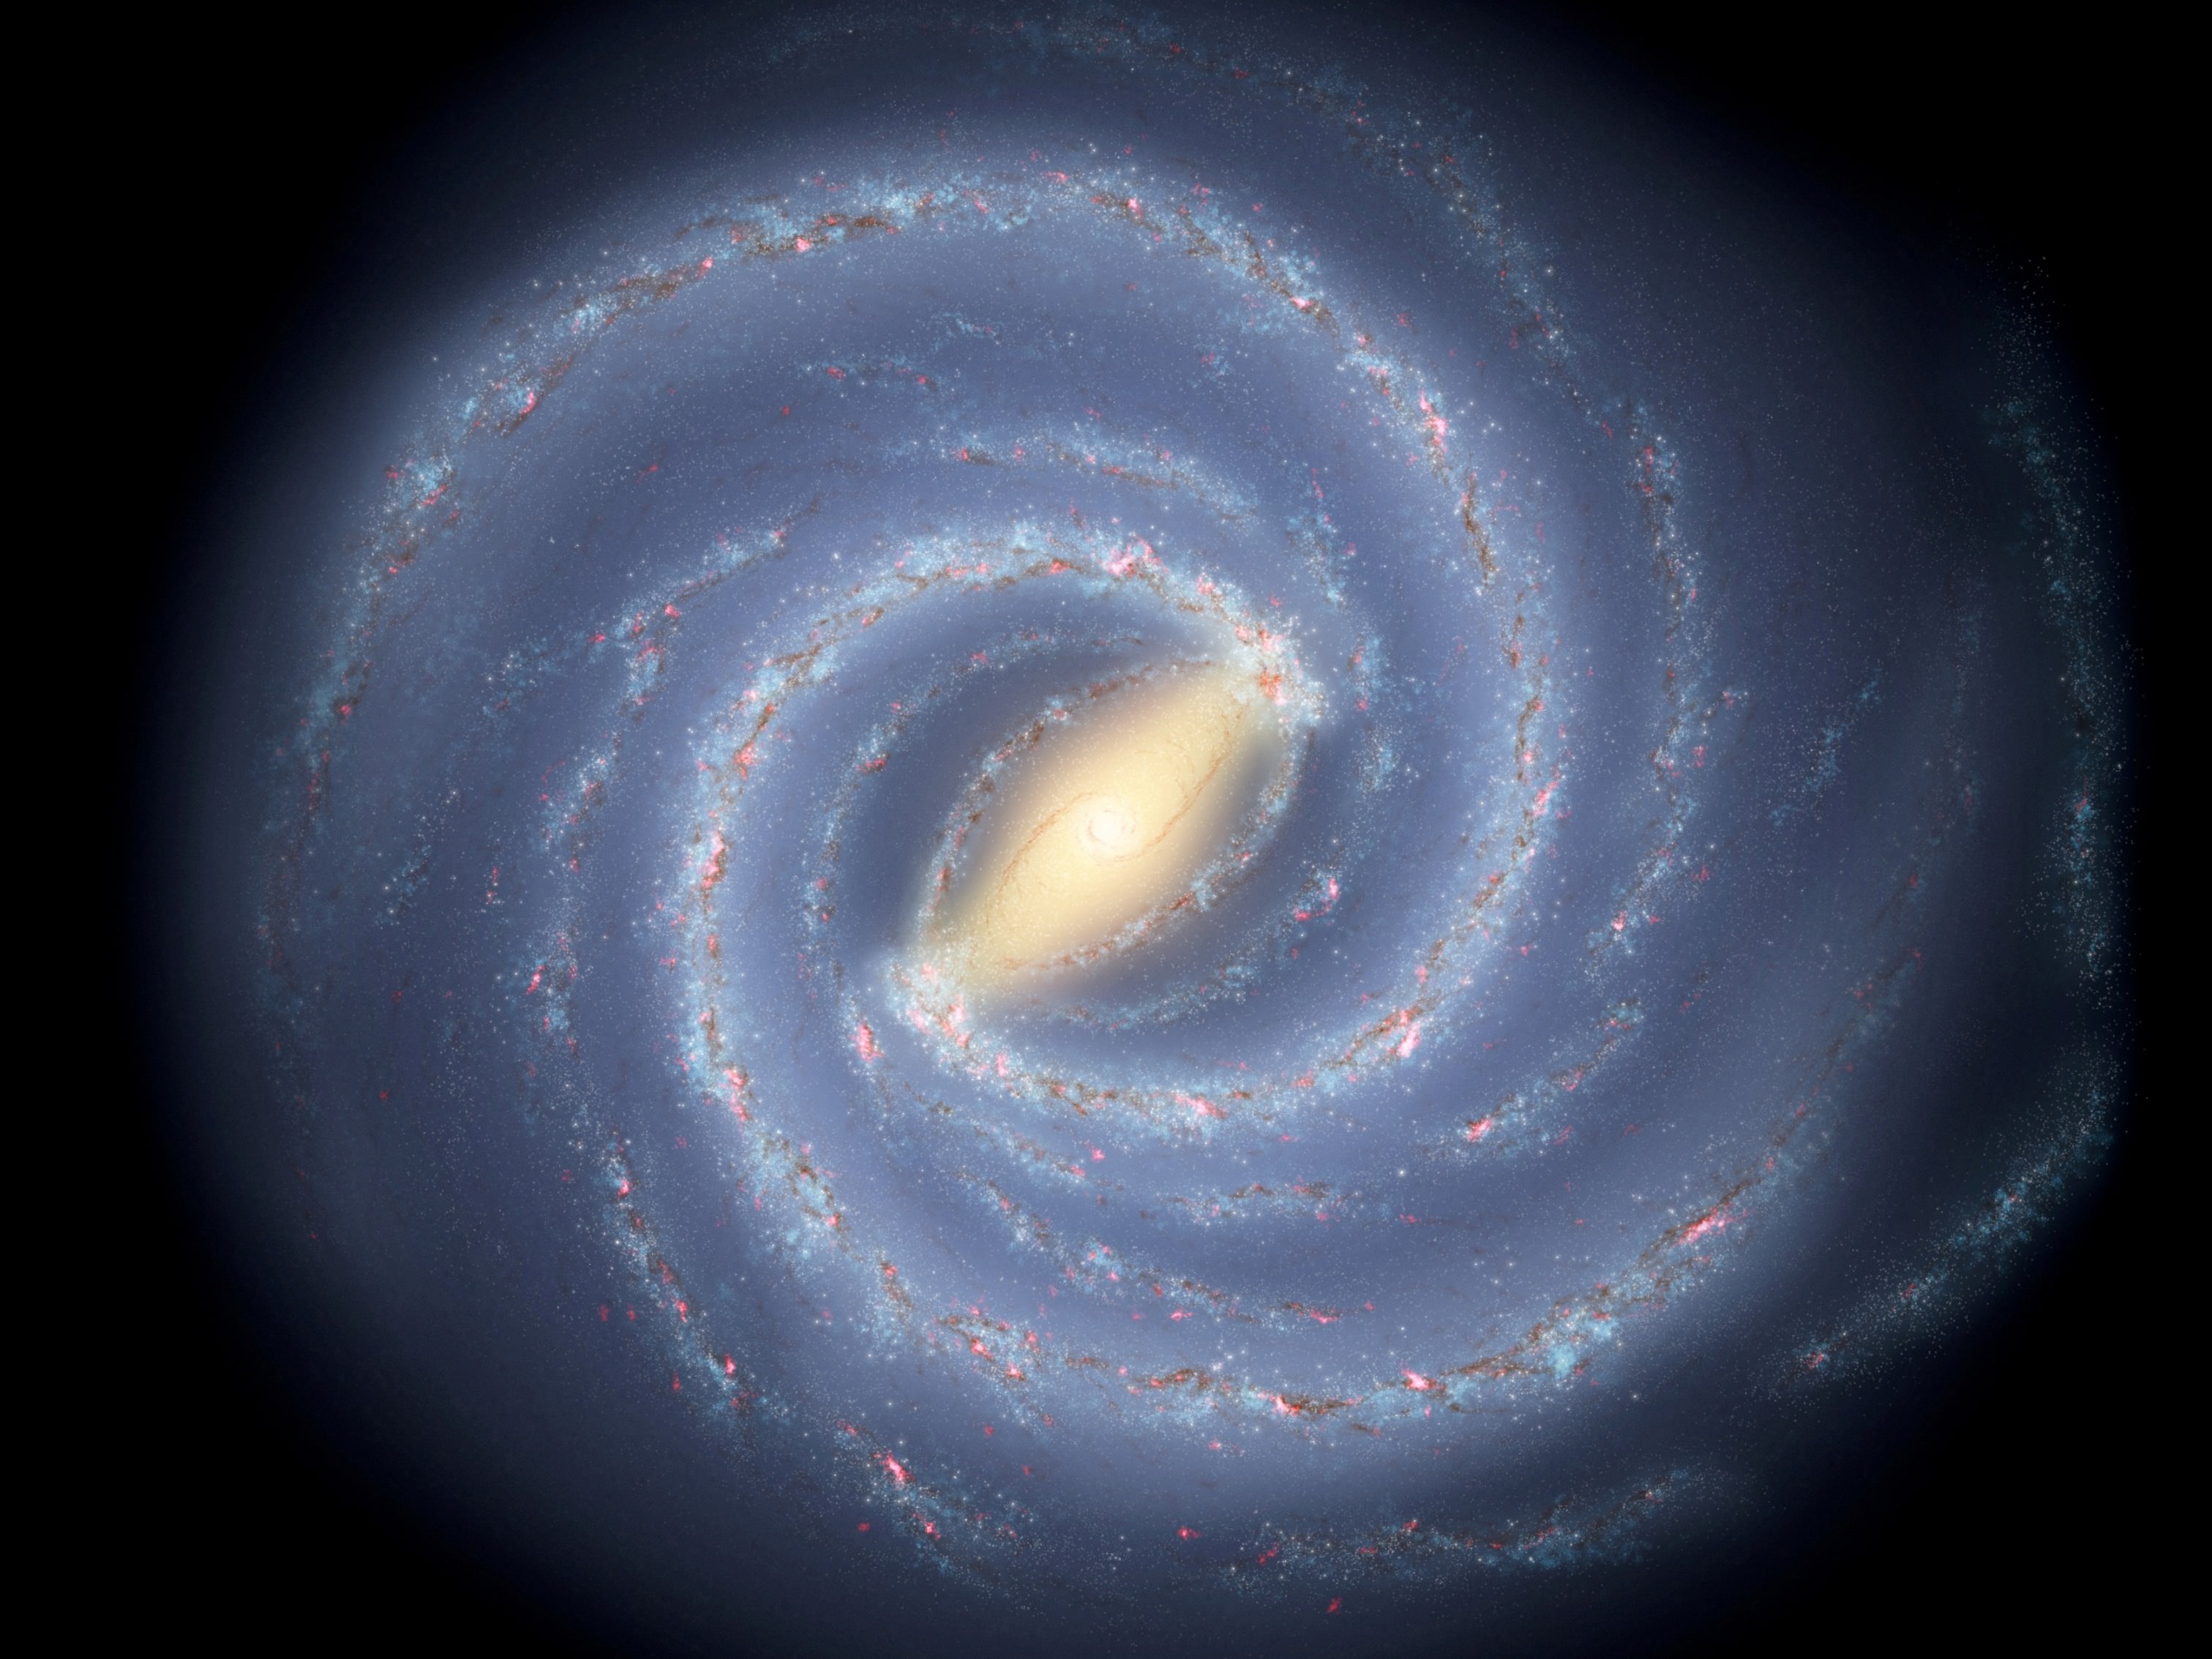
The disk of spiral galaxies is comprised of two main components: The thin disk holds the majority of stars and gas and is the majority of what we see and picture when we think of spiral galaxies. However, hovering around that, is a thicker disk of stars that is much less populated. This thick disk is distinct from the thin disk in several regards: The stars there tend to be older, metal deficient, and orbit the center of the galaxy more slowly.
But where this population of the stars came from has been a long standing mystery since its identification in the mid 1970’s. One hypothesis is that it is the remainder of cannibalized dwarf galaxies that have never settled into a more standard orbit. Others suggest that these stars have been flung from the thin disk through gravitational slingshots or supernovae. A recent paper puts these hypothesis to the observational test.
At a first glance, both propositions seem to have a firm observational footing. The Milky Way galaxy is known to be in the process of merging with several smaller galaxies. As our galaxy pulls them in, the tidal effects shred these minor galaxies, scattering the stars. Numerous tidal streams of this sort have been discovered already. The ejection from the thin disk gains support from the many known “runaway” and “hypervelocity” stars which have sufficient velocity to escape the thin disk, and in some cases, the galaxy itself.
The new study, led by Marion Dierickx of Harvard, follows up on a 2009 study by Sales et al., which used simulations to examine the features stars would take in the thick disk should they be created via these methods. Through these simulations, Sales showed that the distribution of eccentricities of the orbits should be different and allow a method by which to discriminate between formation scenarios.
By using data from the Sloan Digital Sky Survey Data Release 7 (SDSS DR7), Dierickx’s team compared the distribution of the stars in our own galaxy to the predictions made by the various models. Ultimately, their survey included some 34,000 stars. By comparing the histogram of eccentricities to that of Sales’ predictions, the team hoped to find a suitable match that would reveal the primary mode of creation.
The comparison revealed that, should ejection from the thin disk be the norm there were too many stars in nearly circular orbits as well as highly eccentric ones. In general, the distribution was too wide. However, the match for the scenario of mergers fit well lending strong credence to this hypothesis.
While the ejection hypothesis or others can’t be ruled out completely, it suggests that, at least in our own galaxy, they play a rather minor role. In the future, additional tests will likely be employed, analyzing other aspects of this population.
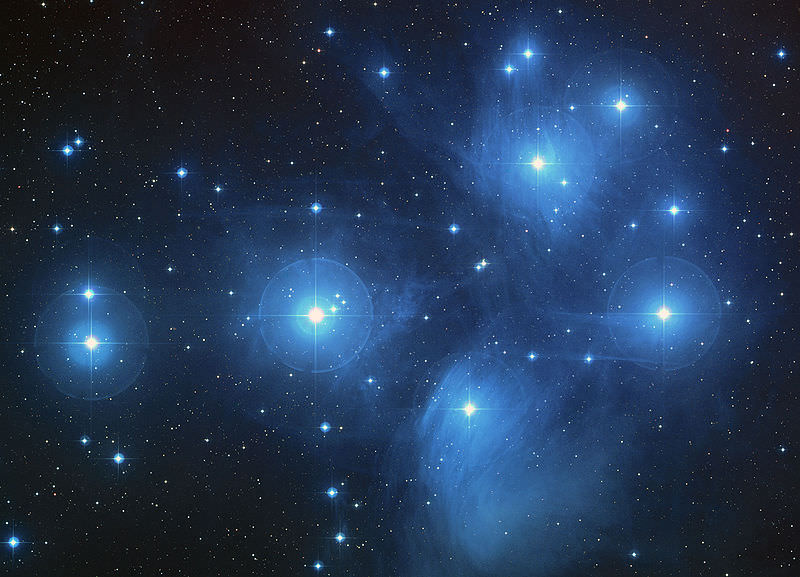
The long standing view on the formation of stars is that they form in clusters. This theory is supported by understanding of the formation process that requires large clouds of gas and dust to be able to condense. Small clouds with enough mass to only form one star just can’t meet the required conditions to condense. In a large cloud, where conditions are sufficient, once one star begins, the feedback effects from this star will trigger other star formation. Thus, if you get one, you’ll likely get lots.
But a new paper takes a critical look at whether or not all stars really form in clusters.
The main difficulty in answering this question boils down to a simple question: What does it mean to be “in” a cluster. Generally, members of a cluster are stars that are gravitationally bound. But as time passes, most clusters shed members as gravitational interactions, both internal and external, remove outer members. This blurs the boundary between being bound and unbound.
Similarly, some objects that can initially look very similar to clusters can actually be groups known as an association. As the name suggests, while these stars are in close proximity, they are not truly bond together. Instead, their relative velocities will cause the the group to disperse without the need for other effects.
As a result, astronomers have considered other requirements to truly be a member of a cluster. In particular for forming stars, there is an expectation that cluster stars should be able to interact with one-another during the formation process.
Its these considerations that this new team uses as a basis, led by Eli Bressert from the University of Exeter. Using observations from Spitzer, the team analyzed 12 nearby star forming regions. By conducting the survey with Spitzer, an infrared telescope, the team was able to pierce the dusty veil that typically hides such young stars.
By looking at the density of the young stellar objects (YSOs) in the plane of the sky, the team attempted to determine just what portion of stars could be considered true cluster members under various definitions. As might be expected, the answer was highly dependent on the definition used. If a loose and inclusive definition was taken, they determined that 90% of YSOs would be considered as part of the forming cluster. However, if the definition was drawn at the narrow end, the percentage dropped as low as 40%. Furthermore, if the additional criterion of needing to be in such proximity that their “formation/evolution (along with their circumstellar disks and/or planets) may be affected by the close proximity of their low-mass neighbours”, the percentage dropped to a scant 26%.
As with other definition boundaries, the quibbling may seem little more than a distraction. However, with such largely varying numbers attached to them, these triflings carry great significance since inconsistent definitions can greatly distort the understanding. This study highlights the need for clarity in definitions for which astronomers constantly struggle in a muddled universe full overlapping populations and shades of gray.
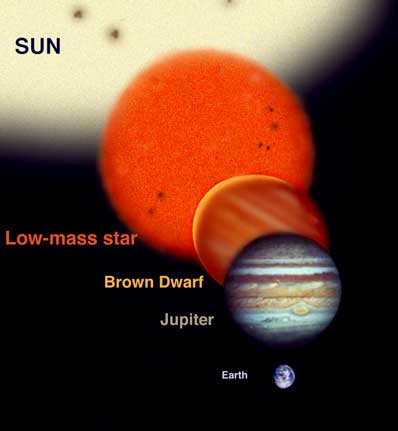
A comparison of the size of Jupiter, a brown dwarf, a small star and the Sun (Gemini Observatory/Artwork by Jon Lomberg)
[/caption]
The definition of a “planet” is one that has seen a great deal of contention. The ad-hoc redefinition has caused much grief for lovers of the demoted Pluto. Yet little attention is paid to the other end of the planetary scale, namely, where the cutoff between a star and a planet lies. The general consensus is that an object capable of supporting deuterium (a form of hydrogen that has a neutron in the nucleus and can undergo fusion at lower temperatures) fusion, is a brown dwarf while, anything below that is a planet. This limit has been estimated to be around 13 Jupiter masses, but while this line in the sand may seem clear initially, a new paper explores the difficulty in pinning down this discriminating factor. For many years, brown dwarfs were mythical creatures. Their low temperatures, even while undergoing deuterium fusion, made them difficult to detect. While many candidates were proposed as brown dwarfs, all failed the discriminating test of having lithium present in their spectrum (which is destroyed by the temperatures of traditional hydrogen fusion). This changed in 1995 when the first object of suitable mass was discovered when the 670.8 nm lithium line was discovered in a star of suitable mass.
Since then, the number of identified brown dwarfs has increased significantly and astronomers have discovered that the lower mass range of purported brown dwarfs seems to overlap with that of massive planets. This includes objects such as CoRoT-3b, a brown dwarf with approximately 22 Jovian masses, which exists in the terminological limbo.
The paper, led by David Speigel of Princeton, investigated a wide range of initial conditions for objects near the deuterium burning limit. Among the variables included, the team considered the initial fraction of helium, deuterium, and “metals” (everything higher than helium on the periodic table). Their simulations revealed that just how much of the deuterium burned, and how fast, was highly dependent on the starting conditions. Objects starting with higher helium concentration required less mass to burn a given amount of deuterium. Similarly, the higher the initial deuterium fraction, the more readily it fused. The differences in required mass were not subtle either. They varied by as much as two Jovian masses, extending as low as a mere 11 times the mass of Jupiter, well below the generally accepted limit.
The authors suggest that because of the inherent confusion in the mass limits, that such a definition may not be the “most useful delineation between planets and brown dwarfs.” As such, they recommend astronomers take extra care in their classifications and realize that a new definition may be necessary. One possible definition could involve considerations of the formation history of objects in the questionable mass range; Objects that formed in disks, around other stars would be considered planets, where objects that formed from gravitational collapse independently of the object they orbit, would be considered brown dwarfs. In the mean time, objects such as CoRoT-3b, will continue to have their taxonomic categorization debated.
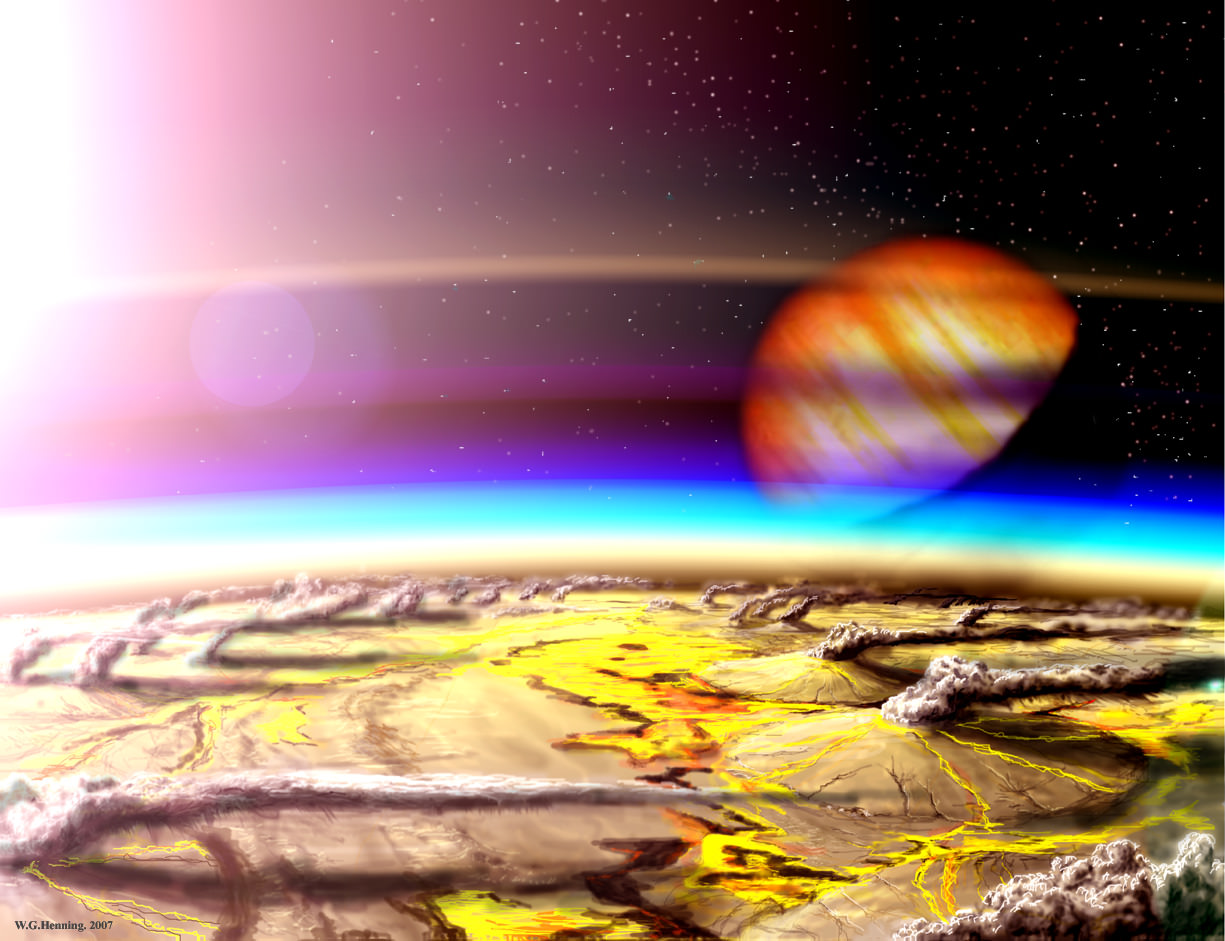
We’ve all seen pictures of erupting terrestrial volcanoes from space, and even eruptions on Jupiter’s moon Io in the outer solar system, but would it be possible to detect an erupting volcano on an exoplanet? Astronomers say the answer is yes! (with a few caveats)
It’s going to be decades before telescopes will be able to resolve even the crudest surface features of rocky extrasolar planets, so don’t hold your breath for stunning photos of alien volcanoes outside our solar system. But astronomers have already been able to use spectroscopy to detect the composition of exoplanet atmospheres, and a group of theorists at the Harvard-Smithsonian Center for Astrophysics think a similar technique could detect the atmospheric signature of exo-eruptions.
By collecting spectra right before and right after the planet goes behind its star, astronomers can subtract out the star’s spectrum and isolate the signal from the planet’s atmosphere. Once this is done, they can look for evidence of molecules common in volcanic eruptions. Models suggest that sulfur dioxide is the best candidate for detection because volcanoes produce it in huge quantities and it lasts in a planet’s atmosphere for a long time.
Still, it won’t be easy.
“You would need something truly earthshaking, an eruption that dumped a lot of gases into the atmosphere,” said Smithsonian astronomer Lisa Kaltenegger. “Using the James Webb Space Telescope, we could spot an eruption 10 to 100 times the size of Pinatubo for the closest stars,” she added.
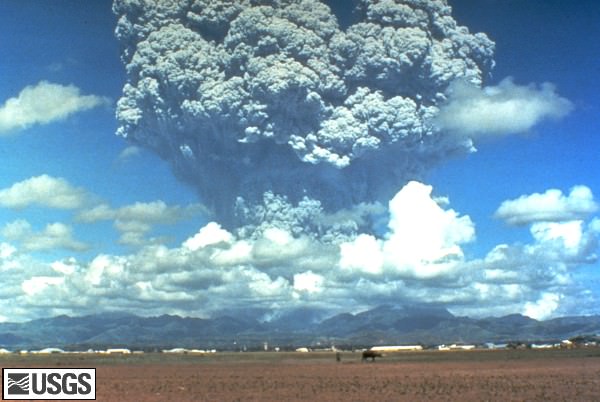
To be detected, exoplanet eruptions would have to be 10 to 100 times larger than the 1991 eruption of Mt. Pinatubo shown here. Image source: USGS
In 1991 Mount Pinatubo in the Philippines belched 17 million tons of sulfur dioxide into the stratosphere. Volcanic eruptions are ranked using the Volcanic Explosivity Index (VEI). Pinatubo ranked ‘colossal’ (VEI of 6) and the largest eruption in recorded history was the ‘super-colossal’ Tambora event in 1815. With a VEI of 7 it was about 10 times as large as Pinatubo. Even larger eruptions (more than 100 times larger than Pinatubo) on Earth are not unheard of: geologic evidence suggests that there have been 47 such eruptions in the past 36 million years, including the eruption of the Yellowstone caldera about 600,000 years ago.
The best candidates for detecting extrasolar volcanoes are super-earths orbiting nearby, dim stars, but the Kaltenegger and her colleagues found that volcanic gases on any earth-like planet up to 30 light years away might be detectable. Now they just have to wait until the James Webb Space Telescope is launched 2014 to test their prediction.
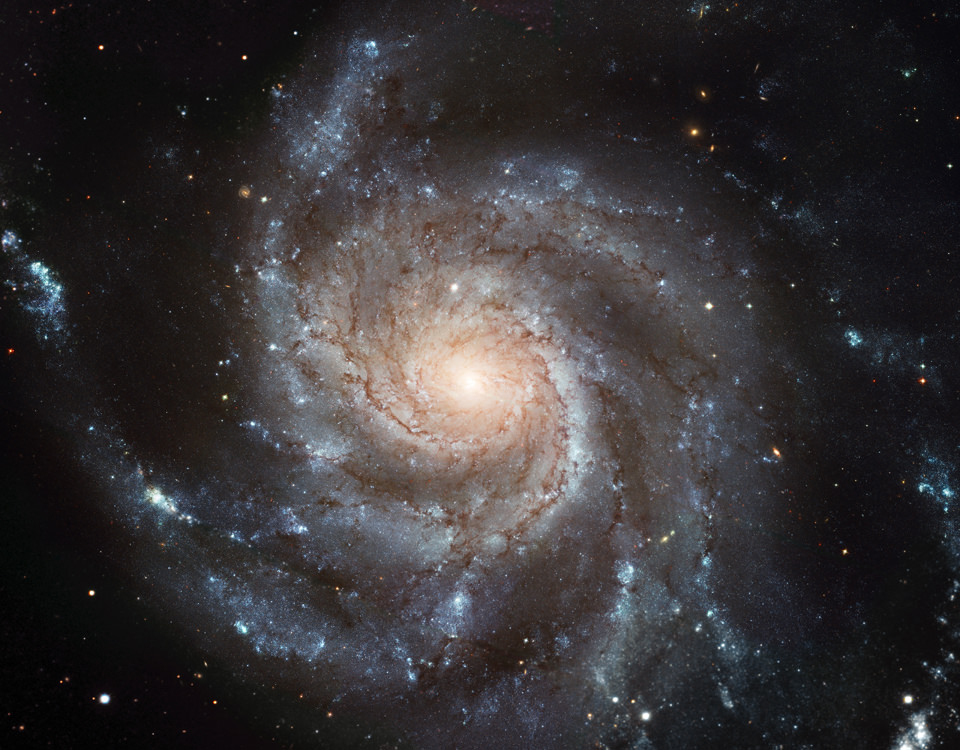
This Hubble image reveals the gigantic Pinwheel Galaxy (M101), one of the best known examples of "grand design spirals". Credit: NASA/ESA
[/caption]
When I tell people I majored in astronomy, the general reaction is one of shock and awe. Although people don’t realize just how much physics it is (which scares them even more when they found out), they’re still impressed that anyone would choose to major in a physical science. Quite often, I’m asked the question, “Why did you choose that major?”
Only somewhat jokingly, I reply, “Because it’s pretty.” For what reasons would we explore something if we did not find some sort of beauty in it? This answer also tends to steer potential follow up questions to topics of images they’ve seen and away from topics from half-heard stories about black holes from sci-fi movies.
The topic of aesthetics in astronomy is one I’ve used here for my own devices, but a new study explores how we view astronomical images and what sorts of information people, both expert and amateur, take from them.
The study was conducted by a group formed in 2008 known as The Aesthetics and Astronomy Group. It is comprised of astrophysicists, astronomy image development professionals, educators, and specialists in the aesthetic and cognitive perception of images. The group asked to questions to guide their study:
How much do variations in presentation of color, explanatory text, and illustrative scales affect comprehension of, aesthetic attractiveness, and time spent looking at deep space imagery?
How do novices differ from experts in terms of how they look at astronomical images?
Data to answer this question was taken from two groups; The first was an online survey taken by volunteers from solicitations on various astronomy websites and included 8866 respondents. The second group was comprised of four focus groups held at the Harvard-Smithsonian Center for Astrophysics.
To analyze how viewers viewed color, the web study contained two pictures of the elliptical galaxy NGC 4696. The images were identical except for the colors chosen to represent different temperatures. In one image, red was chosen to represent hot regions and blue for cold regions. In the other version, the color scheme was reversed. A slight majority (53.3% to 46.7%) responded saying they preferred the version in which blue was assigned to be the hotter color. When asked which image they thought was the “hotter” image, 71.5% responded that the red image was hotter. Since astronomical images are often assigned with blue as the hotter color (since hotter objects emit shorter wavelength light which is towards the blue end of the visible spectrum), this suggests that the public’s perception of such images is likely reversed.
A second image for the web group divided the participants into 4 groups in which an image of a supernova remnant was shown with or without foreground stars and with or without a descriptive caption. When asked to rate the attractiveness, participants rated the one with text slightly higher (7.96 to 7.60 on a 10 point scale). Not surprisingly, those that viewed the versions of the image with captions were more likely to be able to correctly identify the object in the image. Additionally, the version of the image with stars was also more often identified correctly, even without captions, suggesting that the appearance of stars provides important context. Another question for this image also asked the size in comparison to the Earth, Solar System, and Galaxy. Although the caption gave the scale of the SNR in lightyears, the portion that viewed the caption did not fare better when asked to identify the size revealing such information is beyond the limit of usefulness.
The next portion showed an image of the Whirlpool galaxy, M51 and contained either, no text, a standard blurb, a narrative blurb, or a sectionized caption with questions as headers. Taking into consideration the time spent reading the captions, the team found that those with text spent more time viewing the image suggesting that accompanying text encourages viewers to take a second look at the image itself. The version with a narrative caption prompted the most extra time.
Another set of images explored the use of scales by superimposing circles representing the Earth, a circle of 300 miles, both, or neither onto an image of spicules on the Sun’s surface, with or without text. Predictably, those with scales and text were viewed longer and the image with both scales was viewed the longest and had the best responses on a true/false quiz over the information given by the image.
When comparing self-identified experts to novices, the study found that both viewed uncaptioned images for similar lengths of time, but for images with text, novices spent an additional 15 seconds reviewing the image when compared to experts. Differences between styles of presenting text (short blurb, narrative, or question headed), novices preferred the ones in which topics were introduced with questions, whereas experts rated all similarly which suggested they don’t care how the information is given, so long as it’s present.
The focus groups were given similar images, but were prompted for free responses in discussions.
<
p style=”padding-left: 30px;”>[T]he non-professionals wanted to know what the colors represented, how the images were made, whether the images were composites from different satellites, and what various areas of the images were. They wanted to know if M101 could be seen with a home telescope, binoculars, or the naked eye.
Additionally, they were also interested in historical context and insights from what professional astronomers found interesting about the images.
Professionals, on the other hand, responded with a general pattern of “I want to know who made this image and what it was that they were trying to convey. I want to judge whether this image is doing a good job of telling me what it is they
wanted me to get out of this.” Eventually, they discussed the aesthetic nature of the images which reveals that “novices … work from aesthetics to science, and for astrophysicists … work from science to aesthetics.”
Overall, the study found an eager public audience that was eager to learn to view the images as not just pretty pictures, but scientific data. It suggested that a conversational tone that worked up to technical language worked best. These findings can be used to improve communication of scientific objectives in museums, astrophotography sections of observatories, and even in presentation of astronomical images and personal conversation.
I’ve had a couple of people excitedly show me the Star Walk astronomy app on their iPhones and ipads, and it really is great. You can hold your device up to the sky and it will show you a sky map of your exact position. Move your device around the sky, and it moves with you. It is a very high quality, dynamic and realistic stargazing guide, which — if you are a beginning or experienced astronomer — makes skywatching easy for everybody! There is also a “Solar Walk” app — which has very cool 3D images, so grab your 3D glasses to fully enjoy. See more about this app below. Continue reading “Win ‘Star Walk’ and ‘Solar Walk’ Astronomy Apps”
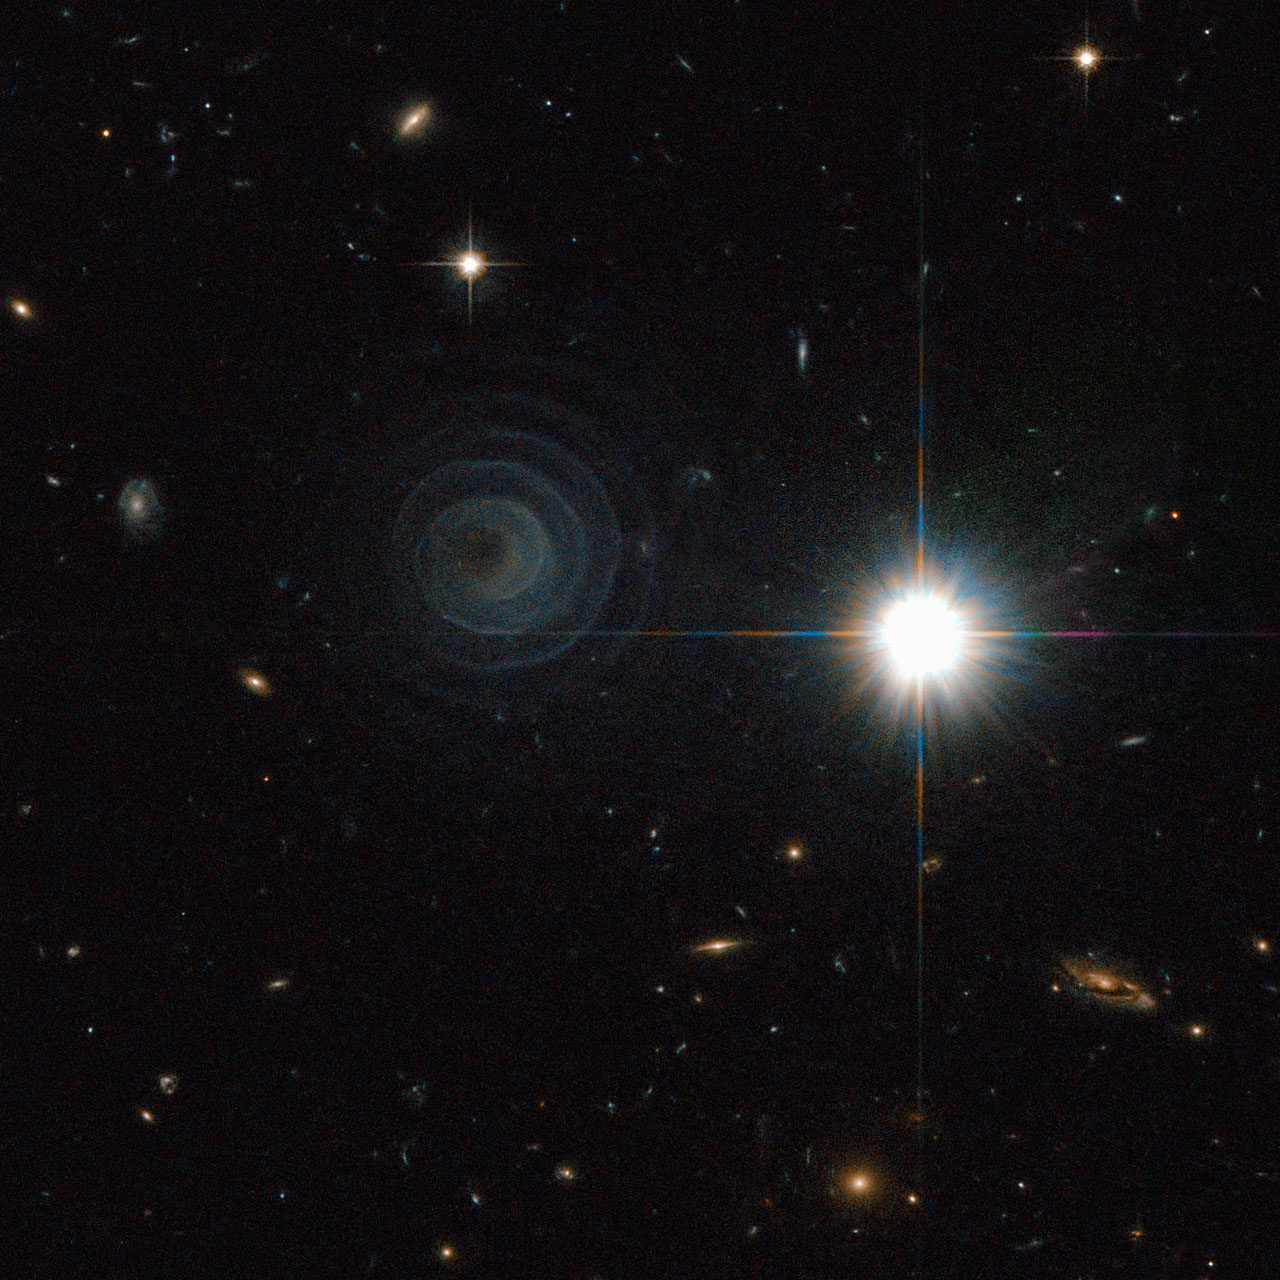
An Extraordinary Celestial Spiral. Credit: ESA/NASA & R. Sahai
[/caption]
The Hubble Space Telescope’s Advanced Camera for Surveys has captured a remarkable image of a spiral in space. No, not a spiral galaxy, (and not another Norway Spiral!) but the formation of an unusual pre-planetary nebula in one of the most perfect geometrical spirals ever seen. The nebula, called IRAS 23166+1655, is forming around the star LL Pegasi (also known as AFGL 3068) in the constellation of Pegasus.
The image shows what appears to be a thin spiral pattern of amazing precision winding around the star, which is itself hidden behind thick dust. Mark Morris from UCLA and an international team of astronomers say that material forming the spiral is moving outwards at a speed of about 50,000 km/hour and by combining this speed with the distance between layers, they calculate that the shells are each separated by about 800 years.
The spiral pattern suggests a regular periodic origin for the nebula’s shape, and astronomers believe that shape is forming because LL Pegasi is a binary star system. One star is losing material as it and the companion star are orbiting each other. The spacing between layers in the spiral is expected to directly reflect the orbital period of the binary, which is estimated to be also about 800 years.
A progression of quasi-concentric shells has been observed around a number of preplanetary nebulae, but this almost perfect spiral shape is unique.
Morris and his team say that the structure of the AFGL 3068 envelope raises the possibility that binary companions are responsible for quasi-concentric shells in most or all of the systems in which they have been observed, and the lack of symmetry in the shells seen elsewhere can perhaps be attributed to orbital eccentricity, to different projections of the orbital planes, and to unfavorable illumination geometries.
Additionally – and remarkably — this object may be illuminated by galactic light.
This image appears like something from the famous “Starry Night” painting by Vincent van Gogh, and reveals what can occur with stars that have masses about half that of the Sun up to about eight times that of the Sun. They do not explode as supernovae at the ends of their lives, but instead can create these striking and intricate features as their outer layers of gas are shed and drift into space. This object is just starting this process and the central star has yet to emerge from the cocoon of enveloping dust.


, winner of the 'Deep Space' category.")