Calling All Volunteers to Help Digitize Astronomical History

An example of a telescope logbook waiting to be transcribed. Credit: Smithsonian

An old brick building on Harvard’s Observatory Hill is overflowing with rows of dark green cabinets — each one filled to the brim with hundreds of astronomical glass plates in paper sleeves: old-fashioned photographic negatives of the night sky.

All in all there are more than 500,000 plates preserving roughly a century of information about faint happenings across the celestial sphere. But they’re gathering dust. So the Harvard College Observatory is digitizing its famed collection of glass plates. One by one, each plate is placed on a scanner capable of measuring the position of each tiny speck to within 11 microns. The finished produce will lead to one million gigabytes of data.

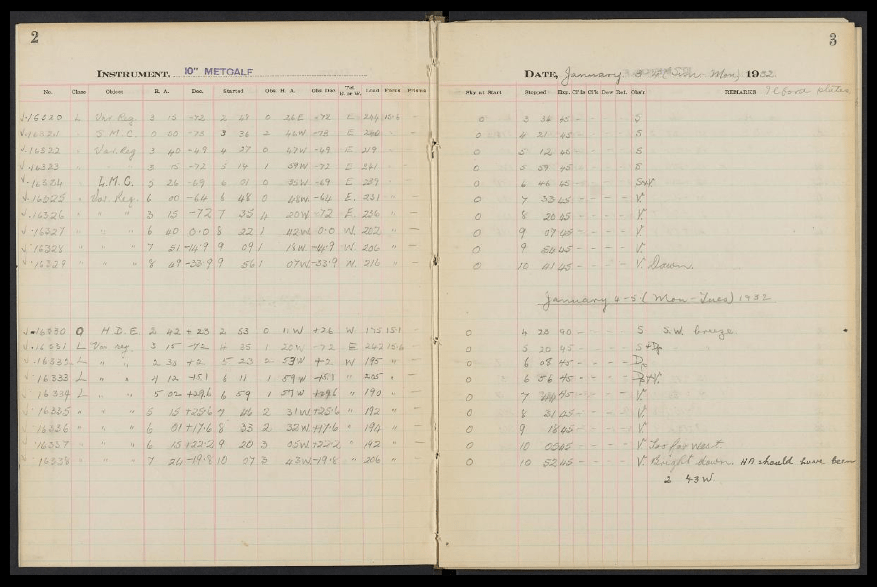
But each plate must be linked to a telescope logbook — handwritten entries recording details like the date, time, exposure length, and location in the sky. Now, Harvard is seeking your help to transcribe these logbooks.

The initial project is called Digital Access to a Sky Century at Harvard (DASCH). Although it has been hard at work scanning roughly 400 plates per day, without the logbook entries to accompany each digitized plate, information about the brightness and position of each object would be lost. Whereas with that information it will be possible to see a 100-year light curve of any bright object within 15 degrees of the north galactic pole.

The century of data allows astronomers to detect slow variations over decades, something otherwise impossible in today’s recent digital era.

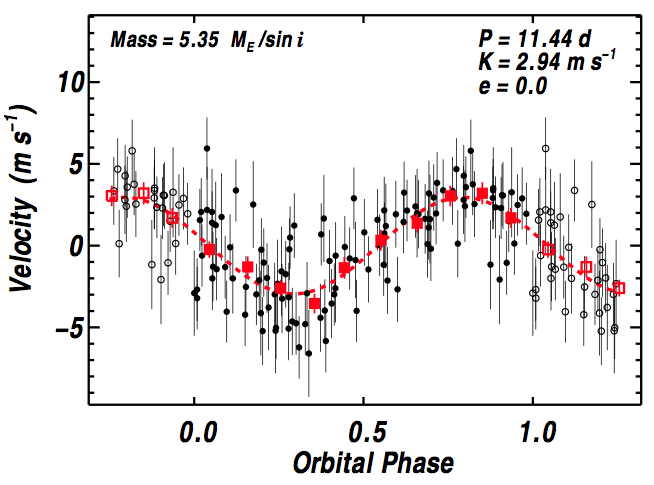
Assistant Curator David Sliski is especially excited about the potential overlap in our hunt for exoplanets. “It covers the Kepler field beautifully,” Sliski told Universe Today. It should also be completed by the time next-generation exoplanet missions (such as TESS, PLATO, and Kepler 2) come online — allowing astronomers to look for long-term variability in a host star that may potentially affect an exoplanet’s habitability.

There are more than 100 logbooks containing about 100,000 pages of text. Volunteers will type in a few numbers per line of text onto web-based forms. It’s a task impossible for any scanner since optical character recognition doesn’t work on these hand-written entries.

Harvard is partnering with the Smithsonian Transcription Center to recruit digital volunteers. The two will then be able to bring the historic documents to a new, global audience via the web. To participate in this new initiative, visit Smithsonian’s transcription site here.

A Lurking Companion Star Explains Enigmatic Supernova

The above sequence depicts a rare supernova explosion. The topic panel

Massive stars end their lives dramatically. Once the nuclear fuel deep within their cores is spent, there’s no longer any outward pressure to push against gravity, and the star collapses. But while the inner layers fall in to form a black hole or a neutron star, the outer layers fall faster, hitting the inner layers, and rebounding in a huge supernova explosion.

That’s the textbook definition. But some of these supernovae defy explanation. In 2011 one such explosion, dubbed SN 2011dh, pierced the Whirlpool galaxy, roughly 24 million-light years away. At the time astronomers were baffled. But now, thanks to NASA’s Hubble Space Telescope, they’ve discovered a companion star to this rare supernova and fit the final puzzle pieces together.

SN 2011dh is a Type IIb supernova, unusual in that it contains very little hydrogen and unexplainable via a textbook definition. Even so, astronomers can shed light on the progenitor star simply by digging through archived images from HST. Thanks to HST’s wealth of data and the fact that it observes the Whirlpool galaxy often, two independent research teams both detected a source — a yellow supergiant star — at the right location.

But astronomers don’t think yellow supergiant stars are capable of becoming supernovae … at least not in isolation.

At this point, controversy arose within the astronomical community. Several experts proposed that the observation was a false cosmic alignment and that the actual progenitor was an unseen massive star. Other experts proposed that the progenitor could have been the yellow supergiant, but that it must have belonged in a binary star system.

When a massive star in a binary system overflows its Roche lobe — the region outside that star where gravity dominates — it can pour material onto its smaller companion, therefore losing its hydrogen envelope and shrinking in mass.

At the time the mass-donor explodes, the companion star should be a massive blue star, having gained material during the mass transfer. Its high temperature should also cause it to emit mostly in the ultraviolet range, therefore rendering it invisible in any visible images.

So Gastón Folatelli from the Kavli Institute for the Physics and Mathematics of the Universe (IPMU) and colleagues decided to take a second look at the mysterious supernova in ultraviolet light. And their observations matched their expectations. The original supernova had faded, and a different point source had taken its place.

“One of the most exciting moments in my career as an astronomer was when I displayed the newly arrived HST images and saw the object right there, where we had anticipated it to be all along,” said Folatelli in a news release.

The research illustrates the intricate interplay between theory and observation. Astronomers often rely on theories long before they gain the technology necessary to provide the correct observations or spend years trying to explain odd observations with complex theoretical modeling. More often, however, the two coexist as theory and observation banter back and forth.

The findings have been published in the Astrophysical Journal Letters and are available online.

Gliese 15Ab: The Closest Known Super-Earth?

An artist’s rendering of the newly discovered exoplanet OGLE-2013-BLG-0341LBb (far right) orbiting one star (right) of a binary red dwarf star system, from an Earth-type distance of approximately 0.9 Astronomical Units away. Image Credit: Cheongho Han, Chungbuk National University, Republic of Korea

Our solar neighborhood is rich with planetary systems. Within 20 light-years we’ve detected sizzling gas giants and rocky planets orbiting closer to their host star than Mercury orbits the Sun.

Astronomers have now added one more to the list, and this one — a super-Earth dubbed Gliese 15Ab — ranks as one of the closest known exoplanets, circling its host star only 11.7 light-years away.

Gliese 15 is a binary system, with two cool, dim red dwarfs orbiting each other. Although red dwarfs are the most common type of star in the galaxy, they’re so intrinsically faint that not a single one (including the closest star to the Sun, Proxima Centauri) is visible to the naked eye.

Although Gliese 15A might appear faint from Earth, it is overwhelmingly bright compared to its barely reflective exoplanet. So unfortunately we can’t easily see the exoplanet directly. But it does leave an imprint on its host star. Its small gravitational tug makes Gliese 15A wobble ever so slightly as both orbit a mutual center of mass, known as the barycenter.

The star’s movement is then imprinted on its spectrum. As Gliese 15A moves away from the Earth, its spectral lines stretch to redder wavelengths. But as it moves toward the Earth, its spectral lines compress to shorter wavelengths.

Screen Shot 2014-09-08 at 3.52.34 PM
The radial velocities for Gliese 15Ab. Image Credit: Howard et al.

The change is minute. But the Keck 10-meter telescope, with an extremely high-resolution detector, can see such small changes. And from this tiny wobble, Andrew Howard and colleagues calculated that the planet is 5.35 times the mass of Earth and orbits its star in only 11.44 days, making it a hot super-Earth. And remember, it’s only 11.7 light-years away.

A handful of other planet candidates have been found that are closer, but all — including Gliese 15Ab — have yet to be confirmed by other research teams. In the long run, it may turn out that this hot super-Earth is the closest planet to our pale blue dot. Then again, it may not. That’s how science works.

Nonetheless, Gliese 15Ab might prove to be an exciting target for one of the new planet imagers that came online within the past year.

The findings will be published in the Astrophysical Journal and are available online.

A New Marker Might Better Track the Solar Cycle

This image from the Solar and Heliospheric Observatory (SOHO) Extreme ultraviolet Imaging Telescope (EIT) image shows large magnetically active regions and a pair of curving erupting prominences on June 28, 2000 during the current solar cycle 23 maximum. Prominences are huge clouds of relatively cool dense plasma suspended in the Sun's hot, thin corona. Magnetically active regions cause the principal total solar irradiance variations during each solar cycle. The hottest areas appear almost white, while the darker red areas indicate cooler temperatures. Credit: NASA & European Space Agency (ESA)
The Sun. Credit: NASA & European Space Agency (ESA)

Approximately every 11 years the Sun becomes violently active, putting on a show of magnetic activity for aurora watchers and sungazers alike. But the timing of the solar cycle is far from precise, making it hard to determine the exact underlying physics.

Typically astronomers use sunspots to map the course of the solar cycle, but now an international team of astronomers have discovered a new marker: brightpoints, small bright spots in the solar atmosphere that allow us to observe the constant turmoil of material inside the Sun.

The new markers provide a new method in understanding how the Sun’s magnetic field evolves over time, suggesting a deeper and longer cycle.

A well-behaved Sun flips its north and south magnetic poles every 11 years. The cycle begins when the field is weak and dipolar. But the Sun’s rotation is faster at its equator than at its poles, and this difference stretches and tangles the magnetic field lines, ultimately producing sunspots, prominences, and sometimes flares.

“Sunspots have been the perennial marker for understanding the mechanisms that rule the sun’s interior,” said lead author Scott McIntosh, from the National Center for Atmospheric Research, in a news release. “But the processes that make sunspots are not well understood, and far less, those that govern their migration and what drives their movement.”

So McIntosh and colleagues developed a new tracking devise: spots of extreme ultraviolet and X-ray light, known as brightpoints in the Sun’s atmosphere, or corona.

“Now we can see there are bright points in the solar atmosphere, which act like buoys anchored to what’s going on much deeper down,” said McIntosh. “They help us develop a different picture of the interior of the sun.”

McIntosh and colleagues dug through the wealth of data available from the Solar and Heliospheric Observatory and the Solar Dynamics Observatory. They noticed that multiple bands of these markers also move steadily toward the equator over time. But they do so on a different timescale than sunspots.

At solar minimum there might be two bands in the northern hemisphere (one positive and one negative) and two bands in the southern hemisphere (one negative and one positive). Due to their close proximity, bands of opposite charge easily cancel one another, causing the Sun’s magnetic system to be calmer, producing fewer sunspots and eruptions.

But once the two low-latitude bands reach the equator, their polarities cancel each other out and the bands abruptly disappear — a process that takes 19 years on average.

The Sun is now left with just two large bands that have migrated to about 30 degrees latitude. Without the nearby band, the polarities don’t cancel. At this point the Sun’s calm face begins to become violently active as sunspots start to grow rapidly.

Solar maximum only lasts so long, however, because the process of generating a new band of opposite polarity has already begun at high latitudes.

In this scenario, it is the magnetic band’s cycle that truly defines the solar cycle. “Thus, the 11-year solar cycle can be viewed as the overlap between two much longer cycles,” said coauthor Robert Leamon, from Montana State University in Bozeman.

The true test, however, will come with the next solar cycle. McIntosh and colleagues predict that the Sun will enter a solar minimum somewhere in the last half of 2017, and the first sunspots of the next cycle will appear near the end of 2019.

The findings have been published in the Sept. 1 issue of the Astrophysical Journal and are available online.

One Planet, Two Stars: A System More Common Than Previously Thought

An artist's conception of a circumbinary planet. Credit: NASA/JPL-Caltech/T. Pyle

There are few environments more hostile than a planet circling two stars. Powerful tidal forces from the stars can easily destroy the rocky building blocks of planets or grind a newly formed planet to dust. But astronomers have spotted a handful of these hostile worlds.

A new study is even suggesting that these extreme systems exist in abundance, with roughly half of all exoplanets orbiting binary stars.

NASA’s crippled Kepler space telescope is arguably the world’s most successful planet hunter, despite the sudden end to its main mission last May. For nearly four years, Kepler continuously monitored 150,000 stars searching for tiny dips in their light when planets crossed in front of them.

As of today, astronomers have confirmed nearly 1,500 exoplanets using Kepler data alone. But Kepler’s database is immense. And according to the exoplanet archive there are over 7,000 “Kepler Objects of Interest,” dubbed KOIs, that might also be exoplanets.

There are a seeming endless number of questions waiting to be answered. But one stands out: how many exoplanets circle two stars? Binary stars have long been known to be commonplace — about half of the stars in the Milky Way are thought to exist in binary systems.

A team of astronomers, led by Elliott Horch from Southern Connecticut State University, has shown that stars with exoplanets are just as likely to have a binary companion. In other words, 40 to 50 percent of the host stars are actually binary stars.

“It’s interesting and exciting that exoplanet systems with stellar companions turn out to be much more common than was believed even just a few years ago,” said Horch in a news release.

The research team made use of the latest technology, speckle imaging, to take a second look at KOI stars and search for any companion stars. In using this technique, astronomers obtain rapid images of a small portion of the sky surrounding the star. They then combine the images using a complex set of algorithms, which yields a final picture with a resolution better than the Hubble Space Telescope.

Speckle imaging allows astronomers to detect companion stars that are up to 125 times fainter than the target, but only a small distance away (36,000 times smaller than the full Moon). For the majority of Kepler stars, this equates to finding a companion within 100 times the distance from the Sun to the Earth.

The team was surprised to find that roughly half of their targets had companion stars.

“An interesting consequence of this finding is that in the half of the exoplanet host stars that are binary we can not, in general, say which star in the system the planet actually orbits,” said coauthor Steve B. Howell from the NASA Ames Research Center.

The new findings, soon to be published in the Astrophysical Journal, further advance our need to understand these exotic systems and the harrowing environments they face.

Meet Laniakea, Our Home Supercluster

A slice of the Laniakea Supercluster in the supergalactic equatorial plane -- an imaginary plane containing many of the most massive clusters in this structure. The colors represent density within this slice, with red for high densities and blue for voids -- areas with relatively little matter. Individual galaxies are shown as white dots. Velocity flow streams within the region gravitationally dominated by Laniakea are shown in white, while dark blue flow lines are away from the Laniakea local basin of attraction. The orange contour encloses the outer limits of these streams, a diameter of about 160 Mpc. This region contains the mass of about 100 million billion suns. Credit: SDvision interactive visualization software by DP at CEA/Saclay, France.

Our cosmic address extends well beyond Earth, past the Milky Way and toward the farthest reaches of the universe. But now astronomers are adding another line: the Laniakea Supercluster, which takes its name from the Hawaiin term “lani” meaning heaven and “akea” meaning spacious or immeasurable.

And the name is true to its meaning. The supercluster extends more than 500 million light-years and contains the mass of 100 quadrillion Suns in 100,000 large galaxies. This research is the first to trace our local supercluster on such a large scale.

“We have finally established the contours that define the supercluster of galaxies we can call home,” said lead researcher R. Brent Tully, from the University of Hawaii’s Institute for Astrophysics, in a news release. “This is not unlike finding out for the first time that your hometown is actually part of much larger country that borders other nations.”

Superclusters — aggregates of clusters of galaxies — rank among the largest structures in the universe. Although these structures are interconnected in a web of filaments, their exact outlines and boundaries are hard to define.

Large three-dimensional maps (think Sloan Digital Sky Survey) calculate a galaxy’s location based on its galactic redshift, the shifts in its spectrum due to its apparent motion as space itself expands. But Tully and colleagues used peculiar redshifts, the shifts in a galaxy’s spectrum due to the local gravitational landscape, instead.

In other words, the team is mapping the galaxies by examining their impact on the motions of other galaxies. A galaxy caught in the midst of multiple galaxies will find itself in a massive tug-of-war, where the balance of the surrounding gravitational forces will dictate its motion.

Typically this method is only viable for the local universe where the peculiar velocities are high enough compared with the expansion velocities, which increase with distance (a galaxy recedes faster the farther away it is). But Tully and colleagues used a new algorithm, which revealed the large-scale patterns created by galaxies’ motions.

Not only did this allow them to map our home supercluster, but to clarify the role of the Great Attractor, a dense region in the vicinity of Centaurus, Norma, and Hydra clusters that influences the motion of our Local Group and other groups of galaxies. They revealed that the Great Attractor is a large gravitational valley that draws all galaxies inward.

The team also discovered other structures, including a region named Shapley, toward which Laniakea is moving.

The findings have been published in the Sept. 4 issue of Nature.

Radio Telescopes Resolve Pleiades Distance Debate

An optical image of the Pleiades. Credit: NOAO / AURA / NSF

Fall will soon be at our doorstep. But before the leaves change colors and the smell of pumpkin fills our coffee shops, the Pleiades star cluster will mark the new season with its earlier presence in the night sky.

The delicate grouping of blue stars has been a prominent sight since antiquity. But in recent years, the cluster has also been the subject of an intense debate, marking a controversy that has troubled astronomers for more than a decade.

Now, a new measurement argues that the distance to the Pleiades star cluster measured by ESA’s Hipparcos satellite is decidedly wrong and that previous measurements from ground-based telescopes had it right all along.

The Pleiades star cluster is a perfect laboratory to study stellar evolution. Born from the same cloud of gas, all stars exhibit nearly identical ages and compositions, but vary in their mass. Accurate models, however, depend greatly on distance. So it’s critical that astronomers know the cluster’s distance precisely.

A well pinned down distance is also a perfect stepping stone in the cosmic distance ladder. In other words, accurate distances to the Pleiades will help produce accurate distances to the farthest galaxies.

With parallax technique, astronomers observe object at opposite ends of Earth's orbit around the Sun to precisely measure its distance. CREDIT: Alexandra Angelich, NRAO/AUI/NSF.
With the parallax technique, astronomers observe object at opposite ends of Earth’s orbit around the Sun to precisely measure its distance. Credit: Alexandra Angelich, NRAO / AUI / NSF

But accurately measuring the vast distances in space is tricky. A star’s trigonometric parallax — its tiny apparent shift against background stars caused by our moving vantage point — tells its distance more truly than any other method.

Originally the consensus was that the Pleiades are about 435 light-years from Earth. However, ESA’s Hipparcos satellite, launched in 1989 to precisely measure the positions and distances of thousands of stars using parallax, produced a distance measurement of only about 392 light-years, with an error of less than 1%.

“That may not seem like a huge difference, but, in order to fit the physical characteristics of the Pleiades stars, it challenged our general understanding of how stars form and evolve,” said lead author Carl Melis, of the University of California, San Diego, in a press release. “To fit the Hipparcos distance measurement, some astronomers even suggested that some type of new and unknown physics had to be at work in such young stars.”

If the cluster really was 10% closer than everyone had thought, then the stars must be intrinsically dimmer than stellar models suggested. A debate ensued as to whether the spacecraft or the models were at fault.

To solve the discrepancy, Melis and his colleagues used a new technique known as very-long-baseline radio interferometry. By linking distant telescopes together, astronomers generate a virtual telescope, with a data-gathering surface as large as the distances between the telescopes.

The network included the Very Long Baseline Array (a system of 10 radio telescopes ranging from Hawaii to the Virgin Islands), the Green Bank Telescope in West Virginia, the William E. Gordon Telescope at the Arecibo Observatory in Puerto Rico, and the Effelsberg Radio Telescope in Germany.

“Using these telescopes working together, we had the equivalent of a telescope the size of the Earth,” said Amy Miouduszewski, of the National Radio Astronomy Observatory (NRAO). “That gave us the ability to make extremely accurate position measurements — the equivalent of measuring the thickness of a quarter in Los Angeles as seen from New York.”

After a year and a half of observations, the team determined a distance of 444.0 light-years to within 1% — matching the results from previous ground-based observations and not the Hipparcos satellite.

“The question now is what happened to Hipparcos?” Melis said.

The spacecraft measured the position of roughly 120,000 nearby stars and — in principle — calculated distances that were far more precise than possible with ground-based telescopes. If this result holds up, astronomers will grapple with why the Hipparcos observations misjudged the distances so badly.

ESA’s long-awaited Gaia observatory, which launched on Dec. 19, 2013, will use similar technology to measure the distances of about one billion stars. Although it’s now ready to begin its science mission, the mission team will have to take special care, utilizing the work of ground-based radio telescopes in order to ensure their measurements are accurate.

The findings have been published in the Aug. 29 issue of Science and is available online.

Astronomers Spot Pebble-Size Dust Grains in the Orion Nebula

Radio/optical composite of the Orion Molecular Cloud Complex showing the OMC-2/3 star-forming filament. GBT data is shown in orange. Uncommonly large dust grains there may kick-start planet formation. Credit: S. Schnee, et al.; B. Saxton, B. Kent (NRAO/AUI/NSF); We acknowledge the use of NASA's SkyView Facility located at NASA Goddard Space Flight Center.

Stars and planets form out of vast clouds of dust and gas. Small pockets in these clouds collapse under the pull of gravity. But as the pocket shrinks, it spins rapidly, with the outer region flattening into a disk.

Eventually the central pocket collapses enough that its high temperature and density allows it to ignite nuclear fusion, while in the turbulent disk, microscopic bits of dust glob together to form planets. Theories predict that a typical dust grain is similar in size to fine soot or sand.

In recent years, however, millimeter-size dust grains — 100 to 1,000 times larger than the dust grains expected — have been spotted around a few select stars and brown dwarfs, suggesting that these particles may be more abundant than previous thought. Now, observations of the Orion nebula show a new object that may also be brimming with these pebble-size grains.

The team used the National Science Foundation’s Green Bank Telescope to observe the northern portion of the Orion Molecular Cloud Complex, a star-forming region that spans hundreds of light-years. It contains long, dust-rich filaments, which are dotted with many dense cores. Some of the cores are just starting to coalesce, while others have already begun to form protostars.

Based on previous observations from the IRAM 30-meter radio telescope in Spain, the team expected to find a particular brightness to the dust emission. Instead, they found that it was much brighter.

“This means that the material in this region has different properties than would be expected for normal interstellar dust,” said Scott Schnee, from the National Radio Astronomy Observatory, in a press release. “In particular, since the particles are more efficient than expected at emitting at millimeter wavelengths, the grains are very likely to be at least a millimeter, and possibly as large as a centimeter across, or roughly the size of a small Lego-style building block.”

Such massive dust grains are hard to explain in any environment.

Around a star or a brown dwarf, it’s expected that drag forces cause large particles to lose kinetic energy and spiral in toward the star. This process should be relatively fast, but since planets are fairly common, many astronomers have put forth theories to explain how dust hangs around long enough to form planets. One such theory is the so-called dust trap: a mechanism that herds together large grains, keeping them from spiraling inward.

But these dust particles occur in a rather different environment. So the researchers propose two new intriguing theories for their origin.

The first is that the filaments themselves helped the dust grow to such colossal proportions. These regions, compared to molecular clouds in general, have lower temperatures, high densities, and lower velocities — all of which encourage grain growth.

The second is that the rocky particles originally grew inside a previous generation of cores or even protoplanetary disks. The material then escaped back into the surrounding molecular cloud.

This finding further challenges theories of how rocky, Earth-like planets form, suggesting that millimeter-size dust grains may jump-start planet formation and cause rocky planets to be much more common than previously thought.

The paper has been accepted for publication in the Monthly Notices of the Royal Astronomical Society.

First Glimpse of a Young Galactic Core Forming in the Early Universe

This image shows observations of a newly discovered galaxy core dubbed GOODS-N-774, taken by the NASA/ESA Hubble Space Telescope's Wide Field Camera 3 and Advanced Camera for Surveys. The core is marked by the box inset, overlaid on a section of the Hubble GOODS-N, or GOODS North, field (Great Observatories Origins Deep Survey). Credit: NASA, ESA, and E. Nelson (Yale University, USA)

Astronomers have spotted, for the first time, a dense galactic core blazing with the light of millions of newborn stars in the early universe.

The finding sheds light on how elliptical galaxies, the large, gas-poor gatherings of older stars, may have first formed in the early universe. It’s a question that has eluded astronomers for decades.

The research team first uncovered the compact galactic core, dubbed GOODS-N-774, in images from the Hubble Space Telescope. Later observations from the Spitzer Space Telescope, the Herschel Space Observatory, and the W.M. Keck Observatory helped make this a true scientific finding.

The core formed 11 billion years ago, when the universe was less than 3 billion years old. Although only a fraction of the size of the Milky Way, at that time it already contained above twice as many stars as our own galaxy.

Theoretical simulations suggest that giant elliptical galaxies form from the inside out, with a large core marking the very first stages of formation. But most searches for these forming cores have come up empty handed, making this a first observation and a phenomenal find.

“We really hadn’t seen a formation process that could create things that are this dense,” explained lead author Erica Nelson from Yale University in a press release. “We suspect that this core-formation process is a phenomenon unique to the early universe because the early universe, as a whole, was more compact. Today, the universe is so diffuse that it cannot create such objects anymore.”

Alongside determining the galaxy’s size from the Hubble images, the team dug into archived far-infrared images from Spitzer and Herschel to calculate how fast the compact galaxy is creating stars. It seems to be producing 300 stars per year, a rate 30 times greater than the Milky Way.

The frenzied star formation likely occurs because the galactic core is forming deep inside a gravitational well of dark matter. Its unusually high mass constantly pulls gas in, compressing it and sparking star formation.

But these bursts of star formation create dust, which blocks the visible light. This helps explain why astronomers haven’t seen such a distant core before, as they may have been easily missed in previous surveys.

The team thinks that shortly after the early time period we can see, the core stopped forming stars. It likely then merged with other smaller galaxies, until it transformed into a much greater galaxy, similar to the more massive and sedate elliptical galaxies we see today.

“I think our discovery settles the question of whether this mode of building galaxies actually happened or not,” said coauthor Pieter van Dokkum from Yale University. “The question now is, how often did this occur?”

The team suspects that other galactic cores are abundant, but hidden behind their own dust. Future infrared telescopes, such as the James Webb Space Telescope, should be able to find more of these early objects.

The paper was published Aug. 27 in Nature and is available online.

What Lit up the Universe? Astronomers May be on the Brink of an Answer

A computer model shows one scenario for how light is spread through the early universe on vast scales (more than 50 million light years across). Astronomers will soon know whether or not these kinds of computer models give an accurate portrayal of light in the real cosmos. Credit: Andrew Pontzen/Fabio Governato

Most scientists can see, hear, smell, touch or even taste their research. But astronomers can only study light — photons traveling billions of light-years across the cosmos before getting scooped up by an array of radio dishes or a single parabolic mirror orbiting the Earth.

Luckily the universe is overflowing with photons across a spectrum of energies and wavelengths. But astronomers don’t fully understand where most of the light, especially in the early universe, originates.

Now, new simulations hope to uncover the origin of the ultraviolet light that bathes — and shapes — the early cosmos.

“Which produces more light? A country’s biggest cities or its many tiny towns?” asked lead author Andrew Pontzen in a press release. “Cities are brighter, but towns are far more numerous. Understanding the balance would tell you something about the organization of the country. We’re posing a similar question about the universe: does ultraviolet light come from numerous but faint galaxies, or from a smaller number of quasars?”

Answering this question will give us a valuable insight into the way the universe built its galaxies over time. It will also help astronomers calibrate their measurements of dark energy, the mysterious agent that is somehow accelerating the universe’s expansion.

The problem is that most of intergalactic space is impossible to see directly. But quasars — brilliant galactic centers fueled by black holes rapidly accreting material — shine brightly and illuminate otherwise invisible matter. Any intervening gas will absorb the quasar’s light and leave dark lines in the arriving spectrum.

“Because they can be seen at such great distances, quasars are a useful probe for finding out the properties of the universe,” said Pontzen. “Distant quasars can be used as a backlight, and the properties of the gas between them and us are imprinted on the light.

Multiple clouds of intervening hydrogen gas leave a “forest” of hydrogen absorption lines in the quasar’s spectrum. But, crucially, not all gas in the universe contributes to these dark lines. When hydrogen is bombarded by ultraviolet light, it becomes ionized — the electron separates from the proton — which renders it transparent.

So the pattern of absorption lines visible in a quasar’s spectrum map out the location of neutral and ionized regions in between the quasar and the Earth.

This pattern will tell astronomers the main contributing light source in the early universe. Quasars are fairly limited in number but individually extremely bright. If they caused most of the radiation, the pattern will be far from uniform, with some areas nearly transparent and others strongly opaque. But if galaxies, which are far more numerous but much dimmer, caused most of the radiation, the pattern will be very uniform, with evenly spaced absorption lines.

Current samples of quasars aren’t quite big enough for a robust analysis of the subtle differences between the two scenarios. But Pontzen and colleagues show that a number of new surveys should shed light on the question.

The team is hopeful the DESI (Dark Energy Spectroscopic Instrument) survey, which will look at about a million distant quasars in order to better understand dark energy, will also show the distribution of intervening gas.

“It’s amazing how little is known about the objects that bathed the universe in ultraviolet radiation while galaxies assembled into their present form,” said coauthor Hiranya Peiris. “This technique gives us a novel handle on the intergalactic environment during this critical time in the Universe’s history.”

The paper was published Aug. 27 in the Astrophysical Journal Letters and is available online.