Dan Majaess is a Canadian astronomer based in Halifax, Nova Scotia. He researches the cosmic distance scale, pulsating stars, star clusters, and terrestrial mass extinctions linked to asteroid/comet impacts.
The UNESCO World Heritage Site of Persopolis, Iran (image credit: Oshin D. Zakarian/TWAN).
Citizen scientists have discovered planets beyond our Solar System and established morphological classifications for thousands of galaxies (e.g., the Planet Hunters and Galaxy Zoo projects). At an upcoming meeting of planetary scientists, Hamed Pourkhorsandi from the University of Tehran will present his efforts to mobilize citizens to identify impact craters throughout Persia. Pourkhorsandi said he is recruiting volunteers to identify craters using Google Earth, while continuing to seek sightings of fireballs cited in ancient books and among rural folk. Discovering impact craters is an important endeavour, since it helps astronomers estimate how many asteroids of a particular size strike Earth over a given time (i.e., the impact frequency). Indeed, that is especially relevant in light of the recent meteor explosion over Russia this past February (see the UT article here), which hints at the potentially destructive nature of such occurrences.
Satellite images have facilitated the detection of impact sites such as the Kamil and Puka craters, which were identified by V. de Michele and D. Hamacher using Google Earth, respectively (see the UT article here). Pourkhorsandi noted that, “Free access to satellite images has led to the investigation of earth’s surface by specialists and nonspecialists, attempts that have led to the discovery of new impact craters around the globe. [Yet] few researches on this topic have been done in the Middle East.” Incidentally, citizens are likewise being recruited to classify craters and features on other bodies in the Solar System (e.g., the Moon Zoo project).
The Kamil impact crater in Egypt was discovered by V. de Michele using Google Earth, and H. Pourkhorsandi is recruiting volunteers to discover such structures throughout Persia following a similar approach (image credit: L. Folco).
In his paper, Pourkhorsandi describes examples of two targets investigated thus far: “1. a circular structure with a diameter of 200 m (33°21’57”N 58°14’24”E). [However,] there is no sign of … meteoritic fragments in the region that are primary diagnostic indicators for small size impact craters.” The second target is tied to an old tale, and note that the Puka crater in Australia was identified by following-up on an old Aboriginal story. However, Pourkhorsandi states that a field study of the second target (28°24’52” N 60°34’44” E) revealed that the crater is not associated with an impactor from space.
“Beside these structures, field studies on other craters in Persia are in progress, the outcomes of which will be announced in the near future,” said Pourkhorsandi.
Pourkhorsandi underscores that numerous meteorites have been found in desert regions throughout the world, yet scant attention has been given to Persian deserts (e.g., the Lut desert). The Lut desert in Persia extends over several thousand square kilometres and is one of the hottest places on Earth (featuring land surface temperatures upwards of 70 degrees Celsius). Pourkhorsandi noted that in 2005 a ‘curious stone’ was recovered in the Lut desert and subsequent work revealed its extraterrestrial origin.
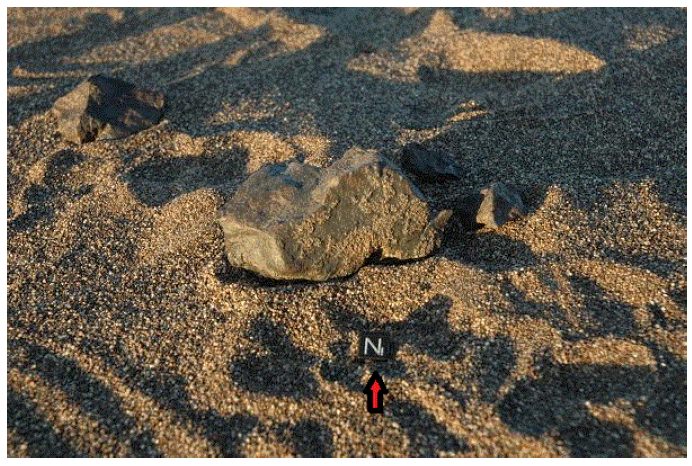
He went on to remark that, “Three recent short field trips to the central Lut desert led to the collection of several meteoritic fragments, which points to large concentrations of meteoritic materials in the area.” Some of those fragments are shown in the figure below, and the broader region is likely a pertinent place for citizen scientists to continue the hunt for impact craters in Persia.
Pourkhorsandi concluded by telling the Universe Today, “In the future we aim to expand our efforts with the help of additional people, and will direct individuals to scan other regions of the planet. Simultaneously, we have commenced a comprehensive analysis of meteorites in the Lut desert with fellow European scientists.”
H chondrite fragments found in the Lut desert (in Persia) are argued to be extraterrestrial in origin (image credit: Fig. 3 in Pourkhorsandi 2013/LPI).
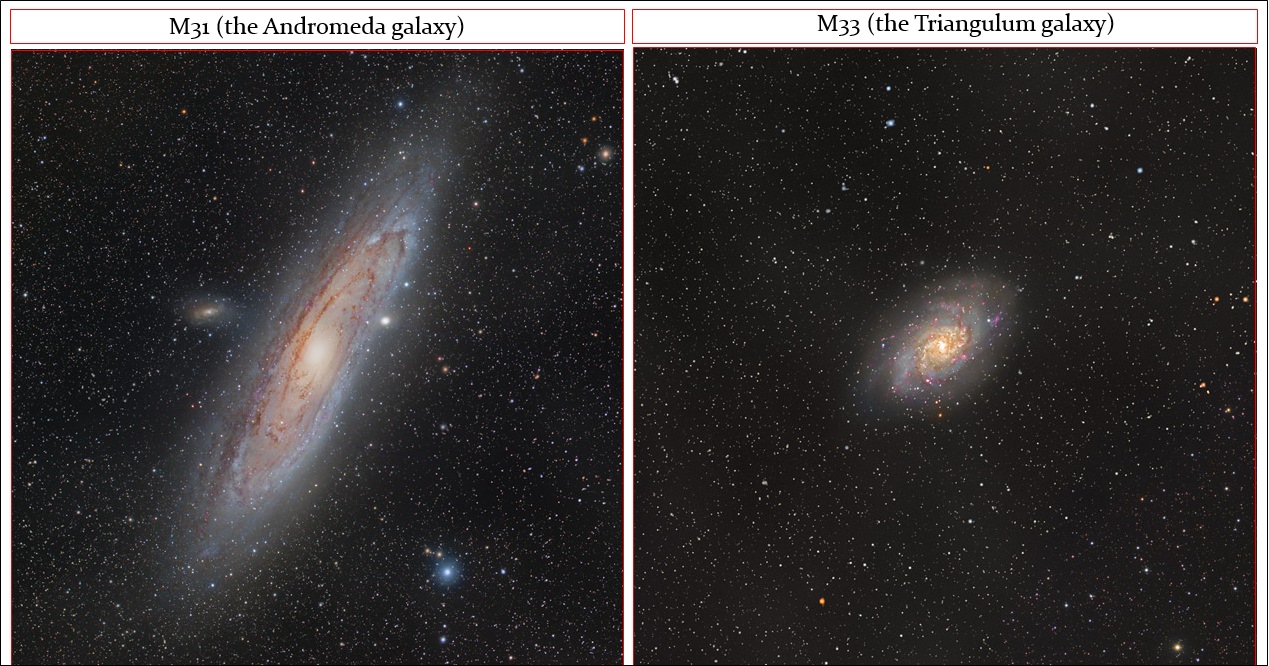
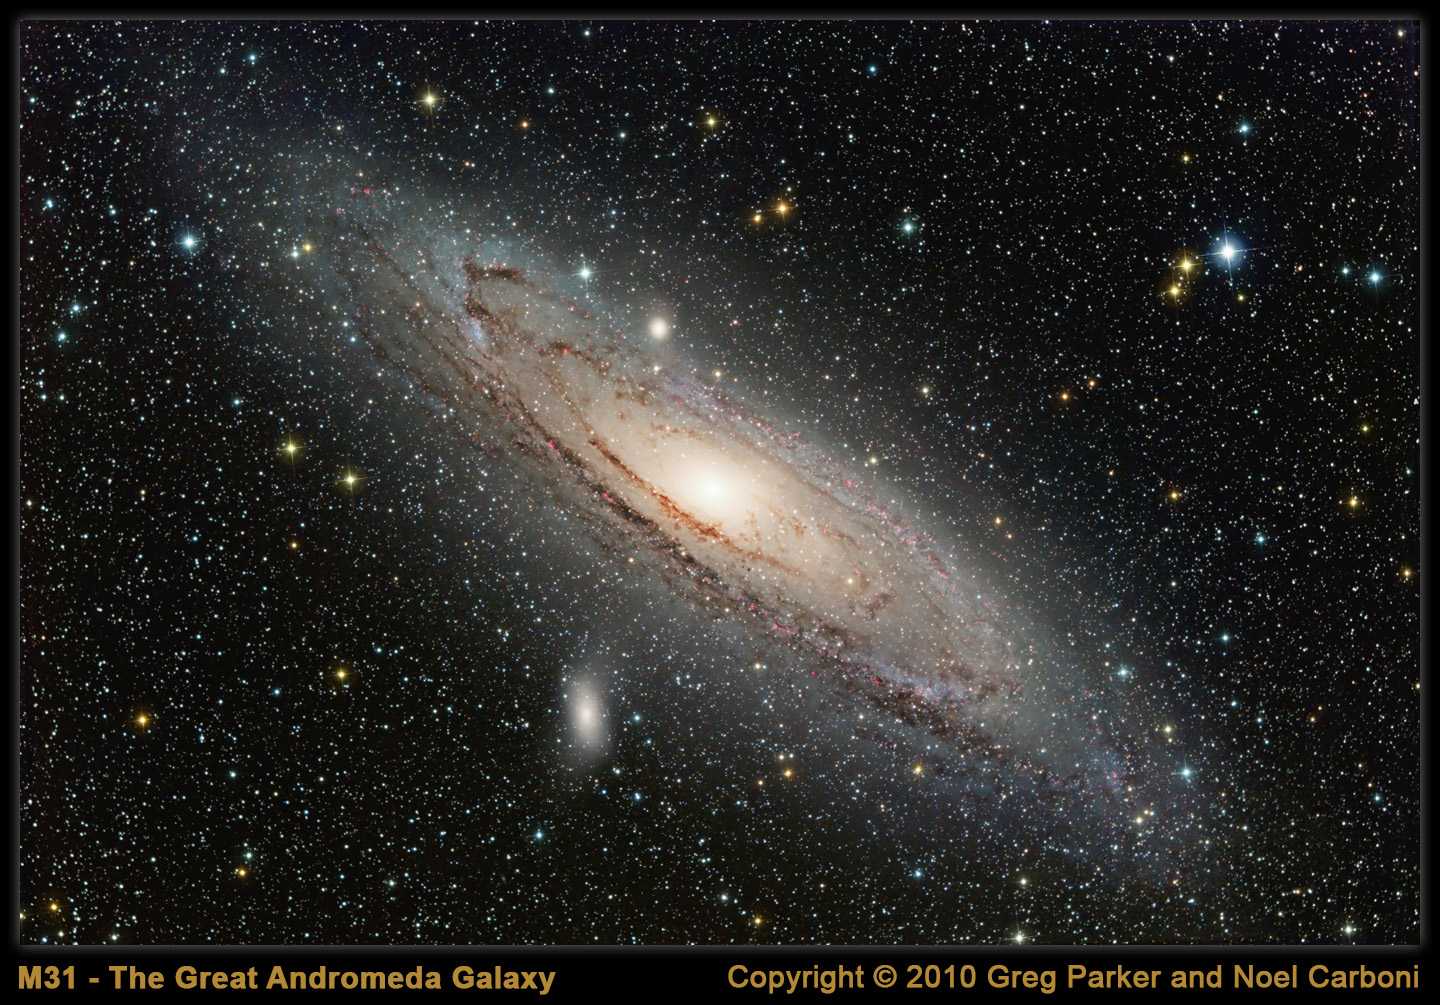
M31 and M33 are two of the nearest spiral galaxies, and can form the basis for determining distances to more remote spiral galaxies and constraining the expansion rate of the Universe (the Hubble constant). Hence the relevance and importance of several new studies that employed near-infrared data to establish solid distances for M31 (Andromeda) and M33 (Triangulum) (e.g., Gieren et al. 2013), and aimed to reduce existing uncertainties tied to the fundamental parameters for those galaxies. Indeed, reliable distances for M31 and M33 are particularly important in light of the new Hubble constant estimate from the Planck satellite, which is offset relative to certain other results, and that difference hinders efforts to ascertain the nature of dark energy (the mysterious force theorized as causing the Universe’s accelerated expansion).
Gieren et al. remarked that, “a number of new distance determinations to M33 … span a surprisingly large interval … which is a cause of serious concern. As the second-nearest spiral galaxy, an accurate determination of [M33’s] distance is a crucial step in the process of building the cosmic distance ladder.” Concerning M31, Riess et al. 2012 likewise remarked that “M31, the nearest analogue of the Milky Way Galaxy, has long provided important clues to understanding the scale of the Universe.“
The new Gieren and Riess et al. distances are based on near-infrared observations, which are pertinent because radiation from that part of the electromagnetic spectrum is less sensitive than optical data to absorption by dust located along our sight-line (see the figure below). Properly accounting for the impact of dust is a principal problem in cosmic distance scale work, since it causes targets to appear dimmer. “different assumptions about [dust obscuration] are a prime source for the discrepancies among the various distance determinations for M33.” noted Gieren et al., and the same is true for the distance to M31 (see Riess et al.).
Optical and near-infrared images highlight how dust obscures light emitted from targets along the sight-line, and that the level of obscuration is wavelength dependent. New distances established for M31 and M33 are based on near-infrared observations, which are less sensitive to that obscuration (image credit: Alves et al. 2001).
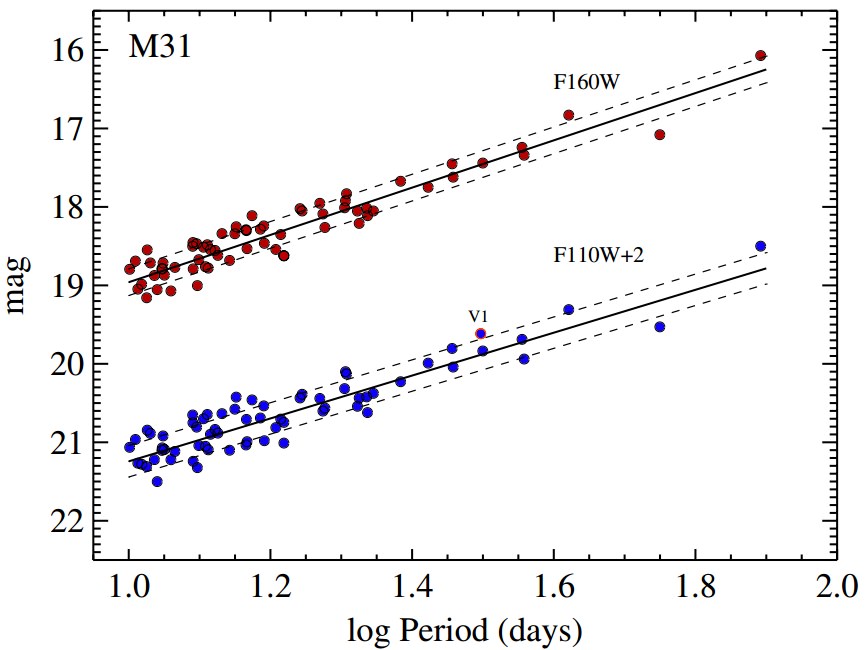
The Gieren and Riess et al. distances to M33 and M31, respectively, were inferred from observations of Cepheids. Cepheids are a class of variable stars that exhibit periodic brightness variations (they pulsate radially). Cepheids can be used as distance indicators because their pulsation period and mean luminosity are correlated. That relationship was discovered by Henrietta Leavitt in the early 1900s. A pseudo period-luminosity relation derived for M31 Cepheids is presented below.
Gieren et al. observed 26 Cepheids in M33 and established a distance of ~2,740,000 lightyears. The team added that, “As the first modern near-infraredCepheid study [of] M33 since … some 30 years … we consider this work as long overdue …” Astronomers often cite distances to objects in lightyears, which defines the time required for light emitted from the source to reach the observer. Despite the (finite) speed of light being 300,000,000 m/s, the rays must traverse “astronomical” distances. Gazing into space affords one the unique opportunity to peer back in time.
A relation exists between a Cepheid’s periodic brightness variations and its mean luminosity. Astronomers use that trend, which was discovered in the early 1900s by Henrietta Leavitt, to establish distances to galaxies hosting Cepheids. In the above figure the horizontal axis features the pulsation period, and the vertical axis defines a proxy for luminosity (image credit: Fig 2 from Riess et al., arXiv/ApJ).
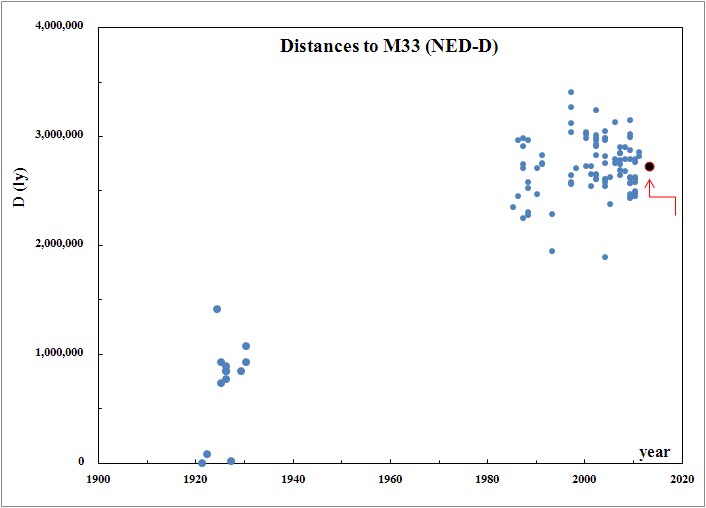
The distances to M33 shown below convey seminal points in the evolution of humanity’s knowledge. The scatter near the 1920s stems partly from a debate concerning whether the Milky Way and the Universe are synonymous. In other words, do galaxies exist beyond the Milky Way? The topic is immortalized in the famed great debate (1920) featuring H. Shapley and H. Curtis (the latter argued for an extragalactic scale). The offset between the pre-1930 and post-1980 data result in part from a nearly two-fold increase in the cosmic distance scale recognized circa 1950 (see also Feast 2000). Also evident is the scatter associated with the post-1980 distances, which merely reinforces the importance of the new high-precision distance estimates.
Riess et al. obtained data for some 70 Cepheids and determined a distance for M31 of ~2,450,000 lightyears. The latter is corroborated by a new study by Contreras Ramos et al. 2013 (d~2,540,000 ly), whose distance estimate relied on data for stars in a M31 globular cluster.
A subset of the distances deduced for M33, as compiled from estimates featured in the NASA/IPAC Extragalactic Database (Steer & Madore). On the vertical axis is the distance to the galaxy in units of lightyears, and the year is cited on the horizontal axis. The red arrow and black datum indicate the new near-infrared based distance from Gieren et al. (image credit: DM).
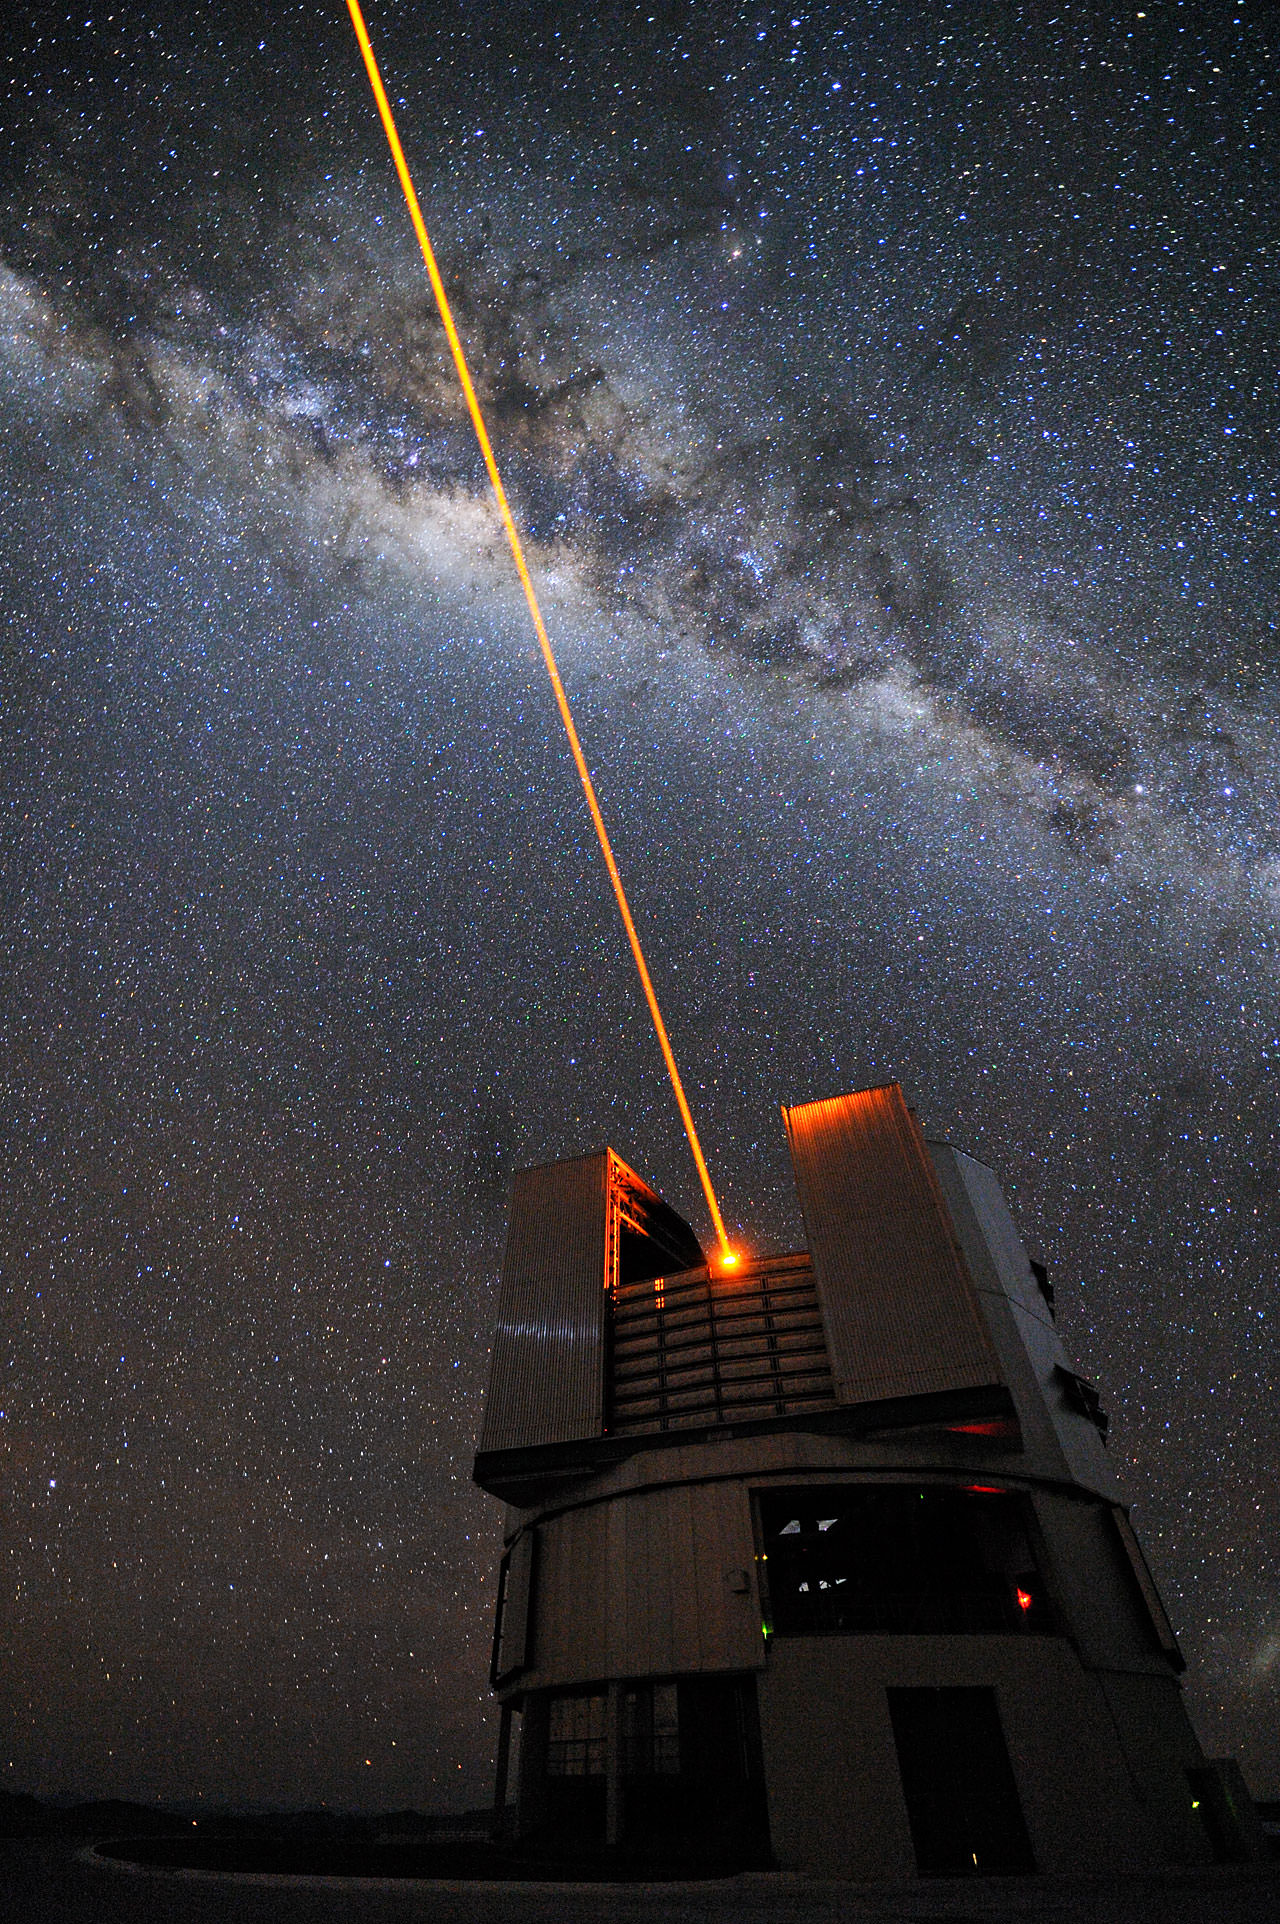
Gieren et al. used the 8.2-m Very Large Telescope (Yepun) to image stars in M33, and deduce the distance to that galaxy (image credit: G. Hüdepohl/ESO).
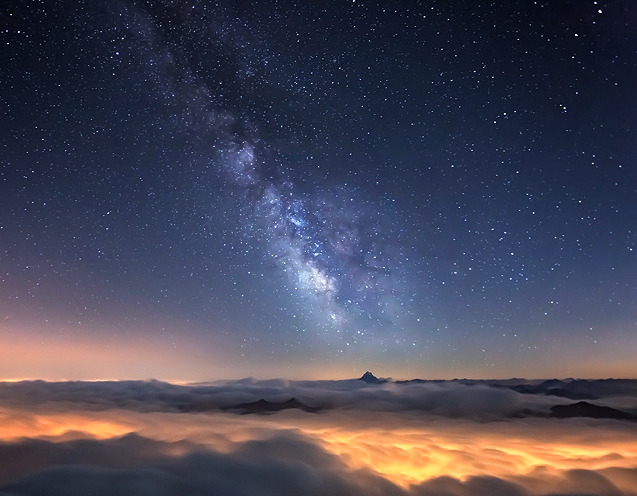
The plane of our Milky Way galaxy (image credit: R. Bertero/deviantart, cropped by DM). Understanding the nature of the obscuring dust, indicated partly by the dark regions bisecting the plane, is key to establishing a precise distance to the Galactic center.
Obtaining an accurate distance between the Sun and the center of our Galaxy remains one of the principal challenges facing astronomers. The ongoing lively debate concerning this distance hinges partly on the nature of dust found along that sight-line. Specifically, are dust particles lying toward the Galactic center different from their counterparts near the Sun? A new study led by David Nataf asserts that, yes, dust located towards the Galactic center is anomalous. They also look at accurately defining both the distance to the Galactic center and the reputed bar structure that encompasses it.
The team argues that characterizing the nature of small dust particles is key to establishing the correct distance to the Galactic center, and such an analysis may mitigate the scatter among published estimates for that distance (shown in the figure below). Nataf et al. 2013 conclude that dust along the sight-line to the Galactic center is anomalous, thus causing a non-standard ‘extinction law‘.
The extinction law describes how dust causes objects to appear fainter as a function of the emitted wavelength of light, and hence relays important information pertaining to the dust properties.
The team notes that, “We estimate a distance to the Galactic center of [26745 light-years] … [adopting a] non-standard [extinction law] thus relieves a major bottleneck in Galactic bulge studies.”
Various estimates for the distance to the Galactic center tabulated by Malkin 2013. The x-axis describes the year, while the y-axis features the distance to the Galactic center in kiloparsecs (image credit: Fig 1 from Malkin 2013/arXiv/ARep).
Nataf et al. 2013 likewise notes that, “The variations in both the extinction and the extinction law made it difficult to reliably trace the spatial structure of the [Galactic] bulge.” Thus variations in the extinction law (tied directly to the dust properties) also affect efforts to delineate the Galactic bar, in addition to certain determinations of the distance to the Galactic center. Variations in the extinction law imply inhomogeneities among the dust particles.
“The viewing angle between the bulge’s major axis and the Sun-Galactic centerline of sight remains undetermined, with best values ranging from from 13 to … 44 [degrees],” said Nataf et al. 2013 (see also Table 1 in Vanhollebekke et al. 2009). The team added that, “We measure an upper bound on the tilt of 40 [degrees] between the bulge’s major axis and the Sun-Galactic center line of sight.”
However, the properties of dust found towards the Galactic center are debated, and a spectrum of opinions exist. While Nataf et al. 2013 find that the extinction law is anomalously low, there are studies arguing for a standard extinction law. Incidentally, Nataf et al. 2013 highlight that the extinction law characterizing dust near the Galactic center is similar to that tied to extragalactic supernovae (SNe), “The … [extinction] law toward the inner Galaxy [is] approximately consistent with extra-galactic investigations of the hosts of type Ia SNe.”
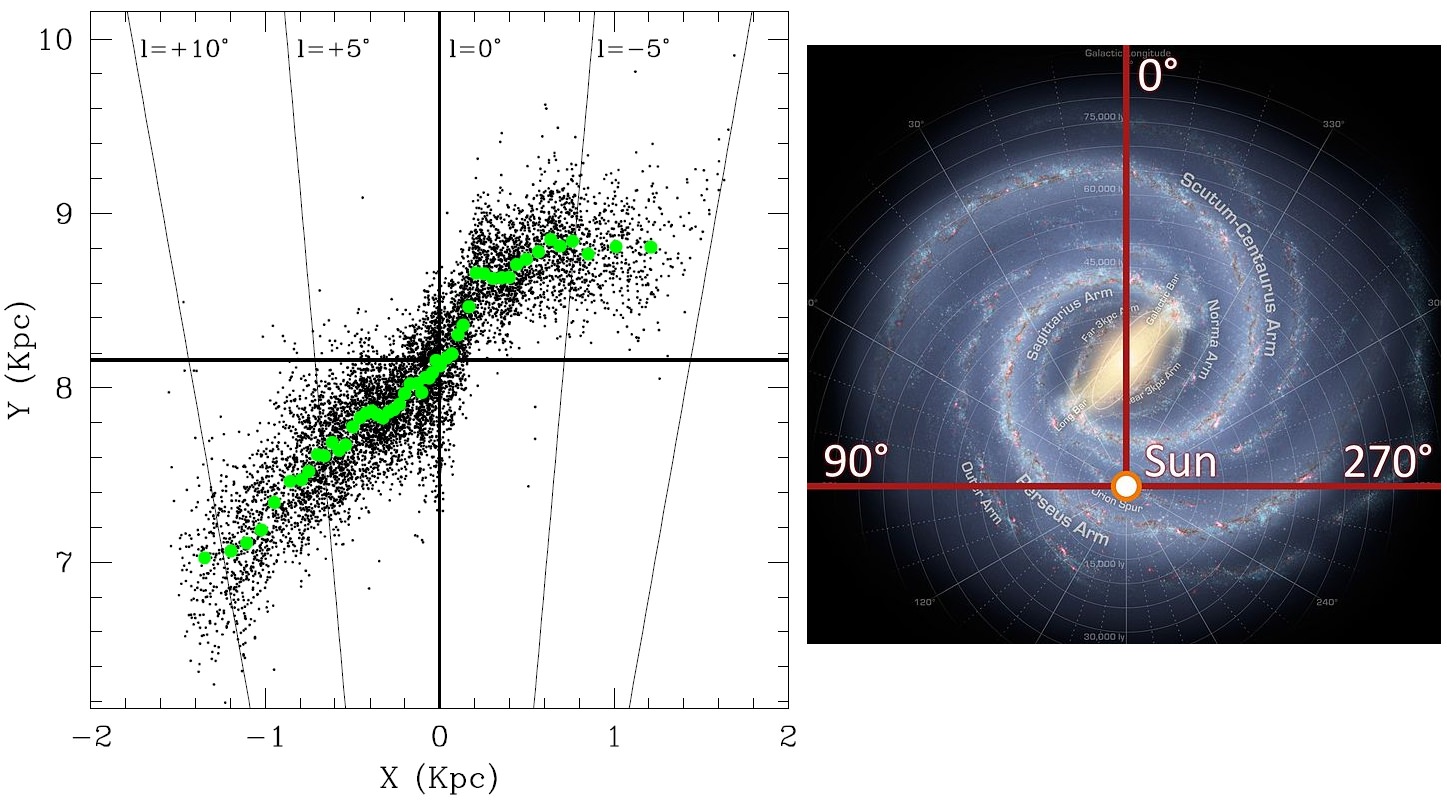
Left, the delineation of the bar at the center of the Milky Way by Nataf et al. 2013. The centerline represents the direction towards Sagittarius (image credit: Fig 17 from Nataf et al. 2013/arXiv/ApJ). Right, a macro view of the Galaxy highlighting the general orientation and location of the Galactic bar (image credit: NASA/Wikipedia). The Galactic bar is not readily discernible in the distribution of RR Lyrae variables.
Deviations from the standard extinction law, and the importance of characterizing that offset, is also exemplified by studies of the Carina spiral arm. Optical surveys reveal that a prominent spiral arm runs through Carina (although that topic is likewise debated), and recent studies argue that the extinction law for Carina is higher than the standard value (Carraro et al. 2013, Vargas Alvarez et al. 2013). Conversely, Nataf et al. 2013 advocate that dust towards the Galactic center is lower by comparison to the standard (average) extinction law value.
The impact of adopting an anomalously high extinction law for objects located in Carina is conveyed by the case of the famed star cluster Westerlund 2, which is reputed to host some of the Galaxy’s most massive stars. Adopting an anomalous extinction law for Westerlund 2 (Carraro et al. 2013, Vargas Alvarez et al. 2013) forces certain prior distance estimates to decrease by some 50% (however see Dame 2007). That merely emphasizes the sheer importance of characterizing local dust properties when establishing the cosmic distance scale.
In sum, characterizing the properties of small dust particles is important when ascertaining such fundamental quantities like the distance to the Galactic center, delineating the Galactic bar, and employing distance indicators like Type Ia SNe.
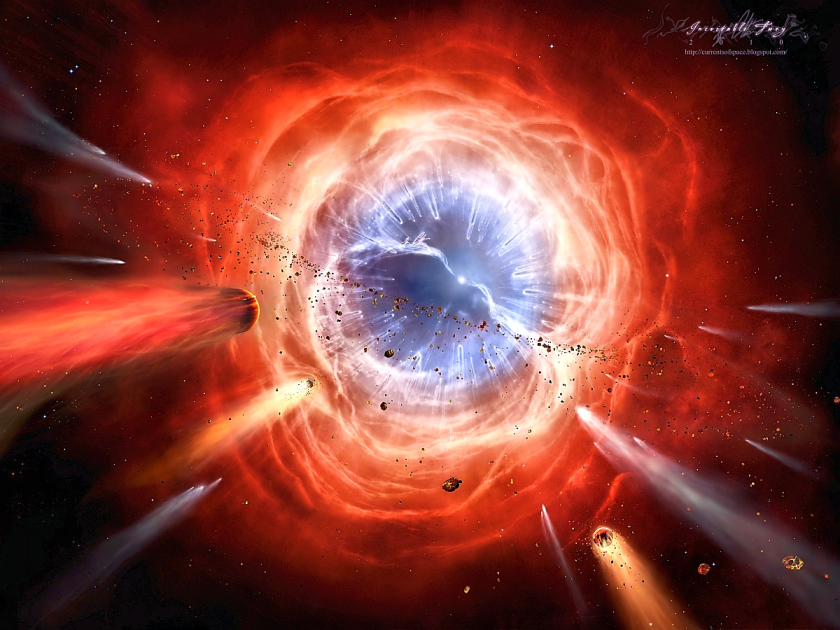
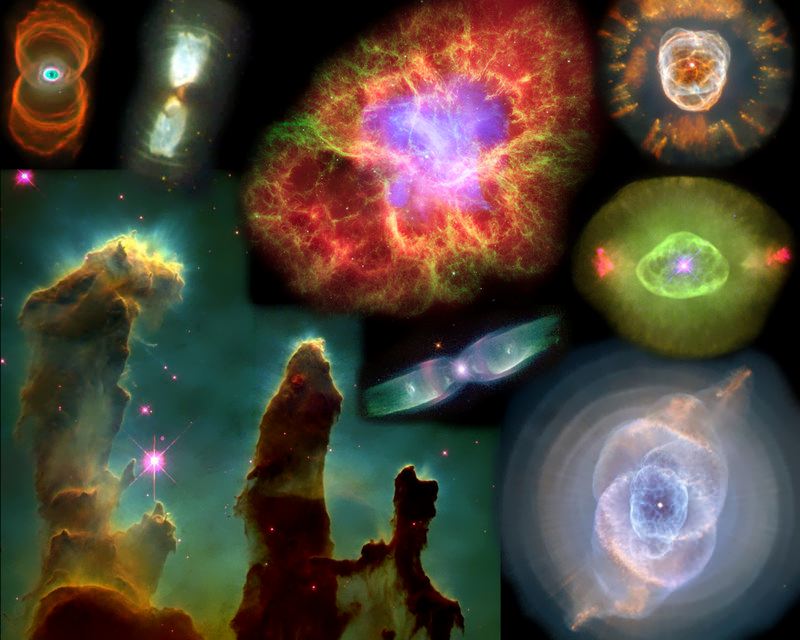
An artist's illustration of a planetary nebula engulfing its orbiting planets (image credit: Regulus36/deviantart, adjusted by DM to mitigate compression effects).
Textbooks often cite that planetary nebulae (PNe, plural) represent an endstate for lower-mass single stars. But conversely, recent research suggests that most PNe stem from binary systems. The lowest mass star theorized to form the typical PN is near 1 solar mass, and thus without a companion the Sun may not surpass the mass limit required to generate the hot glowing (ionized) nebula typically tied to PNe. New research continues to question our original understanding of how the Sun’s life may end.
A new study spearheaded by G. Jacoby aimed in part to test that binary hypothesis by searching for PNe in star clusters occupying M31. The team remarked that, “while the binary interaction model explains some of the anomalies associated with the observed planetary nebula population, this theory awaits final confirmation.”
“The traditional theory states that the progenitors of PNe are low- to intermediate-mass single stars … However, this theory does not provide a natural explanation for the non-spherical morphologies observed for the great majority of PNe, nor their low rate of formation. For these and other inconsistencies, a new paradigm has been developed, wherein most PNe are shaped via the interaction … with a binary companion,” said Jacoby et al. 2013. Continue reading “Astronomers Hint that our Sun won’t Terminate as the Typical Planetary Nebula”
“No scientific discovery is named after its discoverer,” – Stigler/Merton.
Edwin Hubble’s contributions to astronomy earned him the honor of having his name bestowed upon arguably the most famous space telescope (the Hubble Space Telescope, HST). Contributions that are often attributed to him include the discovery of the extragalactic scale (there exist countless other galaxies beyond the Milky Way), the expanding Universe (the Hubble constant), and a galaxy classification system (the Hubble Tuning Fork). However, certain astronomers are questioning Hubble’s pre-eminence in those topics, and if all the credit is warranted.
“[The above mentioned] discoveries … are well-known … and most astronomers would associate them solely with Edwin Hubble; yet this is a gross oversimplification. Astronomers and historians are beginning to revise that standard story and bring a more nuanced version to the public’s attention,” said NASA scientist Michael J. Way, who just published a new study entitled “Dismantling Hubble’s Legacy?”
Has history clouded our view of Hubble the man? Or are his contributions seminal to where we are today in astronomy?
Assigning credit for a discovery is not always straightforward, and Way 2013 notes, “How credit is awarded for a discovery is often a complex issue and should not be oversimplified – yet this happens time and again. Another well-known example in this field is the discovery of the Cosmic Microwave Background.” Indeed, controversy surrounds the discovery of the Universe’s accelerated expansion, which merely occurred in the late 1990s. Conversely, the discoveries attributed to Hubble transpired during the ~1920s.
The Hubble Space Telescope (image credit: NASA, tweaked by D. Majaess).
Prior to commencing this discussion, it’s emphasized that Hubble cannot defend his contribution since he died long ago (1889-1953). Moreover, we can certainly highlight the efforts of other individuals whose seminal contributions were overlooked without mitigating Hubble’s pertinence. The first topic discussed here is the discovery of the extragalactic scale. Prior to the 1920s it was unclear whether the Milky Way galaxy and the Universe were synonymous. In other words, was the Milky Way merely one among countless other galaxies?
Astronomers H. Shapley and H. Curtis argued the topic in the famed Island Universe debate (1920). Curtis believed in the extragalactic Universe, whereas Shapley took the opposing view (see also Trimble 1995 for a review). In the present author’s opinion, Hubble’s contributions helped end that debate a few years later and changed the course of astronomy, namely since he provided evidence of an extragalactic Universe using a distance indicator that was acknowledged as being reliable. Hubble used stars called Cepheid variables to help ascertain that M31 and NGC 6822 were more distant than the estimated size of the Milky Way, which in concert with their deduced size, implied they were galaxies. Incidentally, Hubble’s distances, and those of others, were not as reliable as believed (e.g., Fernie 1969, Peacock 2013). Peacock 2013 provides an interesting comparison between distance estimates cited by Hubble and Lundmark with present values, which reveals that both authors published distances that were flawed in some manner. Having said that, present-day estimates are themselves debated.
Hubble’s evidence helped convince even certain staunch opponents of the extragalactic interpretation such as Shapley, who upon receiving news from Hubble concerning his new findings remarked (1924), “Here is the letter that has destroyed my universe.” Way 2013 likewise notes that, “The issue [concerning the extragalactic scale] was effectively settled by two papers from Hubble in 1925 in which he derived distances from Cepheid variables found in M31 and M33 (Hubble 1925a) of 930,000 light years and in NGC 6822 (Hubble 1925c) of 700,000 light years.”
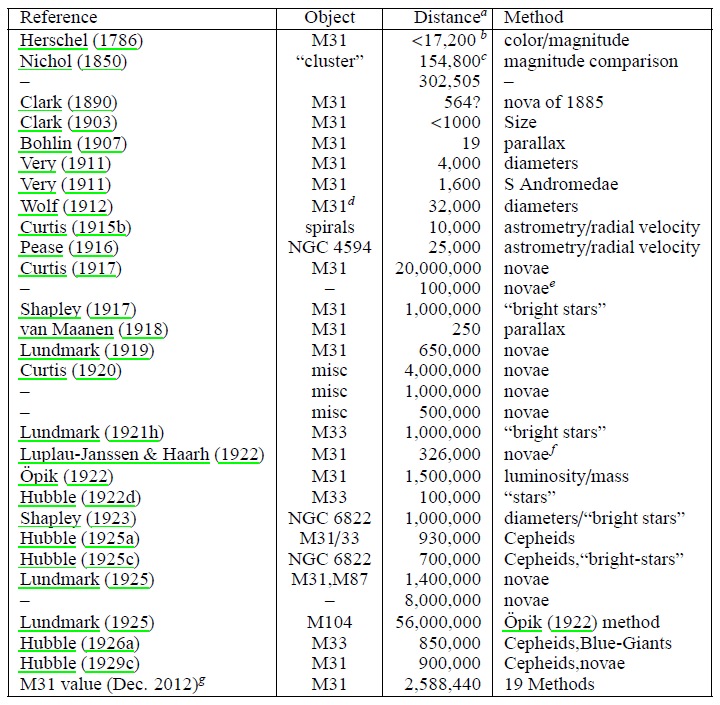
However, as table 1 from Way 2013 indicates (shown below), there were numerous astronomers who published distances that implied there were galaxies beyond the Milky Way. Astronomer Ian Steer, who helps maintain the NASA/IPAC Extragalactic Database of Redshift-Independent Distances (NED-D), has also compiled a list of 290 distances to galaxies published before 1930. Way 2013 added that, “Many important contributions to this story have been forgotten and most textbooks in astronomy today, if they discuss the “Island Universe” confirmation at all, bestow 100% of the credit on Hubble with scant attention to the earlier observations that clearly supported his measurements.”
Thus Hubble did not discover the extragalactic scale, but his work helped convince a broad array of astronomers of the Universe’s enormity. However, by comparison to present-day estimates, Hubble’s distances are too short owing partly to the existing Cepheid calibration he utilized (Fernie 1969, Peacock 2013 also notes that Hubble’s distances were flawed for other reasons). That offset permeated into certain determinations of the expansion rate of the Universe (the Hubble constant), making the estimate nearly an order of magnitude too large, and the implied age for the Universe too small.
Way 2013 notes, “Table 1 lists all of the main distance estimates to spiral nebulae (known to this author) from the late 1800s until 1930 when standard candles began to be found in spiral nebulae [galaxies].” (image credit: Way 2013/arXiv).Hubble’s accreditation as the discoverer of the expanding Universe (the Hubble constant) has generated considerable discussion, which is ultimately tied to the discovery of a relationship between a galaxy’s velocity and its distance. An accusation even surfaced that Hubble may have censored the publication of another scientist to retain his pre-eminence. That accusation has since been refuted, but provides the reader an indication of the tone of the debate (see Livio 2012 (Nature), and references therein).
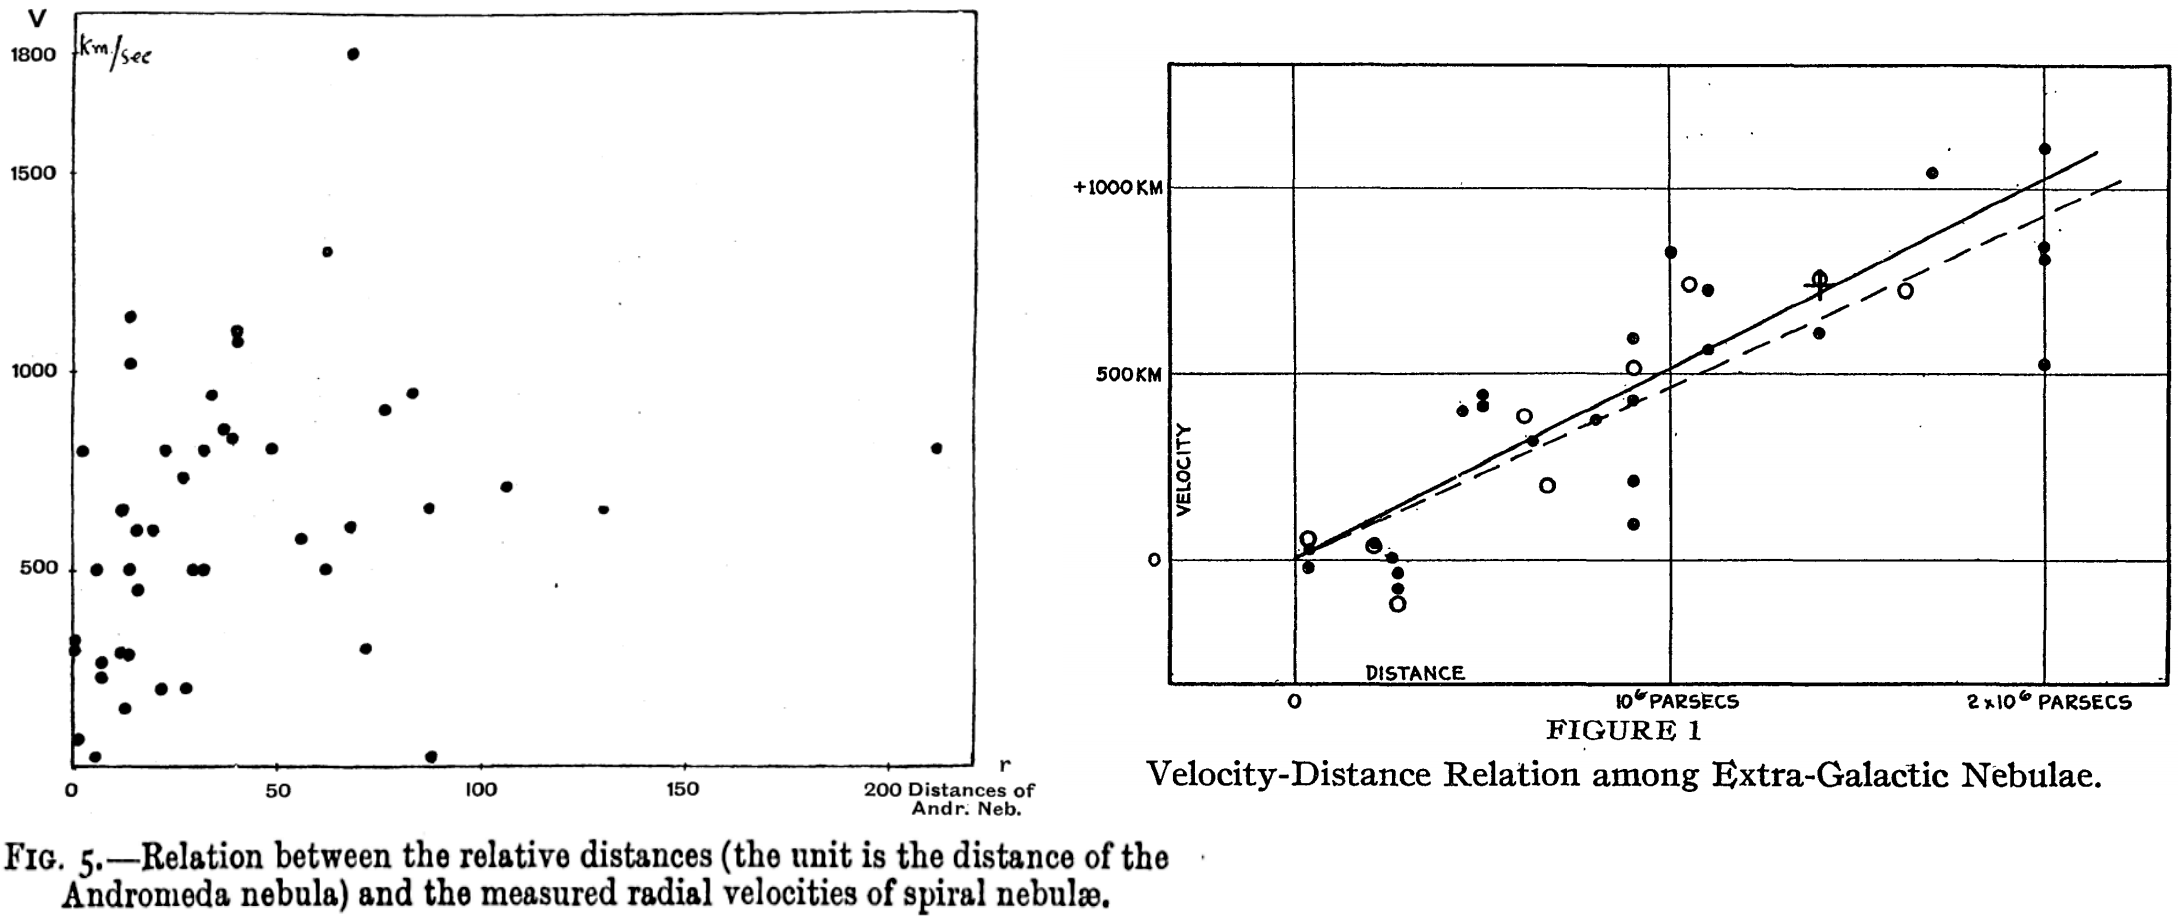
Hubble published his findings on the velocity-distance relation in 1929, under the unambiguous title, “A Relation Between Distance and Radial Velocity Among Extra-Galactic Nebulae”. Hubble 1929 states at the outset that other investigations have sought, “a correlation between apparent radial velocities and distances, but so far the results have not been convincing.” The key word being convincing, clearly a subjective term, but which Hubble believes is the principal impetus behind his new effort. In Lundmark 1924, where a velocity versus distance diagram is plotted for galaxies (see below), that author remarks that, “Plotting the radial velocities against these relative distances, we find that there may be a relation between the two quantities, although not a very definite one.” However, Hubble 1929 also makes reference to a study by Lundmark 1925, where Lundmark underscores that, “A rather definite correlation is shown between apparent dimensions and radial velocity, in the sense that the smaller and presumably more distant spirals have the higher space velocity.”
Hubble 1929 provides a velocity-distance diagram (featured below) and also notes that, “the data indicate a linear correlation between distances and velocities”. However, Hubble 1929 explicitly cautioned that, “New data to be expected in the near future may modify the significance of the present investigation, or, if confirmatory, will lead to a solution having many times the weight. For this reason it is thought premature to discuss in detail the obvious consequences of the present results … the linear relation found in the present discussion is a first approximation representing a restricted range in distance.” Hubble implied that additional effort was required to acquire observational data and place the relation on firm (convincing) footing, which would appear in Hubble and Humason 1931. Perhaps that may partly explain, in concert with the natural tendency of most humans to desire recognition and fame, why Hubble subsequently tried to retain credit for the establishment of the velocity-distance relation.
Hubble 1929 conveyed that he was aware of prior (but unconvincing to him) investigations on the topic of the velocity-distance relation. That is further confirmed by van den Bergh 2011, who cites the following pertinent quote recounted by Hubble’s assistant (Humason) for an oral history project, “The velocity-distance relationship started after one of the IAU meetings, I think it was in Holland [1928]. And Dr. Hubble came home rather excited about the fact that two or three scientists over there, astronomers, had suggested that the fainter the nebulae were, the more distant they were and the larger the red shifts would be. And he talked to me and asked if I would try and check that out.”
The velocities of galaxies plotted as a function of their distance, from Lundmark 1924 (left) and Hubble 1929 (right). Note the separate scales on the x-axis. Peacock 2013 demonstrates that distances cited by both authors were ultimately flawed, and problems (albeit less acute) likewise exist with modern distances (image credit: Lundmark/MNRAS/Hubble/PNAS, assembled by D. Majaess).
Hubble 1929 elaborated that, “The outstanding feature, however, is the possibility that the velocity-distance relation may represent the de Sitter effect, and hence that numerical data may be introduced into discussions of the general curvature of space.” de Sitter had proposed a model for the Universe whereby light is redshifted as it travels further from the emitting source. Hubble suspected that perhaps his findings may represent the de Sitter effect, however, Way 2013 notes that, “Thus far historians have unearthed no evidence that Hubble was searching for the clues to an expanding universe when he published his 1929 paper (Hubble 1929b).” Indeed, nearly two decades after the 1929 publication, Hubble 1947 remarks that better data may indicate that, “redshifts may not be due to an expanding universe, and much of the current speculation on the structure of the universe may require re-examination.” It is thus somewhat of a paradox that, in tandem with the other reasons outlined, Hubble is credited with discovering that the Universe is expanding.
The term redshift stems from the fact that when astronomers (e.g., V. Slipher) examined the spectra of certain galaxies, they noticed that although a particular spectral line should have appeared in the blue region of the spectrum (as measured in a laboratory): the line was actually shifted redward. Hubble 1947 explained that, “light-waves from distant nebulae [galaxies] seem to grow longer in proportion to the distance they have travelled It is as though the stations on your radio dial were all shifted toward the longer wavelengths in proportion to the distances of the stations. In the nebular [galaxy] spectra the stations (or lines) are shifted toward the red, and these redshifts vary directly with distance–an approximately linear relation. This interpretation lends itself directly to theories of an expanding universe. The interpretation is not universally accepted, but even the most cautious of us admit that redshifts are evidence either of an expanding universe or of some hitherto unknown principle of nature.”
Top, spectra for galaxies that are redshifted (image credit: JPL/Caltech/Planck).
As noted above, Hubble was not the first to deduce a velocity-distance relation for galaxies, and Way 2013 notes that, “Lundmark (1924b): first distance vs. velocity plot for spiral nebulae [galaxies] …Georges Lemaitre (1927): derived a non–static solution to Einstein’s equations and coupled it to observations to reveal a linear distance vs. redshift relation with a slope of 670 or 575 km/s/Mpc (depending on how the data is grouped) …” Although Hubble was aware of Lundmark’s research, he and numerous other astronomers were likely unaware of the now famous 1927 Lemaitre study, which was published in an obscure journal (see Livio 2012 (Nature), and discussion therein). Steer 2013 notes that, “Lundmark’s [1924] distance estimates were consistent with a Hubble constant of 75 km/s/Mpc [which is close to recent estimates].” (see also the interpretation of Peacock 2013). Certain distances established by Lundmark appear close to present determinations (e.g., M31, see the table above).
So why was Hubble credited with discovering the expanding Universe? Way 2013 suggests that, “Hubble’s success in gaining credit for his … linear distance-velocity relation may be related to his verification of the Island Universe hypothesis –after the latter, his prominence as a major player in astronomy was affirmed. As pointed out by Merton (1968) credit for simultaneous (or nearly so) discoveries is usually given to eminent scientists over lesser-known ones.” Steer told Universe Today that, “Lundmark in his own words did not find a definite relation between redshift and distance, and there is no linear relation overplotted in his redshift-distance graph. Where Lundmark used a single unproven distance indicator (galaxy diameters), cross-checked by a single unproven distance to the Andromeda galaxy, Hubble used multiple indicators including one still in use (brightest stars), cross-checked with distances to multiple galaxies based on Cepheids variables stars.”
Concerning assigning credit for the discovery of the expansion of the Universe, Way 2013 concludes that, “Overall we find that Lemaitre was the first to seek and find a linear relation between distance and velocity in the context of an expanding universe, but that a number of other actors (e.g. Carl Wirtz, Ludwik Silberstein, Knut Lundmark, Edwin Hubble, Willem de Sitter) were looking for a relation that fit into the context of de Sitter’s [Universe] Model B world with its spurious radial velocities [the redshift].” A partial list of the various contributors highlighted by van den Bergh 2011 is provided below.
“The history of the discovery of the expansion of the Universe may be summarized [above],” van den Bergh 2011 (image credit: van den Bergh/JRASC/arXiv).Way and Nussbaumer 2011 assert that, “It is still widely held that in 1929 Edwin Hubble discovered the expanding Universe … that is incorrect. There is little excuse for this, since there exists sufficient well-supported evidence about the circumstances of the discovery.”
In sum, the author’s personal opinion is that Hubble’s contributions to astronomy were seminal. Hubble helped convince astronomers of the extragalactic distance scale and that a relationship existed between the distance to a galaxy and its velocity, thus propelling the field and science forward. His extragalactic distances, albeit flawed, were also used to draw important conclusions (e.g., by Lemaitre 1927). However, it is likewise clear that other individuals are meritorious and deserve significant praise. The contributions of those scientists should be highlighted in parallel to Hubble’s research, and astronomy textbooks should be revised to emphasize those achievements A fuller account should be cited of the admirable achievements made by numerous astronomers working in synergy during the 1920s.
There are a diverse set of opinions on the topics discussed, and the reader should remain skeptical (of the present article and other interpretations), particularly since knowledge of the topic is evolving and more is yet to emerge. Two talks from the “Origins of the Expanding Universe: 1912-1932” conference are posted below (by H. Nussbaumer and M. Way), in addition to a talk by I. Steer from a separate event.
A new study describes how the Kepler team aims to remove pseudo-planets from its database. A pseudo-planet can be caused by the superposition of a foreground bright constant target star, and background fainter multiple star systems as shown in the above artist sketch (image credit: regulus36/devianart).
Observations by the Kepler satellite have advanced our knowledge of stars and their orbiting planets, yielding more than 100 confirmed planets and about 3,000 candidates. However, orbiting planets may not be the source for a fraction of those detections.
“There are many things in the sky that can produce transit-like signals that are not planets, and thus we must be sure to identify what really is a planet detected by Kepler,” Stephen Bryson told Universe Today. NASA Ames Research Center scientists Bryson and Jon Jenkins (also at the SETI Institute) are the lead authors on a new paper that aims to identify pseudo-planets detected by Kepler.
Small eclipses present in Kepler brightness measurements for a star (a lightcurve) may be indicative of an orbiting planet blocking light from its host star (see image below). However, under certain circumstances binary stars can mimic that signature.
Consider a Kepler target that is actually a chance superposition of a bright star and a fainter eclipsing binary system, whereby the objects lie at different distances along the sight-line. The figure below illustrates that their combined light can produce a lightcurve that is similar to a transiting planet. The bright foreground star dilutes the typically large eclipses produced by the binary system.
Left, the lightcurve for a star featuring a transiting planet, whereby the planet blocks a minute fraction of the host star’s light (image credit: Institute for Astronomy, University of Hawaii at Manoa). Right, the combined light from a foreground bright star and a fainter eclipsing binary system can mimic a transiting planet (image credit: chart and assembly, D. Majaess – cropped stellar graphics from Collier Cameron 2012, Nature).
“Most of the time these eclipsing binaries are not exactly aligned with our target star,” Bryson added, “and we can carefully examine the pixels to discover that the location of the transit signal is not the target star.” The team developed algorithms to identify pseudo-planets when the stars are individually resolved. Tagging spurious planet detections is important since there are numerous candidates, and yet limited observing time for follow-up efforts.
The team has been refining those algorithms as knowledge of the satellite’s in situ behavior increases. “These algorithms have been developed and used over the last four years. Some details of the techniques in the paper are new and will appear in future versions of the Kepler [software processing] pipeline,” said Bryson.
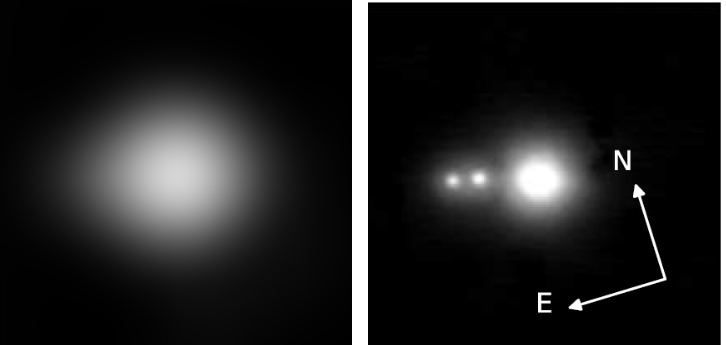
However, if multiple stars fall within the same pixel they are not individually resolved by Kepler, and a separate approach is required to infer their presence. Consider the example highlighted in the image below, where several stars were unresolved by Kepler yet appear in higher resolution images. The matter is exacerbated in part because Kepler’s spatial resolution is not optimal, and thus multiple stars may be confused as a single object. By contrast, certain ground-based telescopes can achieve ~20 times Kepler’s spatial resolution when adaptive optics are implemented.
High-resolution images (right panel) can reveal stars that were unresolved in lower-resolution images (left panel, e.g., Kepler). Unresolved stars dilute eclipses caused by transiting planets, and in certain cases can strongly bias the derived parameters (image credit: right panel from Adams et al. 2012, arXiv/AJ – left panel, image blurred to provide a lower-resolution glimpse of the target, assembly by D. Majaess).
Adams et al. 2012 obtained high-resolution images of 90 Kepler targets, one of which is highlighted above. That team noted that, “Close companions … are of particular concern … Of the [90 Kepler targets surveyed] 20% have at least one companion within [half a Kepler pixel].” The high-resolution images were acquired via the MMT observatory (shown below) and the Palomar Hale-200-inch telescope.
Obviously, the resolution problem becomes more acute when observing rich stellar fields (high densities), such as near the plane of our Galaxy.
“Background eclipsing binaries account for as many as 35% of all planet-like transit signals when we are looking near the Milky Way, because there are many stars in the background,” Bryson told Universe Today. “When we look away from the Milky Way the fraction of background eclipsing binaries falls to about 10% of all planet-like transit signals because there are far fewer background stars of all types.”
However, regarding Kepler’s coarser resolution Bryson underscored that, “[it is] expected with such a large field telescope.” Kepler’s large field is certainly advantageous, as it permits the satellite to monitor 100,000+ stars over more than 100 square degrees of field.
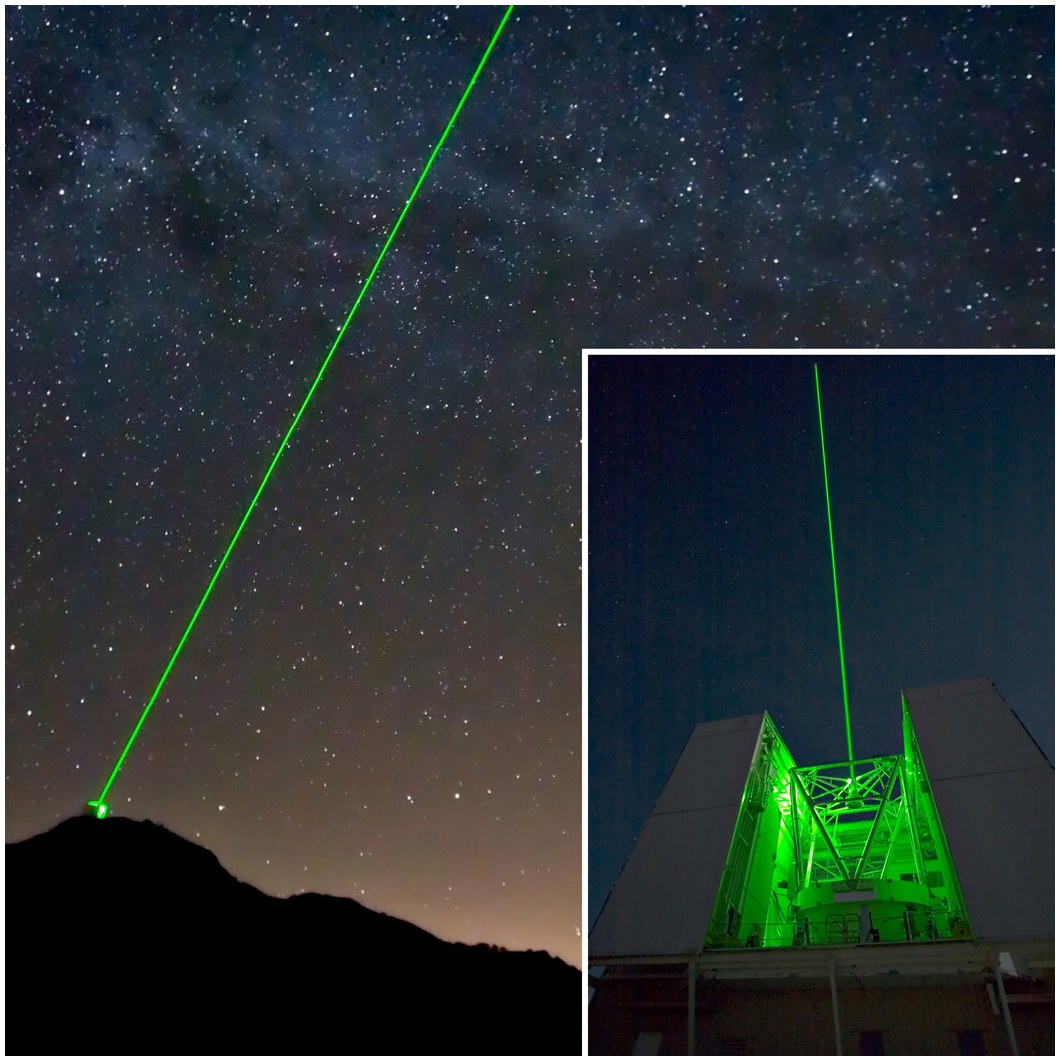
The adaptive optics (AO) system at the MMT observatory provides astronomers with high-resolution images to search the vicinity of Kepler planet candidates for contaminating stars (image credit: Thomas Stalcup, SPIE).
Radial velocity measurements are an ideal means for evaluating planet candidates (and to help yield the mass). The data are pertinent since velocity shifts occur in the spectrum of the host star owing to the planet’s gravity. However, Adams et al. 2012 note that “Many of these objects do not have … radial velocity measurements because of the amount of observing time required, particularly for small planets around relatively faint stars. Another method is needed to confirm these types of planets … High-resolution images are thus a crucial component of any transit follow-up program.”
Identifying unresolved stars is crucial for yet another reason. Note that the fundamental parameters determined for a transiting planet depend in part on the fraction of the host star’s light that is obscured (the eclipse depth). However, if multiple unresolved stars exist they will contribute to the overall brightness, and hence the observed planet eclipse will be diluted and underestimated (see figure 2, above). Indeed, Adams et al. 2012 note that, “Corrections to the planetary parameters based on nearby [contaminating] stars can range from a few to tens of percents, making high resolution images an important tool to understanding the true sizes of other discovered worlds.”
The case of K00098 is a prime example underscoring the importance of identifying unresolved contaminating stars. K00098 features two rather bright stars that were unresolved and unknown prior to the acquisition of high-resolution images. Consequently, previously determined parameters for that star’s transiting planet were incorrect. Concerning K00098, Adams et al. 2012 remarked that, “for K00098, the dilution [of the eclipse depth] … were substantial: the [planet’s] radius increased by 10%, the mass by 60% … and the density changed by 25% [from that published]. Without high resolution images, we would have had a very inaccurate picture of this planet.”
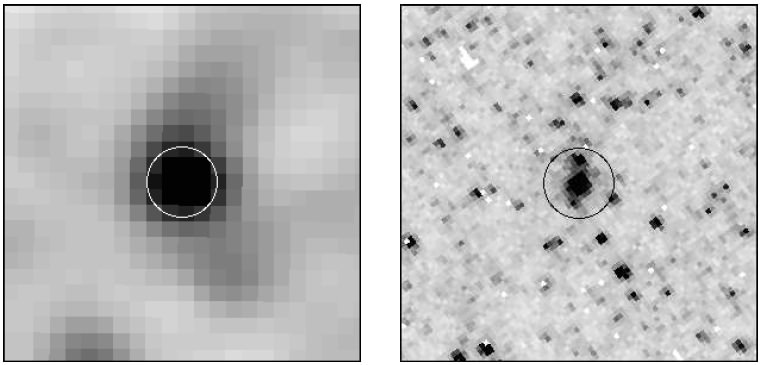
Low and high-resolution images of stars in the galaxy M33. The bright object detected in the low-resolution image is actually several stars, as indicated by the higher-resolution image (right). A similar effect occurs when comparing Kepler (lower-resolution) and AO images (higher-resolution). A single Kepler target can actually constitute multiple stars seen along the sight-line (image credit: Mochejska et al. 2001, arXiv).
Incidentally, unaccounted for light from unresolved stars isn’t merely a problem for exoplanet studies. The issue is rather pertinent when researching the cosmic distance scale and the Hubble constant (expansion rate of the Universe). Consider the images above which feature the same field in M33. The image exhibited on the left is from a ground-based facility, whereas the higher-resolution image displayed on the right is from the Hubble Space Telescope (HST). The brightest star at the center of the image is a Cepheid variable star, which is a pulsating star that is used to establish distances to galaxies. In turn those distances are subsequently employed to determine the Hubble constant. The HST image reveals stars that are unresolved in the ground-based image, and thus the distance inferred from that observation is compromised since the Cepheid appears (spuriously) brighter than it should be.
“Blending [e.g., added light caused by unresolved stars] leads to systematically low distances to galaxies observed with the HST, and therefore to systematically high estimates of the Hubble constant,” remarked Mochejska et al. 2004. However, there is an ongoing debate concerning the importance of such an effect (Ferrarese et al. 2000, Mochejska et al. 2001).
In sum, numerous groups are developing methods to identify pseudo-planets in the Kepler database. Given the large sample and sizable investment of time required to confirm a planet candidate: such efforts are important (e.g., Bryson et al. 2013). Data from the Kepler mission have helped advance our understanding of stars and their orbiting planets, and more is yet to come. If you’d like to help the Kepler team identify planets around other stars: join the Planet Hunters citizen science project.
Impactors strike during the reign of the dinosaurs (image credit: MasPix/devianart)
The recent meteor explosion over Chelyabinsk brought to the forefront a topic that has worried astronomers for years, namely that an impactor from space could cause widespread human fatalities. Indeed, the thousand+ injured recently in Russia was a wake-up call. Should humanity be worried about impactors? “Hell yes!” replied astronomer Neil deGrasse Tyson to CNN’s F. Zakharia .
The geological and biological records attest to the fact that some impactors have played a major role in altering the evolution of life on Earth, particularly when the underlying terrestrial material at the impact site contains large amounts of carbonates and sulphates. The dating of certain large impact craters (50 km and greater) found on Earth have matched events such as the extinction of the Dinosaurs (Hildebrand 1993, however see also G. Keller’s alternative hypothesis). Ironically, one could argue that humanity owes its emergence in part to the impactor that killed the Dinosaurs.
More than a dozen known impactors created 50 km sized craters (and larger) on Earth. One such example is the Manicouagan crater in Quebec, Canada. The crater is 215 million years old, and exhibits an 85 km diameter (image credit: NASA).
Only rather recently did scientists begin to widely acknowledge that sizable impactors from space strike Earth.
“It was extremely important in that first intellectual step to recognize that, yes, indeed, very large objects do fall out of the sky and make holes in the ground,” said Eugene Shoemaker. Shoemaker was a co-discoverer of Shoemaker-Levy 9, which was a fragmented comet that hit Jupiter in 1994 (see video below).
Hildebrand 1993 likewise noted that, “the hypothesis that catastrophic impacts cause mass extinctions has been unpopular with many geologists … some geologists still regard the existence of ~140 known impact craters on the Earth as unproven despite compelling evidence to the contrary.”
Beyond the asteroid that struck Mexico 65 million years ago and helped end the reign of the dinosaurs, there are numerous lesser-known terrestrial impactors that also appear destructive given their size. For example, at least three sizable impactors struck Earth ~35 million years ago, one of which left a 90 km crater in Siberia (Popigai). At least two large impactors occurred near the Jurassic-Cretaceous boundary (Morokweng and Mjolnir), and the latter may have been the catalyst for a tsunami that dwarfed the recent event in Japan (see also the simulation for the tsunami generated by the Chicxulub impactor below).
Glimsdal et al. 2007 note, “it is clear that both the geological consequences and the tsunami of an impact of a large asteroid are orders off magnitude larger than those of even the largest earthquakes recorded.”
However, in the CNN interview Neil deGrasse Tyson remarked that we’ll presumably identify the larger impactors ahead of time, giving humanity the opportunity to enact a plan to (hopefully) deal with the matter. Yet he added that often we’re unable to identify smaller objects in advance, and that is problematic. The meteor that exploded over the Urals a few weeks ago is an example.
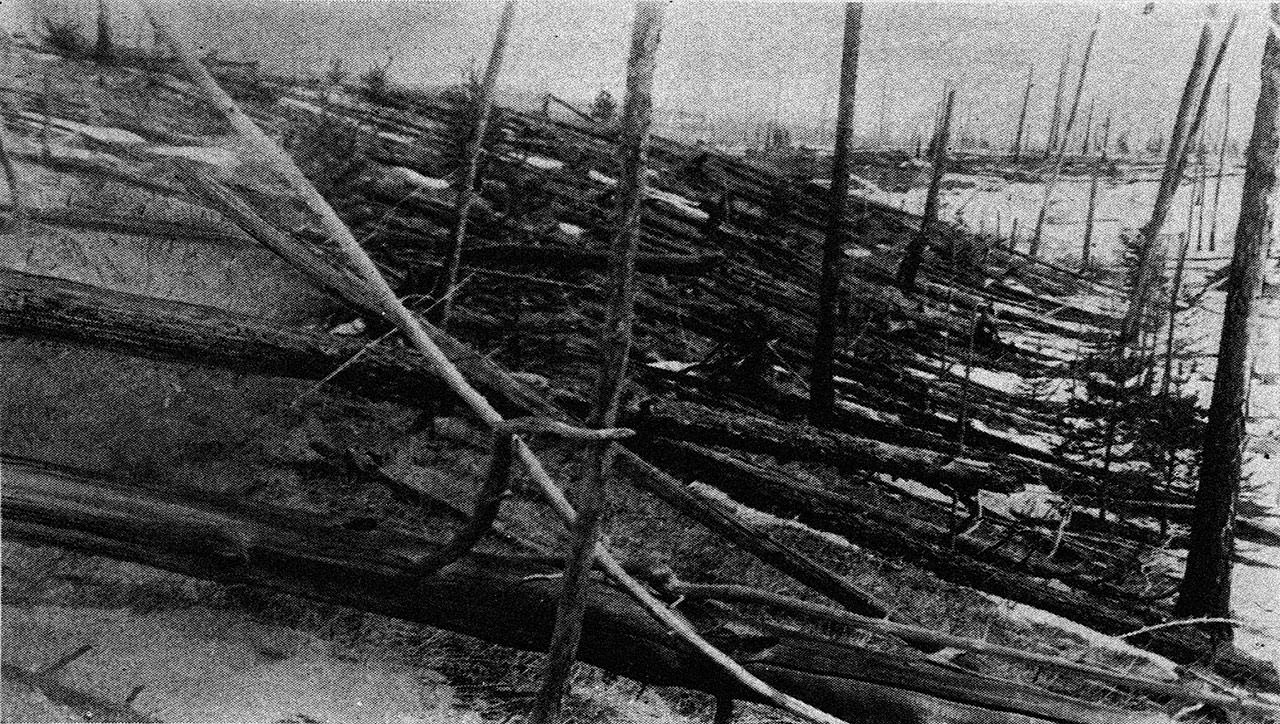
In recent human history the Tunguska event, and the asteroid that recently exploded over Chelyabinsk, are reminders of the havoc that even smaller-sized objects can cause. The Tunguska event is presumed to be a meteor that exploded in 1908 over a remote forested area in Siberia, and was sufficiently powerful to topple millions of trees (see image below). Had the event occurred over a city it may have caused numerous fatalities.
Mark Boslough, a scientist who studied Tunguska noted, “That such a small object can do this kind of destruction suggests that smaller asteroids are something to consider … such collisions are not as improbable as we believed. We should be making more efforts at detecting the smaller ones than we have till now.”
Neil deGrasse Tyson hinted that humanity was rather lucky that the recent Russian fireball exploded about 20 miles up in the atmosphere, as its energy content was about 30 times larger than the Hiroshima explosion. It should be noted that the potential negative outcome from smaller impactors increases in concert with an increasing human population.
In 1908 the Tunguska impactor toppled millions of trees in a rather remote part of Siberia (image credit: Kulik). Had the object exploded over a city, the effects may have been catastrophic.
So how often do large bodies strike Earth, and is the next catastrophic impactor eminent? Do such events happen on a periodic basis? Scientists have been debating those questions and no consensus has emerged. Certain researchers advocate that large impactors (leaving craters greater than 35 km) strike Earth with a period of approximately 26-35 million years.
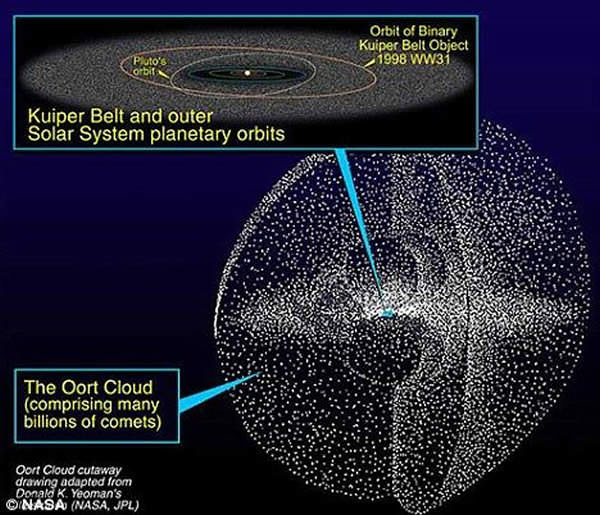
The putative periodicity (i.e., the Shiva hypothesis) is often linked to the Sun’s vertical oscillations through the plane of the Milky Way as it revolves around the Galaxy, although that scenario is likewise debated (as is many of the assertions put forth in this article). The Sun’s motion through the denser part of the Galactic plane is believed to trigger a comet shower from the Oort Cloud. The Oort Cloud is theorized to be a halo of loosely-bound comets that encompasses the periphery of the Solar System. Essentially, there exists a main belt of asteroids between Mars and Jupiter, a belt of comets and icy bodies located beyond Neptune called the Kuiper belt, and then the Oort Cloud. A lower-mass companion to the Sun was likewise considered as a perturbing source of Oort Cloud comets (“The Nemesis Affair” by D. Raup).
A halo of comets designated the Oort Cloud is theorized to encircle the periphery of the Solar System, and reputedly acts as a reservoir for objects that may become terrestrial impactors (image credit: NASA/JPL).
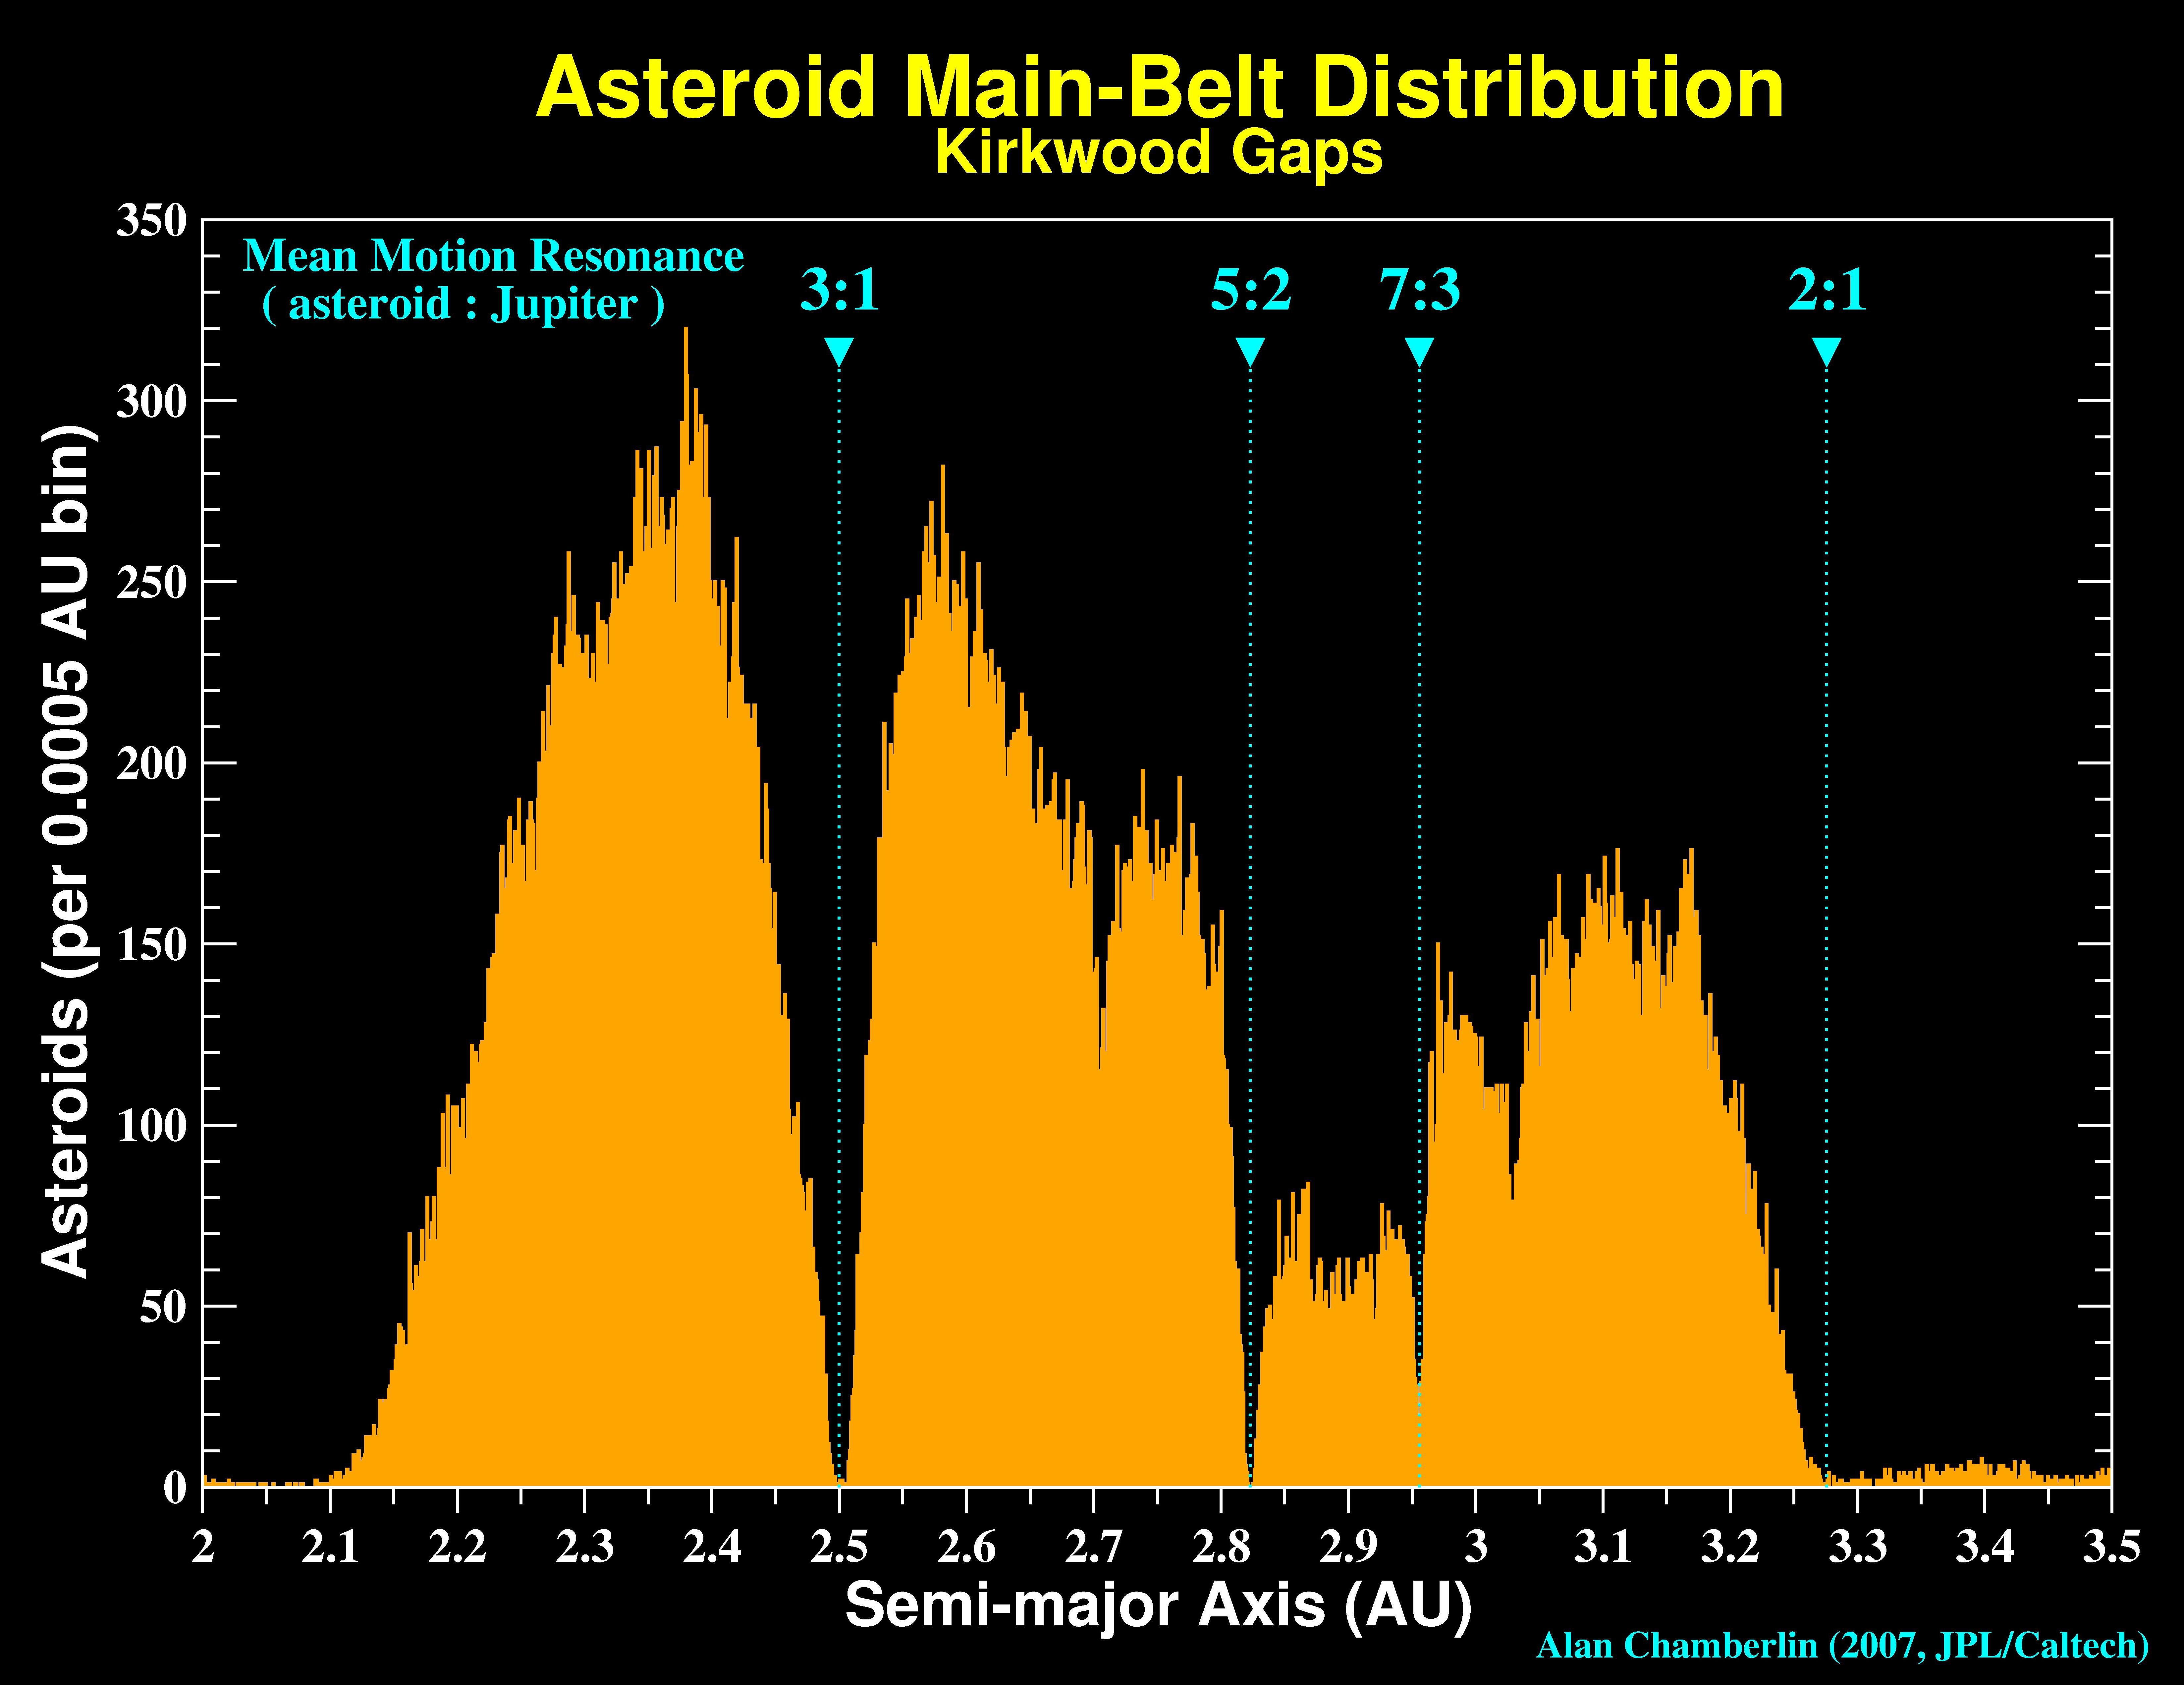
The aforementioned theory pertains principally to periodic comets showers, however, what mechanism can explain how asteroids exit their otherwise benign orbits in the belt and enter the inner solar system as Earth-crossers? One potential (stochastic) scenario is that asteroids are ejected from the belt via interactions with the planets through orbital resonances. Evidence for that scenario is present in the image below, which shows that regions in the belt coincident with certain resonances are nearly depleted of asteroids. A similar trend is seen in the distribution of icy bodies in the Kuiper belt, where Neptune (rather than say Mars or Jupiter) may be the principal scattering body. Note that even asteroids/comets not initially near a resonance can migrate into one by various means (e.g., the Yarkovsky effect).
Indeed, if an asteroid in the belt were to breakup (e.g., collision) near a resonance, it would send numerous projectiles streaming into the inner solar system. That may help partly explain the potential presence of asteroid showers (e.g., the Boltysh and Chicxulub craters both date to near 65 million years ago). In 2007, a team argued that the asteroid which helped end the reign of the Dinosaurs 65 million years ago entered an Earth-crossing orbit via resonances. Furthermore, they noted that asteroid 298 Baptistina is a fragment of that Dinosaur exterminator, and it can be viewed in the present orbiting ~2 AU from the Sun. The team’s specific assertions are being debated, however perhaps more importantly: the underlying transport mechanism that delivers asteroids from the belt into Earth-crossing orbits appears well-supported by the evidence.
A histogram featuring the number of asteroids as a function of their average distance from the Sun. Regions depleted of asteroids are often coincident with orbital resonances, the latter being a mechanism by which objects in the belt can be scattered into enter Earth-crossing orbits (image credit: Alan Chamberlain, JPL/Caltech).
Thus it appears that the terrestrial impact record may be tied to periodic and random phenomena, and comet/asteroid showers can stem from both. However, reconstructing that terrestrial impact record is rather difficult as Earth is geologically active (by comparison to the present Moon where craters from the past are typically well preserved). Thus smaller and older impactors are undersampled. The impact record is also incomplete since a sizable fraction of impactors strike the ocean. Nevertheless, an estimated frequency curve for terrestrial impacts as deduced by Rampino and Haggerty 1996 is reproduced below. Note that there is considerable uncertainty in such determinations, and the y-axis in the figure highlights the “Typical Impact Interval”.
Estimated frequency of impactors as a function of diameter, energy yield, and typical impact interval. Results assume an impact speed of 20 km/s and density of 3 g/cm^3 (image credit: Fig. 2 from Rampino and Haggerty 1996, NASA ADS/Springer).
In sum, as noted by Eugene Shoemaker, large objects do indeed fall out of the sky and cause damage. It is unclear when in the near or distant future humanity will be forced to rise to the challenge and counter an incoming larger impactor, or again deal with the consequences of a smaller impactor that went undetected and caused human injuries (the estimated probabilities aren’t reassuring given their uncertainty and what’s in jeopardy). Humanity’s technological progress and scientific research must continue unabated (and even accelerated), thereby affording us the tools to better tackle the described situation when it arises.
Is discussion of this topic fear mongering and alarmist in nature? The answer should be obvious given the fireball explosion that happened recently over the Ural mountains, the Tunguska event, and past impactors. Given the stakes excessive vigilance is warranted.
Fareed Zakharia’s discussion with Neil deGrasse Tyson is below.
President Obama & Nichelle Nichols (image credit: Nichelle Nichols).
On March 1st 2013, President Obama awoke hoards of Star Trek and Star Wars fans when during a press conference he (purposely?) fused a Jedi Mind Trick and Vulcan Mind Meld into a: Jedi Mind Meld. According to White House transcripts, President Obama was responding to CNN’s Jessica Yellin’s remark that he should have the leadership to force Congress to accept a deal to avert the damaging sequester. President Obama replied to her by first stating that he was not a dictator, and second that he would not use a Jedi Mind Meld to coerce Congress into accepting a deal.
For those who are unaware, a Vulcan Mind Meld and Jedi Mind Trick are indeed different. Two videos are posted below that shed light on that difference. The first video features Spock performing a Vulcan Mind Meld (Star Trek), and the second involves Obi-Wan Kenobi inacting a Jedi Mind Trick (Star Wars).
Although the pundits initially believed that the President’s mixing of terms was a mistake, experts in some quarters now believe that by using a Jedi Mind Meld President Obama could simulatenously ascertain both his foes’ true intentions and coerce them into accepting a deal. The President may have likewise been contemplating how Congress could be spurred into action, and perhaps thought as a last resort he’d recruit Star Trek and Star Wars fans worldwide to pressure Congress. Toward that end the White House released the following image via their Twitter feed, and also launched the website http://www.wh.gov/jedimindmeld/:
The White House released this image and created the following website (http://www.wh.gov/jedimindmeld) to raise awareness of the damaging sequester (image credit: White House).
However, Leonard Nimoy (Spock) has weighed into ‘Meld-gate’, and advised President Obama to forget about Jedi Mind Tricks altogether since, “Only a Vulcan mind meld will help with this congress. Live Long and Prosper.“
President Obama isn’t the only politician who happens to be an avid Star Trek fan. King Abdullah II of Jordan was lucky enough to make a cameo on Star Trek Voyager. Will President Obama be making a cameo in the new Star Trek film “Into the Darkness” directed by J. J. Abrams? Incidentally, Abrams will likewise be directing the new Star Wars: Episode VII movie. Perhaps the President is on to something?
A billion years after the big bang, hydrogen atoms were mysteriously torn apart into a soup of ions. Credit: NASA/ESA/A. Felid (STScI)).
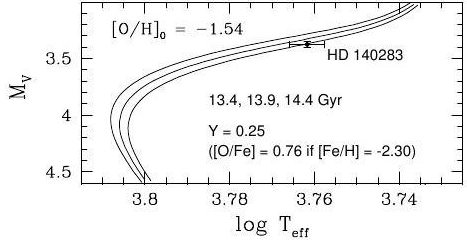
A metal-poor star located merely 190 light-years from the Sun is 14.46+-0.80 billion years old, which implies that the star is nearly as old as the Universe! Those results emerged from a new study led by Howard Bond. Such metal-poor stars are (super) important to astronomers because they set an independent lower limit for the age of the Universe, which can be used to corroborate age estimates inferred by other means.
In the past, analyses of globular clusters and the Hubble constant (expansion rate of the Universe) yielded vastly different ages for the Universe, and were offset by billions of years! Hence the importance of the star (designated HD 140283) studied by Bond and his coauthors.
“Within the errors, the age of HD 140283 does not conflict with the age of the Universe, 13.77 ± 0.06 billion years, based on the microwave background and Hubble constant, but it must have formed soon after the big bang.” the team noted.
Metal-poor stars can be used to constrain the age of the Universe because metal-content is typically a proxy for age. Heavier metals are generally formed in supernova explosions, which pollute the surrounding interstellar medium. Stars subsequently born from that medium are more enriched with metals than their predecessors, with each successive generation becoming increasingly enriched. Indeed, HD 140283 exhibits less than 1% the iron content of the Sun, which provides an indication of its sizable age.
HD 140283 had been used previously to constrain the age of the Universe, but uncertainties tied to its estimated distance (at that time) made the age determination somewhat imprecise. The team therefore decided to obtain a new and improved distance for HD 140283 using the Hubble Space Telescope (HST), namely via the trigonometric parallax approach. The distance uncertainty for HD 140283 was significantly reduced by comparison to existing estimates, thus resulting in a more precise age estimate for the star.
HD 140283 is estimated to be 14.46+-0.80 billion years old. On the y-axis is the star’s pseudo-luminosity, on the x-axis its temperature. Computed evolutionary tracks (solid lines ranging from 13.4 to 14.4 billion years) were applied to infer the age (image credit: adapted from Fig 1 in Bond et al. 2013 by D. Majaess, arXiv).
The team applied the latest evolutionary tracks (basically, computer models that trace a star’s luminosity and temperature evolution as a function of time) to HD 140283 and derived an age of 14.46+-0.80 billion years (see figure above). Yet the associated uncertainty could be further mitigated by increasing the sample size of (very) metal-poor stars with precise distances, in concert with the unending task of improving computer models employed to delineate a star’s evolutionary track. An average computed from that sample would provide a firm lower-limit for the age of the Universe. The reliability of the age determined is likewise contingent on accurately determining the sample’s metal content. However, we may not have to wait long, as Don VandenBerg (UVic) kindly relayed to Universe Today to expect, “an expanded article on HD 140283, and the other [similar] targets for which we have improved parallaxes [distances].”
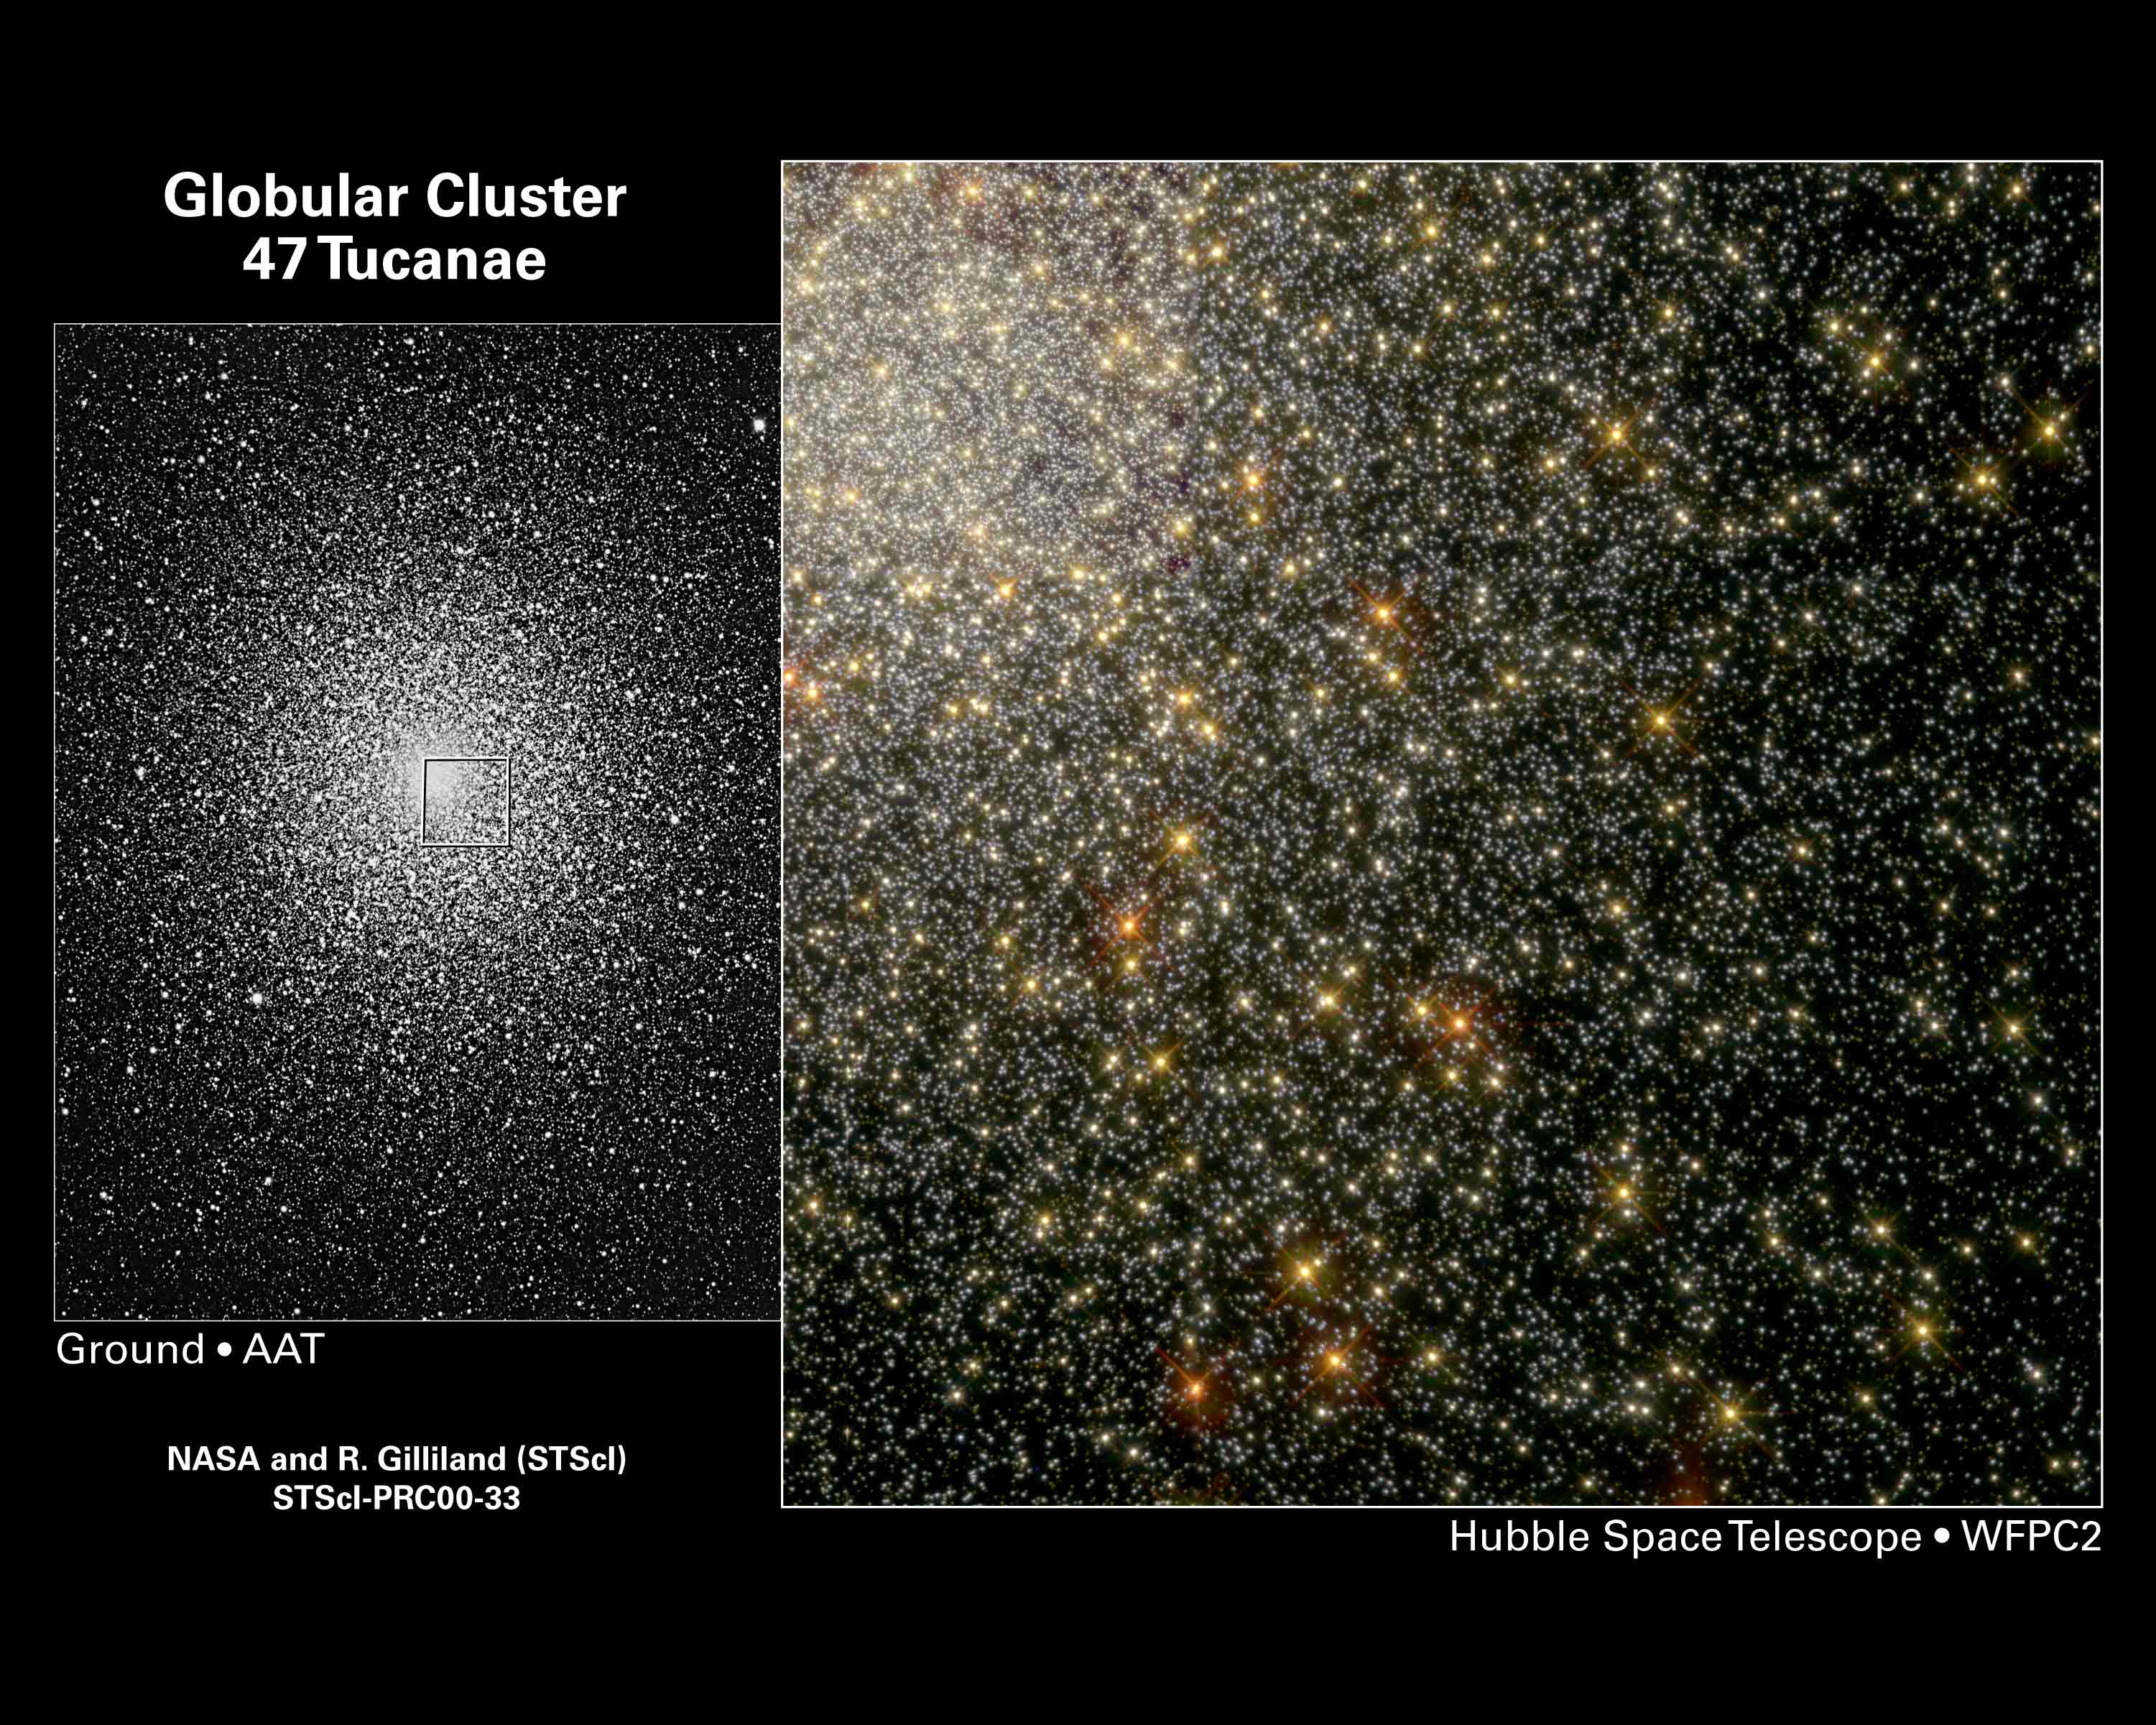
As noted at the outset, analyses of globular clusters and the Hubble constant yielded vastly different ages for the Universe. Hence the motivation for the Bond et al. 2013 study, which aimed to determine an age for the metal-poor star HD 140283 that could be compared with existing age estimates for the Universe. The discrepant ages stemmed partly from uncertainties in the cosmic distance scale, as the determination of the Hubble constant relied on establishing (accurate) distances to galaxies. Historical estimates for the Hubble constant ranged from 50-100 km/s/Mpc, which defines an age spread for the Universe of ~10 billion years.
Age estimates for the Universe as inferred from globular clusters and the Hubble constant were previously in significant disagreement (image credit: NASA, R. Gilliland (STScI), D. Malin (AAO)).
The aforementioned spread in Hubble constant estimates was certainly unsatisfactory, and astronomers recognized that reliable results were needed. One of the key objectives envisioned for HST was to reduce uncertainties associated with the Hubble constant to <10%, thus providing an improved estimate for the age of the Universe. Present estimates for the Hubble constant, as tied to HST data, appear to span a smaller range (64-75 km/s/Mpc), with the mean implying an age near ~14 billion years.
Determining a reliable age for stars in globular clusters is likewise contingent on the availability of a reliable distance, and the team notes that “it is still unclear whether or not globular cluster ages are compatible with the age of the Universe [predicted from the Hubble constant and other means].” Globular clusters set a lower limit to the age of the Universe, and their age should be smaller than that inferred from the Hubble constant (& cosmological parameters).
In sum, the study reaffirms that there are old stars roaming the solar neighborhood which can be used to constrain the age of the Universe (~14 billion years). The Sun, by comparison, is ~4.5 billion years old.
The team’s findings will appear in the Astrophysical Journal Letters, and a preprint is available on arXiv. The coauthors on the study are E. Nelan, D. VandenBerg, G. Schaefer, and D. Harmer. The interested reader desiring complete information will find the following works pertinent: Pont et al. 1998, VandenBerg 2000, Freedman & Madore (2010), Tammann & Reindl 2012.
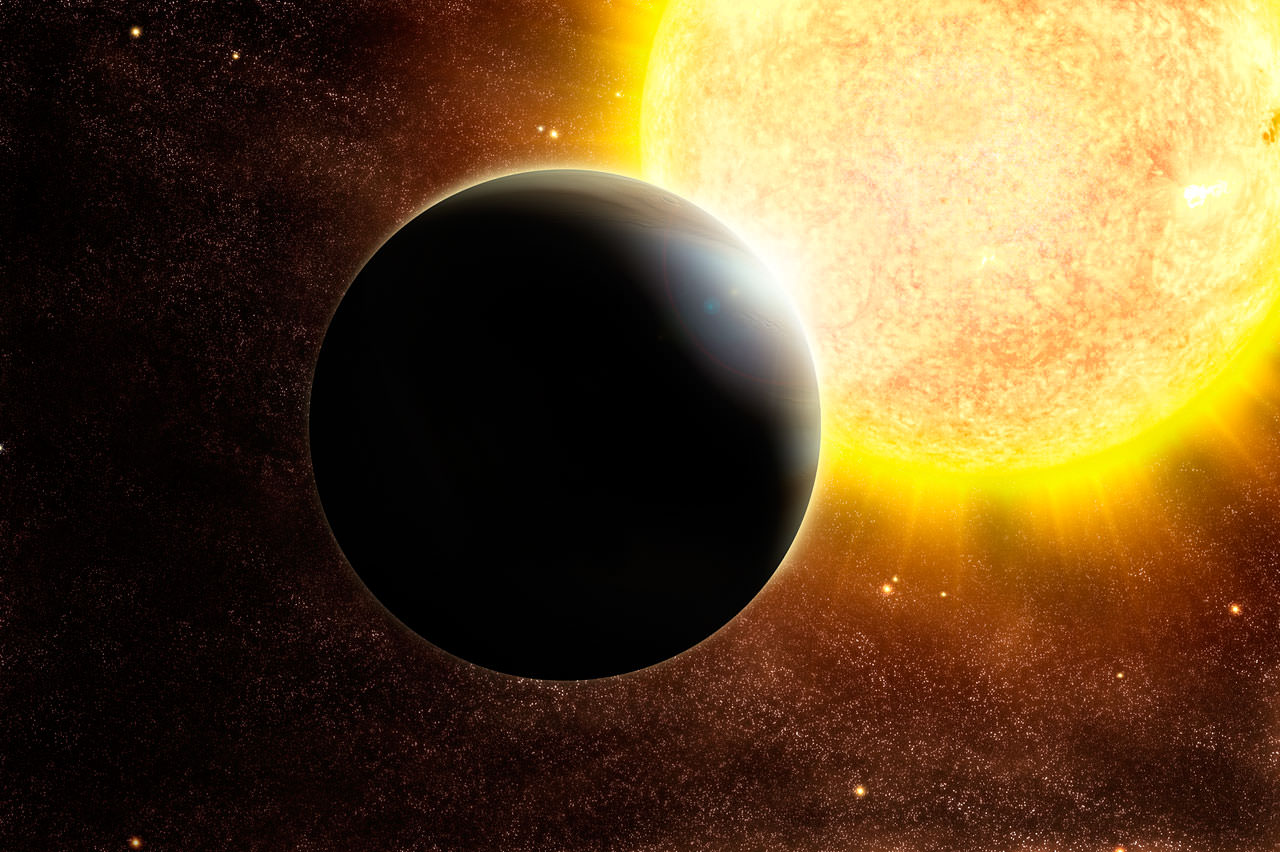
Despite advances in exoplanet research over the past decade much remains unknown. For example, how do the detection rates of giant planets vary as a function of the host star’s metal content? Are giant planets more frequent around massive stars? Do giant planets form under different mechanisms depending on the star’s metal content?
To that end a team of astronomers led by Annelies Mortier and Nuno C. Santos explored what mathematical function characterizes the detection rate across a distribution of stars (i.e., from metal-rich to metal-poor objects). “Finding the exact functional form of the metallicity-planet detection frequency will foster our understanding of both planet formation and the number of planets roaming the galaxy,” Santos told Universe Today.
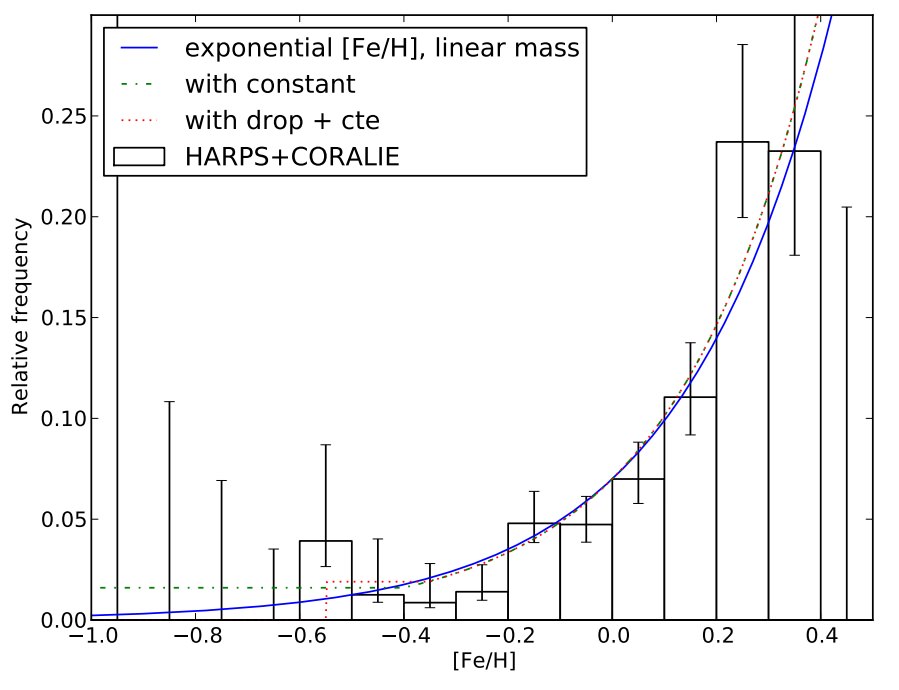
Giant planets are most often found around metal-rich stars, and a figure from the team’s study (shown below) reaffirms that ~25% of stars featuring twice the Sun’s metal content host a giant planet, while the probability falls to ~5% for stars with a metal content analogous to the Sun.
Establishing that metal-rich stars exhibit an increased probability of hosting a giant planet constrains planet formation models. Specifically, the observations suggest that larger metallicity promotes the growth of rocky/icy cores, which subsequently accrete gas. However, the team notes that although the giant planet-metallicity trend is solid for stars exhibiting metallicities greater than (or analogous to) the Sun, the results are less certain for metal-poor stars. Indeed, there is an active debate in the literature pertaining to what function links the metal-rich and metal-poor regimes. In particular, does an exponential decline extend into the metal-poor regime, or does the function level off?
Depending on the manner in which the frequency trend extends into the metal-poor regime, it may indicate that a separate mechanism is responsible for creating that subsample’s giant planets. Thus continued surveys of metal-poor stars are important, despite the decreased frequency of finding a giant planet. Moreover, Mortier (Centro de Astrofisica, Universidade do Porto) notes that, “Studying metal-poor stars should be encouraged, since several theoretical models show that Earth-like planets are more common around these stars than around their metal-rich counterparts.”
Frequency of giant planets as a function of metallicity (credit: Mortier et al., arXiv 1302.1851).
The team focused their efforts on trying to discern a difference between the viability of various functional forms in the metal-poor regime (i.e., does the detection rate of giant planets in that domain flatten, rather than decline exponentially?). In the end no statistical difference was found between the scenarios, and it was likewise unclear whether a mass-dependence exists behind the frequency of giant planet detections. The team noted that a larger sample was needed to reach definitive conclusions, and added that ongoing surveys to discover planets would ensure the problem may soon be resolved.
“Kepler and Gaia will significantly increase the amount of planet discoveries, not only for giant planets, but also for smaller planets,” said Mortier.
In sum, to answer the questions posed at the outset planet-hunting efforts should be focused on metal-poor and metal-rich stars, despite the former exhibiting a reduced frequency of giant planets. The team’s findings will appear in Astronomy & Astrophysics, and a preprint is available on arXiv. The results from the study are tied in part to observations acquired via the HARPS (High Accuracy Radial Velocity Planet Searcher) instrument, which is shown below.


!["The history of the discovery of the expansion of the Universe may be summarized [above]", S. van den Bergh 2011. Image credit: S. van den Bergh/JRASC/arXiv.](https://www.universetoday.com/wp-content/uploads/2013/04/history.jpg)


.")