
The reality of Climate Change has become painfully apparent in recent years, thanks to extended droughts in places like California, diminishing water tables around the world, rising tides, and coastal storms of increasing intensity and frequency. But perhaps the most measurable trend is the way that average global temperatures have kept rising year after year.
And this has certainly been the case for the year of 2016. According to independent analyses provided by NASA’s Goddard Institute for Space Studies (GISS) and the National Oceanic and Atmospheric Agency (NOAA), 2016 was the warmest year since modern record keeping began in 1880. This represents a continuation of a most alarming trend, where 16 of the 17 warmest years on record have occurred since 2001.
Based in New York, GISS conducts space and Earth sciences research, in support of the Goddard Space Flight Center’s (GSFC) Sciences and Exploration Directorate. Since its establishment in 1961, the Institute has conducted valuable research on Earth’s structure and atmosphere, the Earth-Sun relationship, and the structure and atmospheres of other planets in the Solar System.

Their early studies of Earth and other solar planets using data collected by satellites, space probes, and landers eventually led to GISS becoming a leading authority on atmospheric modeling. Similarly, the NOAA efforts to monitor atmospheric conditions and weather in the US since 1970s has led to them becoming a major scientific authority on Climate Change.
Together, the two organizations looked over global temperature data for the year of 2016 and came to the same conclusion. Based on their assessments, GISS determined that globally-averaged surface temperatures in 2016 were 0.99 °C (1.78 °F) warmer than the mid-20th century mean. As GISS Director Gavin Schmidt put it, these findings should silence any doubts about the ongoing nature of Global Warming:
“2016 is remarkably the third record year in a row in this series. We don’t expect record years every year, but the ongoing long-term warming trend is clear.”
The NOAA’s findings were similar, with an average temperature of 14.83 °C (58.69 °F) being reported for 2016. This surpassed last year’s record by about 0.004 °C (0.07 °F), and represents a change of around 0.94 °C (1.69 F) above the 20th century average. The year began with a boost, thanks to El Nino; and for the eight consecutive months that followed (January to August) the world experienced record temperatures.
This represents a consistent change since 2001, where average global temperatures have increased, leading to of the 16 warmest years on record since 1880 in a row. In addition, on five separate occasions during this period, the annual global temperature was record-breaking – in 2005, 2010, 2014, 2015, and 2016, respectively.

With regards to the long-term trend, average global temperatures have increased by about 1.1° Celsius (2° Fahrenheit) since 1880. This too represents a change, since the rate of increase was placed at 0.8° Celsius (1.4° Fahrenheit) back in 2014. Two-thirds of this warming has occurred since 1975, which coincides with a period of rapid population growth, industrialization, and increased consumption of fossil fuels.
And while there is always a degree of uncertainty when it comes to atmospheric and temperature modelling, owing to the fact that the location of measuring stations and practices change over time, NASA indicated that they were over 95% certain of these results. As such, there is little reason to doubt them, especially since they are consistent with what is at this point a very well-documented trend.
To see an animated graph of average global temperature increases since 1880, click here. To see the full data set and learn about the methods employed by GISS, click here.
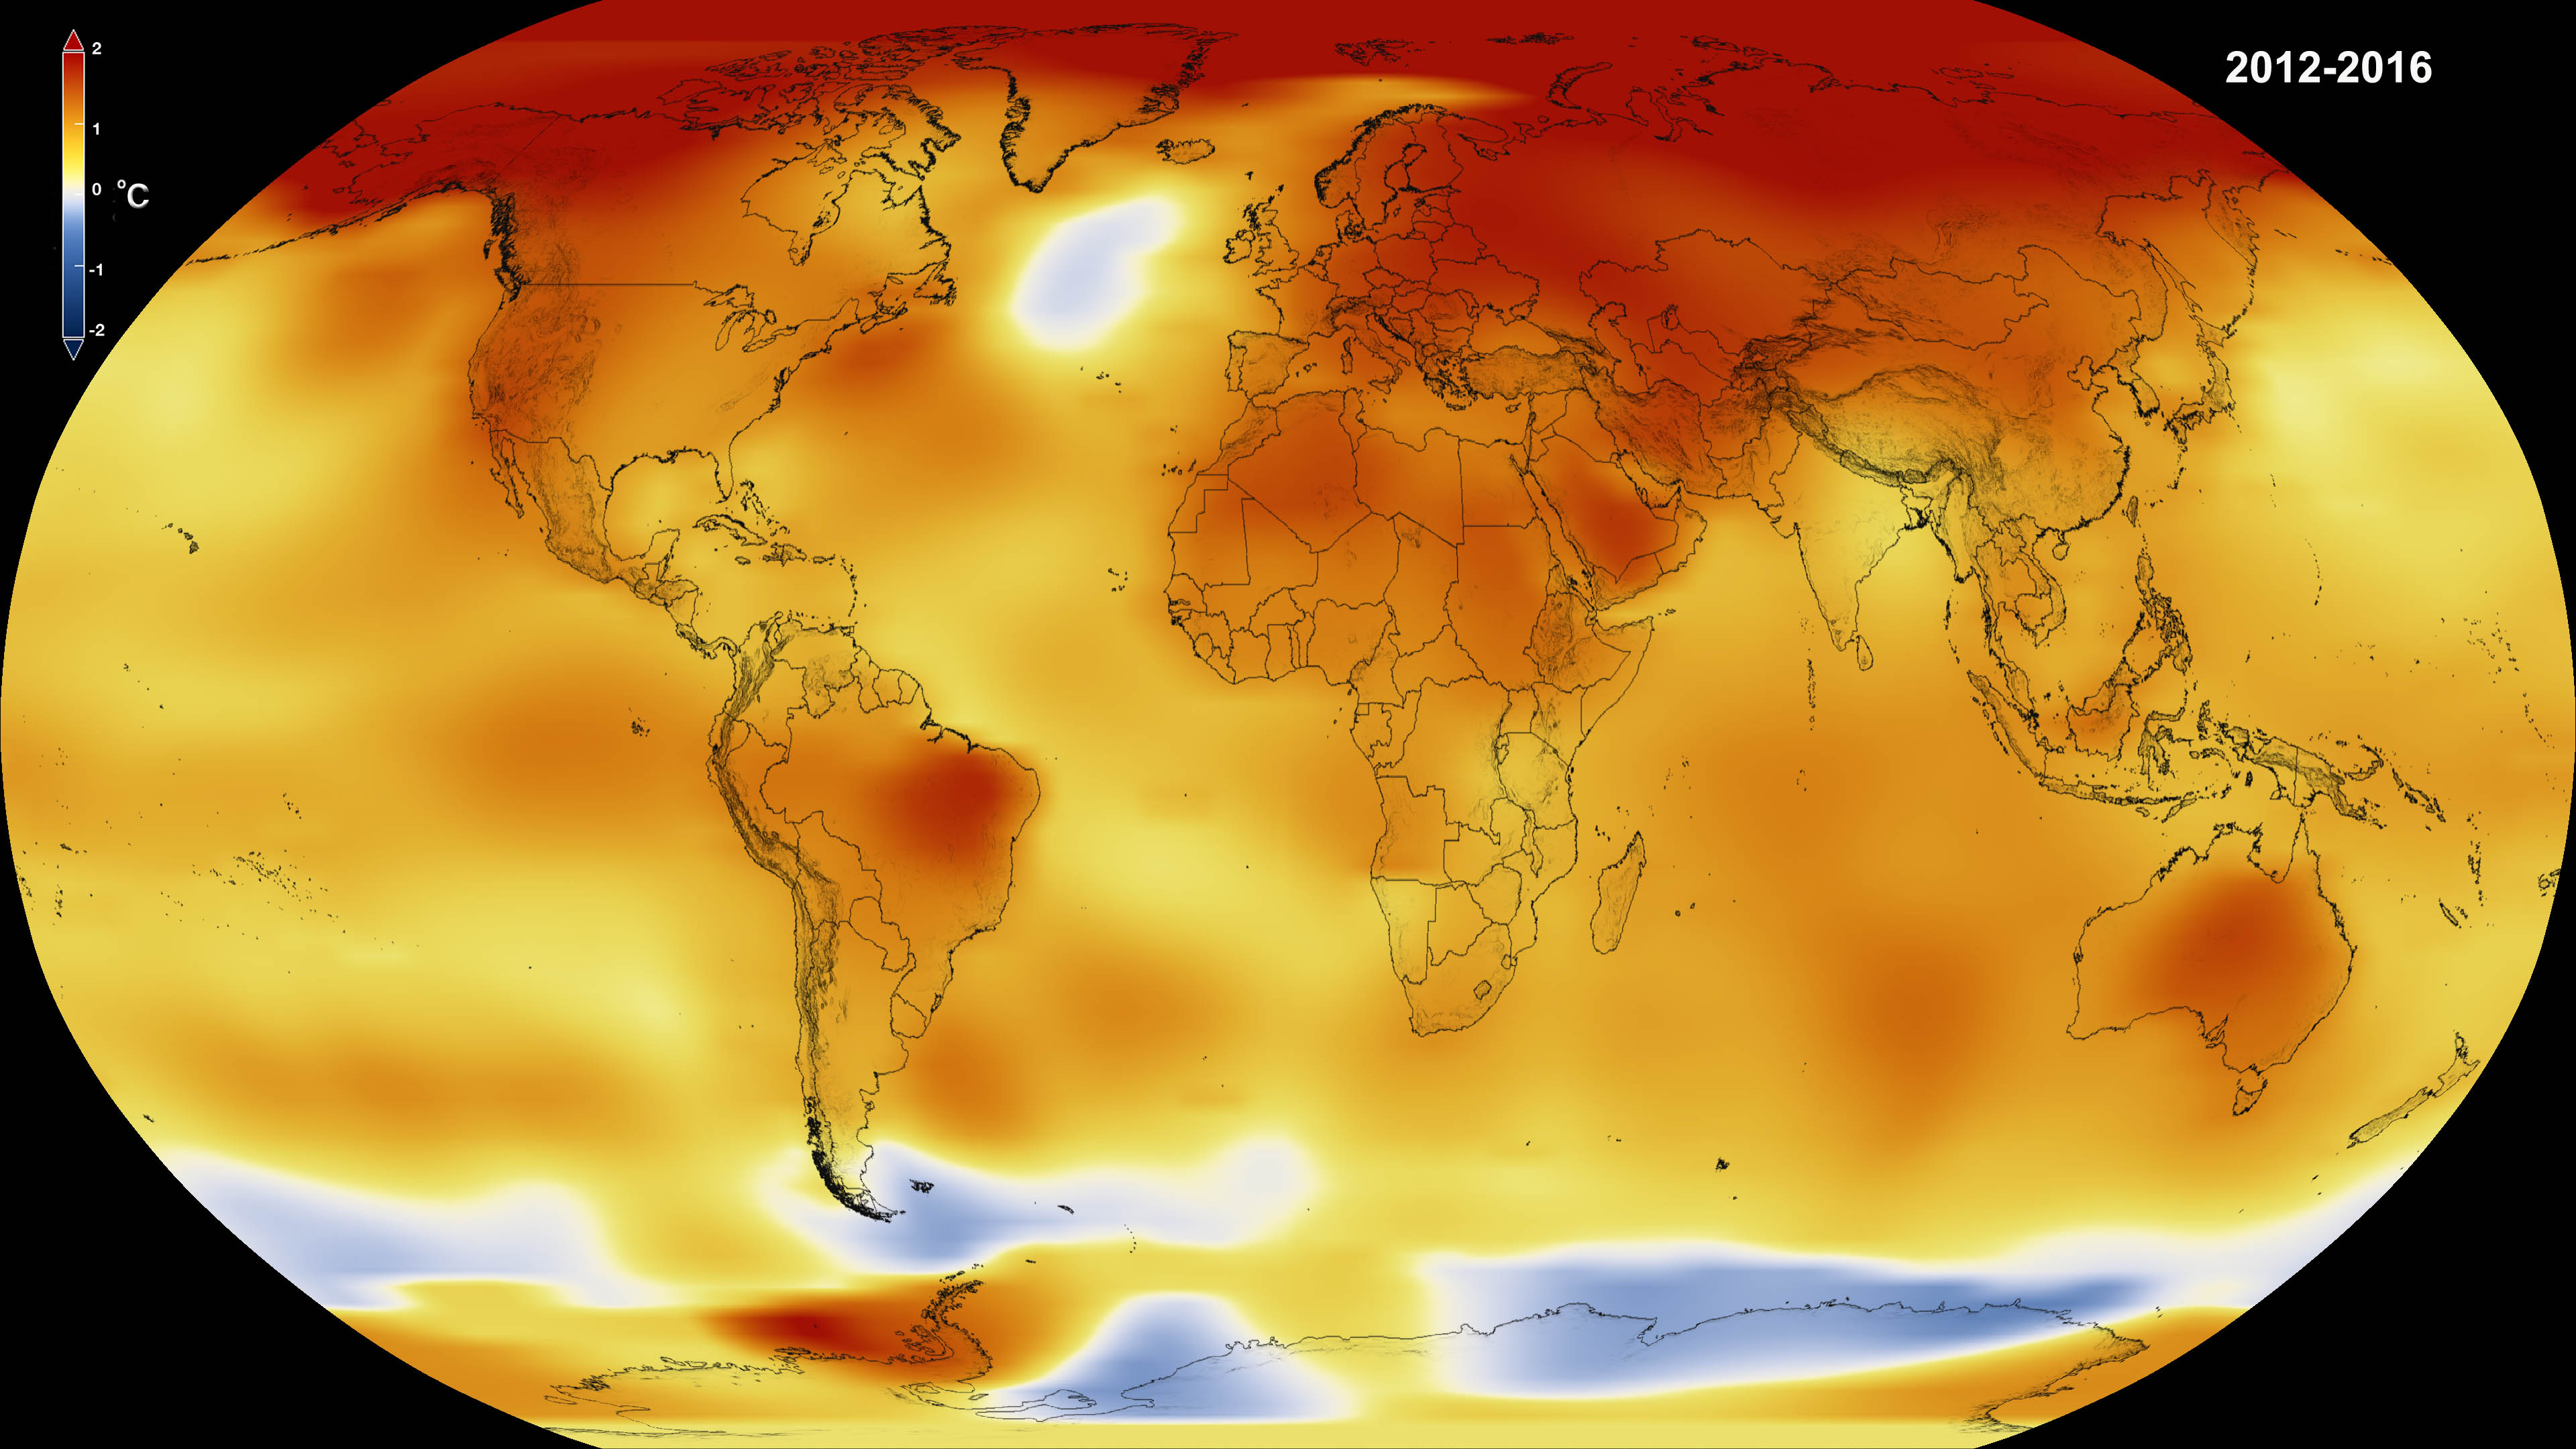
And be sure to check out this NASA video that shows these changes on a global map:
The reality of numbers being fudged has become painfully clear….
Yeah, that should fix the opening line.
If this is true: “With regards to the long-term trend, average global temperatures have increased by about 1.1° Celsius (2° Fahrenheit) since 1880. This too represents a change, since the rate of increase was placed at 0.8° Celsius (1.4° Fahrenheit) back in 2014.”
We are already past terminal velocity of heat increase. Nothing man can do will stop this climate from going to a run away Green House. Why? How? We have increased the change from 1880 to now by 0.3 degrees Celsius (0.6 degrees Fahrenheit) over the entire 120 years of the survey. That’s all in 3 years. We would be boiling hot by now, and melting rock in a few years. Thank God that’s not happening. So, this article is just a bunch of BS scare tactics to get more money from Washington for NASA’s pet projects. Maybe it’s about time to eliminate NASA and just go 100% private and let the private companies do the work for profit?
I can’t help but think you didn’t understand what they were saying. I believe the confusion was with their use of the word rate. They weren’t trying to say that temperature was increasing by .8 degrees Celsius a year, but instead the rate of temperature increase put us at about .8 degrees Celsius greater on average than 1880. As of this year, we bumped that up to about 1.1 degrees Celsius greater than 1880 (with a small margin of error here and there).
So they’re saying that we are still increasing global average temperature as per the trend found in recent decades and this year reached an average of 1.1 degrees Celsius greater than in 1880, which is nothing extreme, like boiling oceans and rock melting, but is still an important change nonetheless
In three years we changed our rate of change by over 300%. That’s boiling water off the face of the Earth in a few years if it keeps increasing at the new change rate.
“In three years we changed our rate of change by over 300%. That’s boiling water off the face of the Earth in a few years if it keeps increasing at the new change rate.”
Um, what? In two years we increased the global average temperature by about .3 degrees Celsius according to this data. So if we’re going from a rough average temperature for the planet, 15 degrees Celsius, it would take 6.5 years for the average to even increase another one degree Celsius, much less the 85 (give or take some) it would need to boil water. To be honest, you’re coming off as a troll talking about extremes like you are. In fact it’s almost incoherent.
Obviously you do not understand what I said.
Here, let me explain it.
The Earth has a Global Temperature.
The Global Temperature Varies. <– This is where you are stuck at.
The Variance of the Varies. <– This is where I am at. This doesn't change very much through out history unless we had a catastrophic event which kills off life. According to the new stats. We just underwent a catastrophic event.
You, sir, have just won the science communicator prize! If only our greatest minds could convey this is such simple terms… they’d probably still be labelled as “alarmists” 🙂
“Obviously you do not understand what I said.
Here, let me explain it.
The Earth has a Global Temperature.
The Global Temperature Varies. <– This is where you are stuck at.
The Variance of the Varies. <– This is where I am at. This doesn't change very much through out history unless we had a catastrophic event which kills off life. According to the new stats. We just underwent a catastrophic event."
No, I did not understand what you were saying as nothing you said previously hardly referenced this at all. I still don't understand what you were on about with boiling water off the face of the earth even with what you're saying now. From what I can understand from you, you're saying the changes we're seeing now are the same level of changes seen during catastrophes in earth's past. In which case that sounds somewhat reasonable, as we have made quite the rapid change in the earth's environment on the geologic timescale, but as I am somewhat unfamiliar with what you're talking about, this is just a guess
And yet, we all know that from 2001 – 2015 temps were on pause. So now the ‘numbers’ have been ‘adjusted’ and suddenly the temps are records every year. Rubbish!
No, the numbers are precisely what have been derived by both NASA and NOAA. What’s more, you have your facts completely wrong. Between 2000 and 2010, the rate of increase was not as high as it was in the previous decade. But there was no “pause”. Since 2010, the trend has continued, with increases not as severe, but still setting record temperatures. You might want to get your facts straight before making claims like “we all know”.
http://earthobservatory.nasa.gov/Features/WorldOfChange/decadaltemp.php
https://www.ncdc.noaa.gov/sotc/global/201013
Ah, once again empirical fact trumps ideological opinion! Nice work, Matt! 😉
I love how the ideologues take one statement and warp it out of shape to fit the oil company funded rhetoric. It’s pretty much classic obfuscation; a pathetic attempt to muddy the waters, as they can’t offer any numbers that can actually oppose the empirical data.
This is not Astronomy or Cosmology.
The search for life is a large part both Astronomy and Cosmology.. Lets just consider the climate change aspect a variable of the drake equation.. Ie, if other alien races are stupid enough to poison their planets with profuse amounts of petrochemical (and other) waste products, it would go a long way towards explaining the lack of evidence of ET’s so far…
https://en.wikipedia.org/wiki/Drake_equation
” …
The astronomer Carl Sagan speculated that all of the terms, except for the lifetime of a civilization, are relatively high and the determining factor in whether there are large or small numbers of civilizations in the universe is the civilization lifetime, or in other words, the ability of technological civilizations to avoid self-destruction. In Sagan’s case, the Drake equation was a strong motivating factor for his interest in environmental issues and his efforts to warn against the dangers of nuclear warfare.
…”
Here’s something to think about:
The Vikings must have been the most industrialist nation ever. Why? By the time they found Greenland, it was a Green open land suitable for crops every year. How did it get so warm to melt that Ice Cap? Global Warming! That’s how. Try to say with a straight face that the Vikings caused Global Warming. And that was much much higher temps than we have today.
Umm, yeah, about that notion of Greenland being green? A study published December 4, 2015, suggests that the climate of Greenland was already cold when Viking settlers arrived in the 10th century. The research, based on the study of erosion left by old glaciers challenges the popular notion that Vikings were able to colonize Greenland because of a period of unusually warm weather. “Greenland is unlikely to have been radically different 1,000 years ago since the ice sheet is at least 400,000 years old. So the evidence shows that not only was Greenland not green, any warmth was mainly a regional phenomenon caused by natural factors.” (the Medieval Warm Period) https://www.skepticalscience.com/greenland-used-to-be-green.htm