
[/caption]
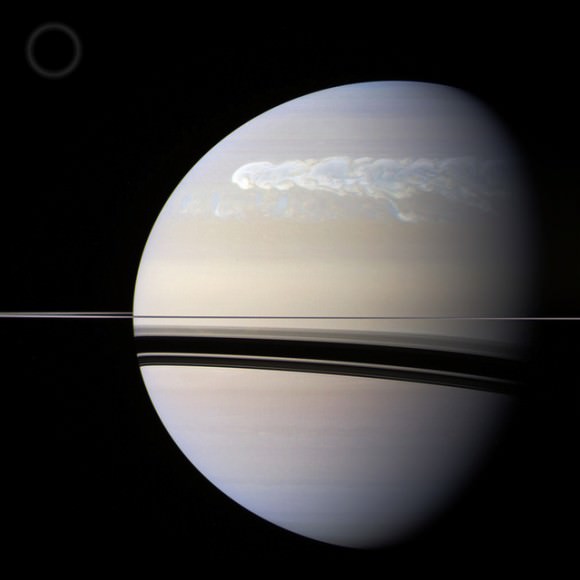
First seen by amateur astronomers back in December, the powerful seasonal storm that has since bloomed into a planet-wrapping swath of churning clouds has gotten some scrutiny by Cassini and the European Southern Observatory’s Very Large Telescope array situated high in the Chilean desert.
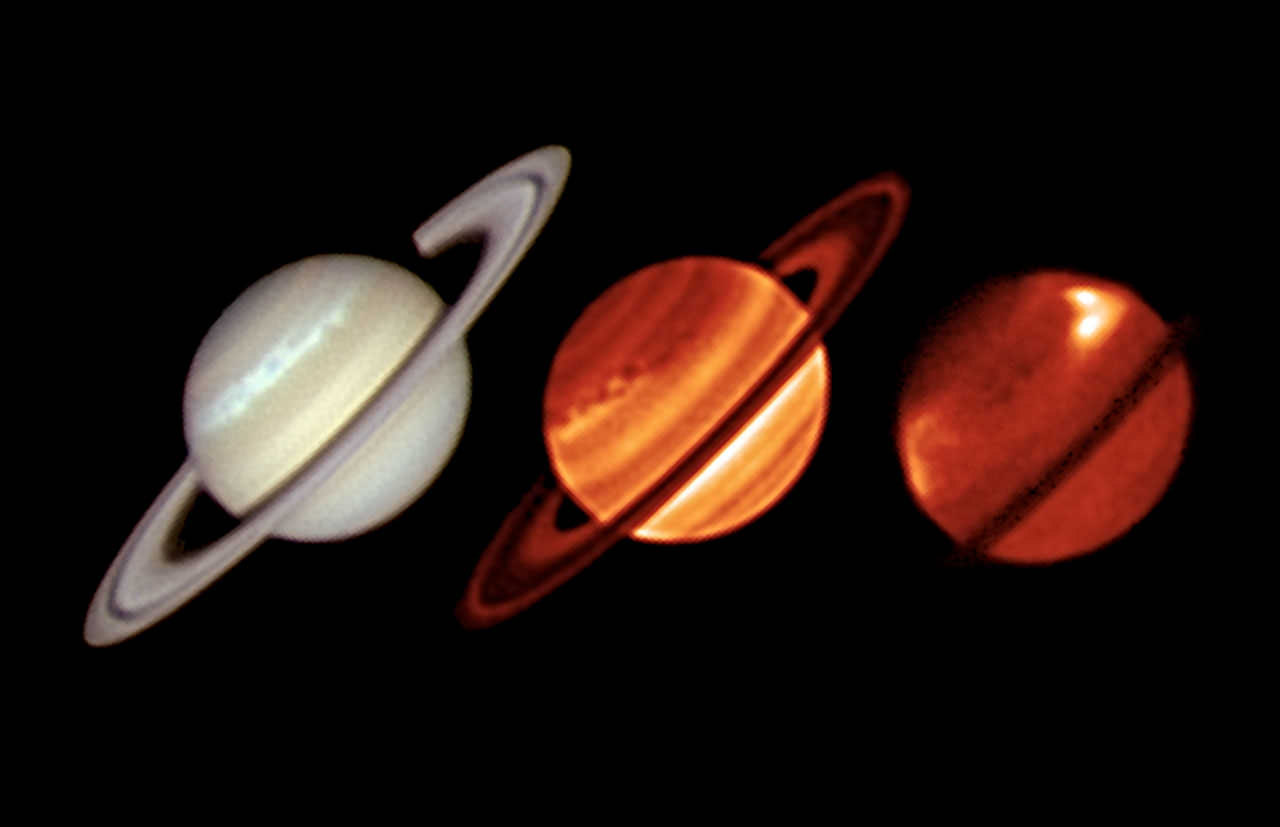
The image above shows three views of Saturn acquired on January 19: one by amateur astronomer Trevor Barry taken in visible light and the next two by the VLT’s infrared VISIR instrument – one taken in wavelengths sensitive to lower atmospheric structures one sensitive to higher-altitude features.
While the storm band can be clearly distinguished in the visible-light image, it’s the infrared images that really intrigue scientists. Bright areas can be seen along the path of the storm, especially in the higher-altitude image, marking large areas of upwelling warmer air that have risen from deep within Saturn’s atmosphere.
Normally relatively stable, Saturn’s atmosphere exhibits powerful storms like this only when moving into its warmer summer season about every 29 years. This is only the sixth such storm documented since 1876, and the first to be studied both in thermal infrared and by orbiting spacecraft.
The initial vortex of the storm was about 5,000 km (3,000 miles) wide and took researchers and astronomers by surprise with its strength, size and scale.
“This disturbance in the northern hemisphere of Saturn has created a gigantic, violent and complex eruption of bright cloud material, which has spread to encircle the entire planet… nothing on Earth comes close to this powerful storm.”
– Leigh Fletcher, lead author and Cassini team scientist at the University of Oxford in the United Kingdom.
The origins of Saturn’s storm may be similar to those of a thunderstorm here on Earth; warm, moist air rises into the cooler atmosphere as a convective plume, generating thick clouds and turbulent winds. On Saturn this mass of warmer air punched through the stratosphere, interacting with the circulating winds and creating temperature variations that further affect atmospheric movement.
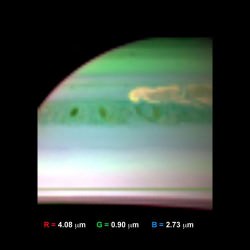
The temperature variations show up in the infrared images as bright “stratospheric beacons”. Such features have never been seen before, so researchers are not yet sure if they are commonly found in these kinds of seasonal storms.
“We were lucky to have an observing run scheduled for early in 2011, which ESO allowed us to bring forward so that we could observe the storm as soon as possible. It was another stroke of luck that Cassini’s CIRS instrument could also observe the storm at the same time, so we had imaging from VLT and spectroscopy of Cassini to compare. We are continuing to observe this once-in-a-generation event.”
– Leigh Fletcher
A separate analysis using Cassini’s visual and infrared mapping spectrometer confirmed the storm is very violent, dredging up larger atmospheric particles and churning up ammonia from deep in the atmosphere. Other Cassini scientists are studying the evolving storm and a more extensive picture will emerge soon.
Read the NASA article here, or the news release from ESO here.
I wonder what causes this storm to happen every 29 years!
Saturn’s orbital period is about 29.46 Earth-years; it is 9.05 AU at its perihelion, and 10.12 AU at its aphelion; therefore, according to inverse-square law, Saturn receives about 25% more solar energy at its perihelion than at its aphelion.
I wonder what causes this storm to happen every 29 years!