
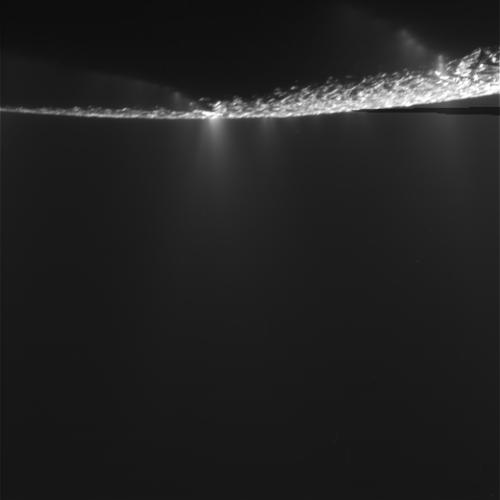
Raw images are already being returned from Cassini’s Nov. 21 “E-8” or eighth flyby of the tiger-striped moon Enceladus. Visible in this raw image are several plumes from fissures in the south polar region of the moon. These fissures spew jets of water vapor and other particles hundreds of kilometers from the surface. This flyby included a very different geometry to the flyby trajectory – and a different look at the plumes — approaching within 1,606 kilometers (997.9 miles) of the surface, buzzing over 82 degrees south latitude. This is the last look we’ll have for several years at this intriguing area of Enceladus before winter darkness blankets the area. See below for looks at Baghdad Sulcus, the “tiger stripe” that scientists were focusing on.

While Cassini was taking these high-resolution images of the southern part of the Saturn-facing hemisphere, the Composite Infrared Spectrograph (CIRS) instrument was collecting data to create a contiguous thermal map of Baghdad Sulcus. This image was taken approximately 1,858 kilometers away.

Here’s a look at Baghdad Sulcus from 3,556 kilometers away. And below is a 3-D version, created by Stu Atkinson. Stay tuned for more details on the data gathered from the flyby!

Source: Cassini raw images
Thanks to Stu for alerting us the images were here!
* The title is in reference to the “Fantasy Island” television show.
For some reason there’s a lot of striping like that in the raw images, but I DON’T CARE, THE PHOTOS ARE AWESOME! Love the first image, and those like it where you can see the sources of the plumes! Fantastic!!
NICE! Are the striped/stippled looking markings in the first two images, a camera artifact?
Oops.. I meant second and third images.
The limb photo is similar to the drawings made by Apollo astronauts of the “moon fountains”. I think the cause of those was said to be electrostatic uplifted dust. I wonder if these particles are charged as well.
Wow! Surely _now_ they must be able to pinpoint some vents?!
Though I’m still more interested in the particle/gas data from the 120 EN flyby. Still not a word…
Could be, depending on where they are created. If they are vented from way down, they can get tribologically charged – like when you charge your cat’s hair by stroking it.
The venting mechanism though is almost certainly a pressure process. My money is on the source being clathrates like the ones found or hypothesized elsewhere in the solar system; they seem ubiquitous. But it could also be a liquid source – you can find those too. 😀
Amazing, the value of mapping our solar system in images is just beyond measure, we really should fill our solar system with Cassini like probes. One for every moon and planet. Then follow it with a Google Solar system. 🙂
As for the Raw images, can anyone conjecture what we are seeing in this image;
http://saturn.jpl.nasa.gov/photos/raw/rawimagedetails/index.cfm?imageID=207335
Wave like ripples? Almost looks like a liquid surface. Certainly the most intriguing image out of the current set.
Damian
That 3D image was incredible!
Nice title, Tattoo. 🙂
WOW! Cassini rawks!
I don’t if I would say putting a Cassini-type craft around every planet, minor planet, and moon in the solar system would be a easy thang, but it certainly would be a valuable thang. And man, upgrading the bandwidth of the Deep Space Network to handle that traffic would be non-trivial – we might have to move it out to high earth orbit and have geosynchronous relays or something.
Budget nightmares like this require a lot more skills than I have.
But,yes, that first image especially, is AWESOME.
Aqua: those horizontal black lines are an artifact of data compression.
For many images, Cassini’s camera uses a lossless algorithm that assumes the output is going to be no more than 1/2 the size of the raw data.
This lossless algorithm is applied to every pair of lines – that is, lines #1 and #2, at 1024 pixels each, are combined to be treated as one chunk of data of 2048 pixels, which is then compressed and written to the spacecraft’s solid state recorder. Repeat until the whole image is done. Usually the result is well below 1024 bytes, and the image can be exactly reconstructed at JPL, without the kinds of artifacts you see in low-quality jpeg images.
Where there are a lot of craters, cracks, stars, or other visual busyness, the data won’t compress so well. Maybe the compressed data for a pair of lines turns out to be 3/4 the original size, say 1500 bytes. Only the first 1024 bytes are sent to Earth. This is enough to reconstruct all of the first line of the pair and about half of the second line. This sort of thing usually happens in runs of several pairs of lines in a row, creating that striping effect.
I oversimplify a bit since this could be 12 bit data, so one pixel isn’t necessarily one byte, but you get the idea.
btw, there *is* a bit of that effect in the first image, just a narrow band from the right level with the limb of Enceladus.
Some earlier Cassini raw images didn’t show that effect, because once upon a time we had a missing-data filler algorithm running, but it was decided at one point to not apply this to raw images.
Damian: those ripples are camera artifacts due to stray light entering the camera (from Saturn, the Sun, whatever) and bounding off camera internal structures and dust on the optical surfaces, which we see way out of focus and maybe with diffraction effects. Sometimes the angle of the stray light makes them look especially bad.