
Video Caption: NASA/JAXA’s GPM satellite measured record rainfall that fell over the Carolinas from September 26 to October 5, 2015 from a plume of moisture from Hurricane Joaquin when it was located over the Bahamas and moved to Bermuda. The IMERG showed highest rainfall totals near 1,000 mm (39.3 inches) in a small area of South Carolina and rainfall between 700 and 900 mm (27.5 and 37.4 inches) over a large area of South Carolina. Credits: SSAI/NASA/JAXA, Hal Pierce
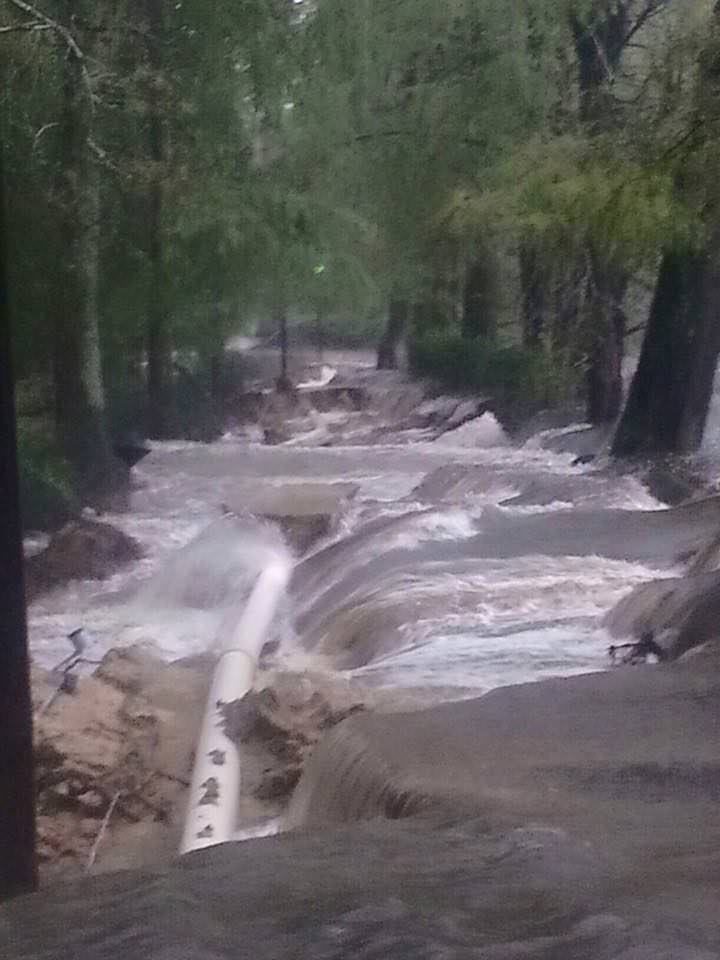
See below ground level images and videos of storm devastation
Story updated with additional details/imagery from NASA and South Carolina
NASA’s advanced Global Precipitation Measurement (GPM) weather satellite is continuously tracking and recording the ‘1000 Year’ rainfall event heaping death and devastation across wide areas of South Carolina from the combined actions of a freak Nor’easter and Hurricane Joaquin – which reached a borderline Cat 5 status on Saturday, Oct. 3 with winds of 150 mph.
South Carolina Gov. Nikki Haley declared the historic and torrential rain fall to be a “1000 Year event” on Sunday, Oct. 4. “We have never seen anything like this.” Governor Haley and President Obama issued a “State of Emergency.”
Although the horrendous rains in South Carolina may nearly be done, the nor’easter caused damage estimated to be in the Billions of Dollars and at least 9 storm related deaths as of today, Monday, Oct. 5.
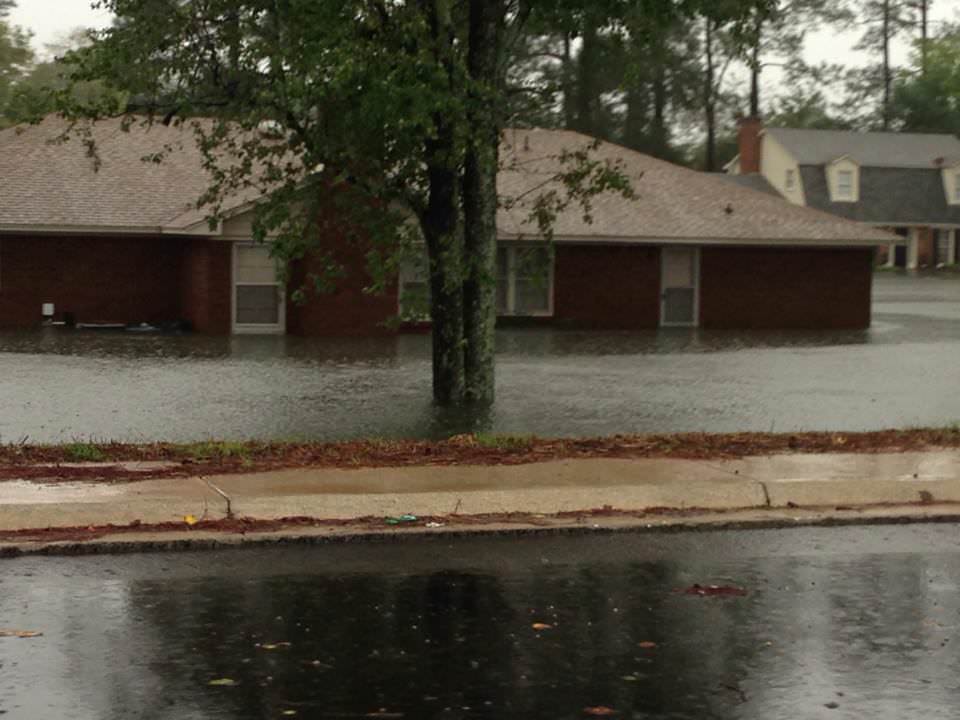
Rainfall totals ranging from 14 to 37 inches in local areas over the past week drenched a wide swath of the Palmetto state with never before seen flooding, according to NASA and NOAA. The most intense periods of rain fell over the weekend.
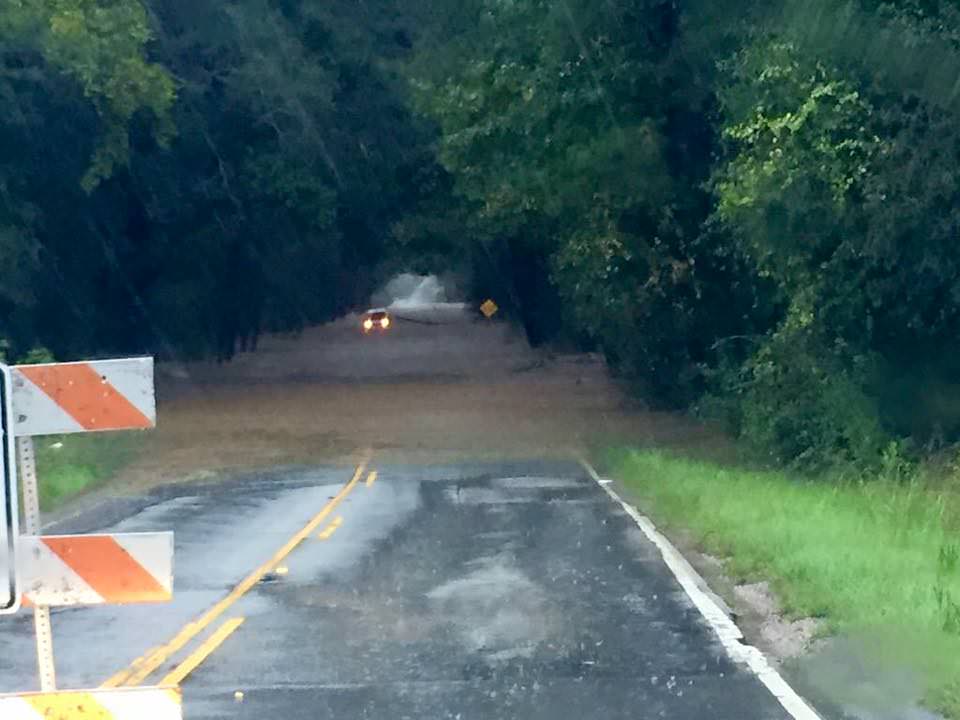
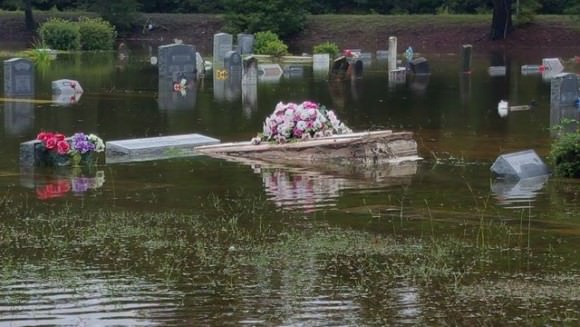
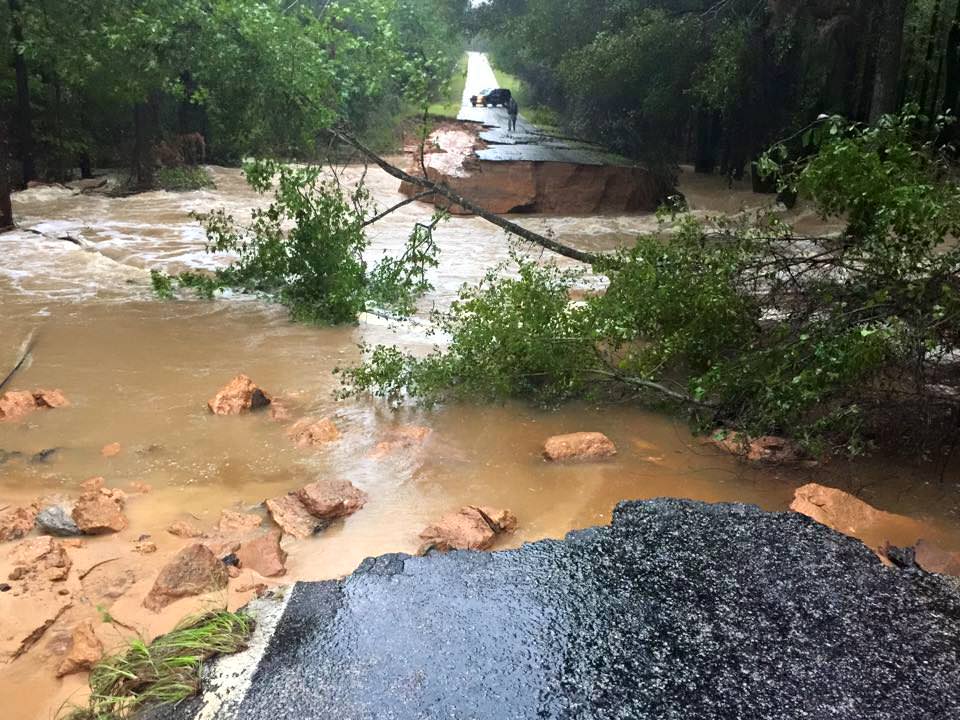
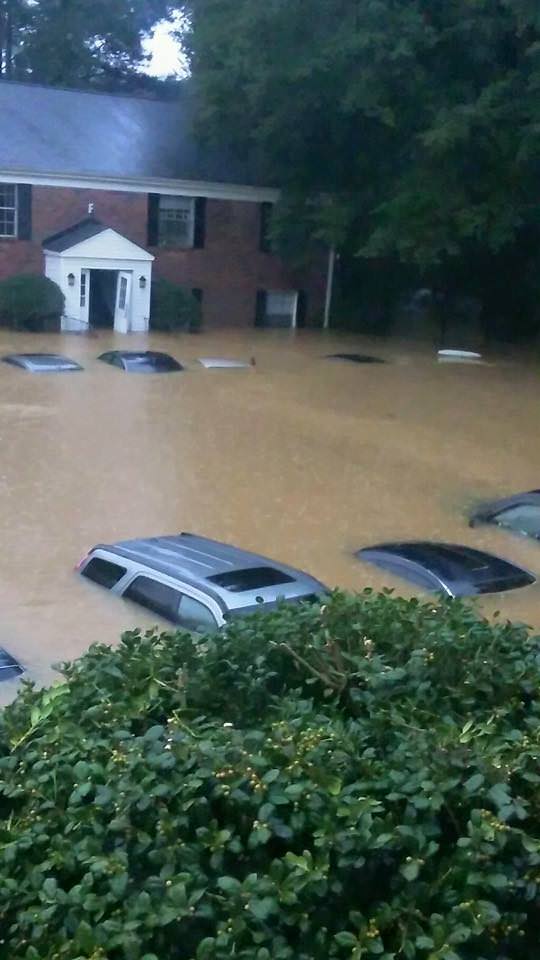
See herein a gallery of photos from friends and others living through the disaster in South Carolina.
NASA astronaut Scott Kelly also captured dramatic images of Hurricane Joaquin – as I reported earlier here.
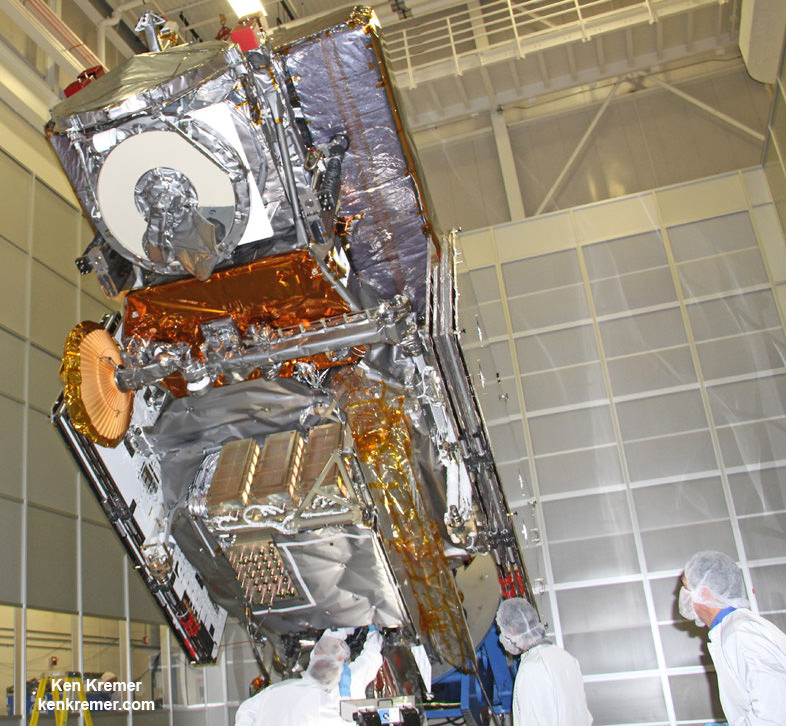
A slew of NASA and NOAA orbiting weather satellites are constantly tracking the fierce storms and providing the state and federal governments with the most up to date forecasts to aid officials and emergency responders in evaluating and managing the disaster in the most effective manner possible.
NASA’s GPM and a global fleet of other international weather monitoring satellites gathered measurements every 30 minutes from September 26 to October 5, 2015 that were combined into the eyepoppongly dramatic IMERG (Integrated Multi-satellitE Retrievals for GPM) color-coded video above. It tracks the massive growth, spread and direction of the storms and shows the historic levels of destructive precipitation generated by the lethal pair of powerful storms.
The NASA GPM video shows plumes of moisture from the Nor’Easter and Hurricane Joaquin as they gather force and moved over South Carolina and through the Caribbean around and over the Bahamas and later as Joaquin fortunately veered away from the US eastern seaboard towards Bermuda.
“The IMERG showed highest rainfall totals near 1,000 mm (39.3 inches) in a small area of South Carolina and rainfall between 700 and 900 mm (27.5 and 37.4 inches) over a large area of South Carolina,” says NASA’s Hal Pierce.
Here’s a NASA video with NASA scientist Dalia Kirschbaum describing how GPM can see inside a hurricane to makes rainfall and precipitation measurements in 3D:
Video caption: NASA scientist Dalia Kirschbaum explains how the Global Precipitation Measurement Mission’s Core observatory has an instrument that can see layer by layer through a storm.
The GPM precipitation measurements come from both of its advanced radar instruments – the dual-frequency precipitation (DPR) radar instrument (Ku and Ka band) and the GPM microwave imager (GMI), NASA scientist George Huffman told Universe Today.
The IMERG video is based on an algorithm that also carefully combines and calibrates measurements gathered every 30 minutes from the passive microwave sensors flying aboard a large international constellation of satellites from the US, Europe, Japan and India – and outlined in complete detail further below by NASA’s Huffman and Kirschbaum; exclusively for Universe Today.
The visualization of data was created by NASAs Goddard’s Space Flight Center and shows Hurricane Joaquin around the Bahamas “when it was a tropical storm. Red and green colors show rain and the ice and snow at the top of the storm is visualized in blue.”
“Understanding hurricane structure helps weather forecasters around the world determine a storm’s structure and where it may be going,” says Kirschbaum.
Hurricane Joaquin was still packing winds exceeding 125 mph this morning, but it has lost strength throughout the day.
Over 40,000 homes and businesses are without power today, Oct. 5, in South Carolina due to the unending rain and widespread catastrophic flooding. And many folks had to be evacuated.
Some cemeteries were uprooted with caskets seen floating down flooded streets.
Residents are warned to stay out of the flood waters and standing waters that can be carrying bacteria and diseases presenting a significant health hazard.
In the capitol city of Columbia, there was widespread flooding with severe damage to water mains that cut off drinking water to over 15,000 people.
The governor deployed over 1300 national guard troops to render assistance. Over 150 folks were rescued by helicopter, some from the rooftops of their homes and apartments.
Here’s a helicopter rescue:
Video: Helicopter Rescue at Lakewood Links in Sumter, SC on Oct 4, 2014. Credit: Sean Reyes
Scores of South Carolina residents were getting rescued by canoes and even boats where waters surged in places up to 25 feet above normal.
At least 9 dams have been breached statewide, as well as levees, requiring many thousands people more to be evacuated.
Governor Haley confirmed that over 550 roads were either closed, damaged or destroyed, including back roads and major interstate highways vital to the states and US national economy.
A 70 mile stretch of I-95, a major north-south artery traveled by millions including myself, was closed to all traffic on Sunday and remains closed today. And many side roads that could serve as potential detours are also closed.
Historically high water levels in some of the areas worst hit by flooding has finally receded. But in other areas water levels are rising.
In addition, the US Coast Guard says the cargo ship ‘El Faro’ with 33 people aboard is believed to have sunk because it ventured straight into Hurricane Joaquin. The ship’s crew included 28 Americans and 5 Polish sailors. It sank in the area popularly known as the ‘Bermida Triangle’ in water some 3 miles deep.
Today, the Coast Guard reported the discovery of a debris field over 25-square-miles wide. At least one crew member has already been found dead.
The El Faro set out from the port of Jacksonville on Tuesday when Joaquin was a tropical storm with 85 mph wind speed.
The last distress call on last Thursday morning, as the ship neared the eye of the Hurricane, then a Category 3. The ship was listing over 15 degrees surrounded by 30 foot high waves.
The hurricane quickly grew into a Cat 4 and no further word was heard from the ship. It may be 3 miles underwater at the bottom of the Atlantic Ocean.
How and from which fleet of satellites does NASA obtain the orbital measurements used to create the high resolution, color-coded GPM IMERG visualizations?
“The Integrated Multi-satellitE Retrievals for GPM (IMERG) creates a merged precipitation product from the GPM constellation of satellites. These satellites include DMSPs from the U.S. Department of Defense, GCOM-W from the Japan Aerospace Exploration Agency (JAXA), Megha-Tropiques from the Centre National D’etudies Spatiales (CNES) and Indian Space Research Organization (ISRO), NOAA series from the National Oceanic and Atmospheric Administration (NOAA), Suomi-NPP from NOAA-NASA, and MetOps from the European Organisation for the Exploitation of Meteorological Satellites (EUMETSAT),” NASA scientists George Huffman and Dalia Kirschbaum told me exclusively for Universe Today.
“All of the instruments (radiometers) onboard the constellation partners are intercalibrated with information from the GPM Core Observatory’s GPM Microwave Imager (GMI) and Dual-frequency Precipitation Radar (DPR). The data are gridded at 0.1°x0.1° lat./lon and provided in 30 minute time slices through morphing between satellite overpasses. The satellite estimates are then calibrated with rainfall gauge information.”
Here’s another GPM visualization of Hurricane Joaquin:
Stay tuned here for Ken’s continuing Earth and planetary science and human spaceflight news.

More storm photos:
Seems like we’ve got once-in-a-generation droughts, or “thousand year” rainstorms, or record setting heat waves happening all the time, with increasing frequency. Is anyone seriously still going to pretend the climate isn’t changing, and changing for the worse?
Like him or is politics or not, Gore was right – especially about the frog in the hot water not noticing it heating up. I heard the climate sceptics beat their drums that Katrina was just a rare storm, the polar vortex just a rare cold spell… These rare events are really quite common now…
A few more “rare” events:
New York Hurricane
Record setting heateaves and bushfires in California and Northwest
.. I am sure there are more.. and thats just the USA in the last few years..
Isn’t it ‘funny’ that the usual global warming deniers are suddenly silent. They used to haunt this room and attack anyone who even MENTIONED global warming. Now, like many, they are probably too busy bailing out their basements to complain?
Got your emergency kit ready?
For those who want the short version, please skip down to where it says ***SHORT VERSION*** Also, see my disclaimer in italics at the end.
Aqua4U, maybe the “deniers” have given up on this site as a (forgive me, I speak hypothetically) “haven for the mindless warmista drones?” Or, is it possible they just feel that the arguments presented here are either non-arguments (we HAVE warmed since the Industrial Revolution, even the “deniers” say so, where’s the argument?) or simply nonsensical, since an argument over climate cannot be won by referring to a single weather event?
So, mewo, weeasle and Aqua, please consider the long-winded (even for me) comment which follows, as I attempt to adjust your perspective & approach to the issue of climate change. I make it because I feel like what you’ve said here so far neither advances the discussion, nor helps to find a resolution. Let me be as clear as one may be: it is not your position on global warming, but rather your defense of that position which I find lacking. To this end, I’ve addressed each of the specific concerns you’ve all noted separately below in the manner of a possible “climate skeptic” in order to demonstrate the problem to which you are (no doubt unconsciously) contributing.
“record setting heat waves”
1) Recent peer-reviewed studies of many large population groups indicate that most “excess” deaths occur during the winter, or during unusually cold snaps, not during the summer/heat waves. This trend is seen in all ethnicities, and appears regardless of local/regional climate phenotype (maritime tropical, continental polar, etc.). Consistent climatic warming may therefore actually be good for humans and not a direct threat to health and safety at all.
“Record setting heateaves and bushfires in California and Northwest”
2) Brush/forest fires are a regular, usual and above all NORMAL sign of summer in the Western/Mountain US, no matter how spectacular they may seem to those who haven’t grown up with them. While full-blown tree-top-engulfing forest fires are not terribly good for the environment (at least temporarily — there are whole ecosystems out there which REQUIRE such events in order to propagate / sustain themselves), the fact that rich folks like to build their dream homes in fire country without taking even basic precautions — and the fact that the local governments they elect adamantly refuse, in the face of all environmental sense AND science, to manage those areas effectively — is just not something I have much sympathy for. Loss of life & property is tragic; avoidable loss of life/property is criminal negligence; self-inflicted death/destruction is just sadly pathetic.
“once-in-a-generation droughts”
3) Contributing to this year’s fire situation, California is very dry this year. Still, a quick look at the climate record books shows that such dryness is generally the historic NORM in that region, not the exception. This is true not only over the last few decades, but also over the last few centuries (at least since the Spanish missionaries began keeping records). The relatively abundant rain of the last several years prior to the current drought is actually more “abnormal” than drought itself has been to date, historically speaking.
[Sorry your local reservoir is empty, Hollywood. Try cultivating a rock garden out there in the desert (which most of CA is, normally, esp. SoCal) instead of watering your acres and acres of industrially-grown sod 2 times a day, 5 times a week just to keep it some shade of not-yellow.]
“Katrina was [not] just a rare storm”
4) Though it may have been the most widely politicized/publicized, Hurricane Katrina wasn’t even the strongest storm to hit the US in 2005, and certainly not of all time. The flooding due to the failure of the ancient levies, and which caused the bulk of the death & destruction in New Orleans, had been predicted at least a decade earlier when disaster planning for such an event was conducted. I will not discuss why or why not state & local officials failed to implement those prior plans, but all of those political considerations pale in respect to the scientific reality that Slidell, LA, Gulfport & Pascagoula, MS, and Mobile, AL were ALL hit by more severe weather conditions than New Orleans, was.
In addition, there have been no major hurricanes to hit the US mainland since later in that same year (“major” = Cat. 3 or stronger — which, btw, Katrina & Sandy were NOT when they hit, thank you very much, O merciful Ceiling Cat!). Rita & Wilma both were major storms when they hit the US in ’05, and while this season’s Hurricane Joaquin was also a major hurricane, it did not make landfall in the Carolinas, heavy rain & doomsday pronouncements from local politicians notwithstanding.
“the polar vortex [isn’t] just a rare cold spell”
5) The “polar vortex” (actually a splitting and re-directing of the usual NH polar jet) happens on timescales similar to the ENSO, though with less clockwork regularity. From my own amateur glance at the records, the pattern seems to typically occur a few times in succession on a 2-5 year cycle (i.e., 2-5y between occurrences on average), interspersed with much longer breaks, sometimes 10-30+ years. It is not a new event on human timescales by any stretch, nor has it recently been more intense/more frequent than “normal,” no matter how many layers your weatherman might been wearing during his/her broadcast on the event. Local weather reports from North America and Siberia consistent with the phenomenon go back centuries, and some describe events far worse than those experienced in #Chi-beria (e.g.) the last couple of years.
“‘thousand year’ rainstorms”
6) We must be clear that the recent “1000-year rain event” wasn’t actually Hurricane Joaquin itself, but rather the result of a jet of moisture channeled into S. Carolina by the interaction of the (well off-shore) storm with the normal Low/High pressure systems nearby. In effect the confluence of systems set up a sort of North Atlantic “Pineapple Express” (a usually annual-triennial phenomenon that Californians are REALLY hoping hits them this coming winter). As for Governor Haley (R. – S.C.), she can be forgiven her millennial exaggeration on political grounds (not saying one must, nor that one should), but anyone who lived through Hurricane Hugo in the late 1980s would be happy to explain just how wrong she is, I’m quite sure.
“Seems like we’ve got [stuff] happening all the time, with increasing frequency,” and “These rare events are really quite common now…”
7) By many different measures, the current data show that severe weather events are down measurably in both frequency and degree in the US and the Northern Hemisphere over the last 50-odd years. Whether it’s floods, hurricanes, tornados, extreme rainfall surfeits/deficits, high winds, and so on, all such events are generally happening less frequently over time, and with lesser intensity when they do occur. In addition, recent satellite data from the GPM, the older TRMM and others (see, Mods, still on topic!) have shown that organized tropical storm activity in both the Atlantic & Pacific basins is generally on the wane over the same time period (they remain near statistical ‘norms’, so no one’s saying they’ve stopped either).
The net result of all these measurements is that, if anything, weather station and satellite observations are showing a climatic trend toward a less severe climate based on the ongoing weather we’re observing. (For those who understand the workings of Hadley cells, this is not necessarily an unexpected result in a planetary climate undergoing global warming, but that’s for another long-winded effort.)
“Isn’t it ‘funny’ that the usual global warming deniers are suddenly silent.”
8) As far as “denying” global warming, no one with any actual understanding of the climate record does so. We ARE warmer now than we were in the late 1800s, there’s simply no question about that; not even Lord Christopher Monckton argues that point. What the “skeptics” DO argue over are things like: the degree of warming; the cause of said warming; whether Man’s influence trumps (aha!) Nature’s; whether prevention of climate change is really better than adaptation to a changing climate; and so on. Sometimes the scientific arguments made are at cross purposes with one another, and sometimes they are downright contradictory… but as in the US judicial system, in science it is on the “prosecution,” if you will, to “prove” the point asserted (in this case, that Man is directly causing a damaging set of changes to the climate on regional & global scales), and to do so beyond a reasonable doubt. It is not up to the “deniers” to prove the negative; their job is simply to blow holes in the theories until someone can learn to defend them, or either come up with one that is solidly backed by the data to hand.
“Like him or is politics or not, Gore was right”
9) Al Gore brought everyone’s rapt attention to a certain pair of graphs published in an otherwise obscure scientific paper which detailed the reconstruction of temperature and atmospheric CO2 levels in Antarctica, via proxies found in an ice core drilled on that continent. Those graphs, in and of themselves were accurately reproduced for his show “An Inconvenient Truth,” and they seem to show that a clear relationship exists between the two parameters, at least at that site over the time period in question.
However, the relationship between the two graphs was clearly and deliberately adjusted for the sake of that production in a way the peer-reviewed paper never did. Specifically, the graphs were adjusted in time so that it appeared as though changes in temperature were concurrent or slightly lagging the observed CO2 changes.
In reality, the paper from which those graphs were taken shows very clearly that it was CO2 changes which lagged temperatures, not the other way around. The authors themselves wrote in their conclusions that their sample (one which ran over 400,000 years long) seemed to show that CO2 was observed to FOLLOW observed temperature changes by over a thousand years on average.
Many other peer-reviewed studies since that time have shown that CO2 changes follow temperature changes on ALL observed timescales, from diurnal, to seasonal, to centennial and beyond. The raw data the former Vice President drew everyone’s attention to could more plausibly be used to show that CO2 levels are being driven by temperatures, since logically a temperature “reaction” cannot precede a CO2 change. He just played with their X-axes to make it look otherwise to his audience.
One can certainly argue (as people do with Mann’s so-called “hockey stick”) over how temperature & CO2 records are generated from proxy data. Such arguments usually have a legitimate scientific basis, no matter which way the temperature data are being used, since proxies are never as accurate as actual thermometers, and because often there are confounding factors which could result in changes in those proxies OTHER than temperature. One can also argue over what the data collected actually MEAN, e.g., snow in July in AK could mean warming OR cooling in the current climate discussion… or, you know, maybe it’s just cold today? *shrug*
What is NOT arguable, however, is that Mr. Gore misrepresented the relationship between two sets of otherwise accurate, peer-reviewed scientific data in order to make the desired impression upon his audience. Whether he likes what it said or not, the data is the data, and his deliberate manipulation of said data — especially when such manipulation is used to generate clearly false impressions in its regard — is ALWAYS open to genuine scientific skepticism (not to say “ridicule,” or “derision”).
“Got your emergency kit ready?”
10) Always a good idea, even in an “ideal” climate… whatever that may end up being! ^_^
*deep breath*
Now that we’ve gotten all of that out of the way, please understand that I’m not arguing against “global warming,” per se. I am also not saying that mankind has no impact on climate either, far from it. What I AM saying is that one cannot expect to prove the case of “Mankind is Dramatically and Dangerously Changing Earth’s Climate” by using everyday examples of normally occurring weather, no matter how severe the individual instance(s) of such weather may seem. “Skeptics” will eat those “weather” arguments alive by going back to the observational records to show how “normal” they are in a mathematical, statistical sense… and, btw, that particular counter-claim can almost always be demonstrated to be logical, true and factual REGARDLESS OF WHAT THE ACTUAL CLIMATE MAY BE DOING. So I say again: if you use weather in an effort to prove or support a climate argument YOU WILL LOSE.
Also, appeals to authority whose data & conclusions can also be systematically demolished by mathematical/logical argument (e.g. Al Gore’s video) don’t help either. Sir Isaac Newton was a brilliant man who invented calculus in order to describe gravity. We still use calculus to this day as the very bedrock of advanced mathematics… his theory of gravity, not so much. Therefore, be sure to lean on LOGIC AND the DATA ONLY in your discussions, because people themselves are often (usually?) wrong just when we most need them to be right.
Remember that weather is what happens, while climate is what we expect over the long-term. Thus, climate changes require a LONG time to demonstrate conclusively simply because one needs time to definitively demonstrate the presence of two or more distinct climates in series. Thus, even a string of events over the course of several years is generally meaningless until it can be compared with other strings of other events both prior and subsequent… by which time you might already be in a “new climate,” but not yet know it, because the weather around you seems perfectly “normal!”
With this understanding, we can then rationally look at an incident like the Joaquin’s effects on South Carolina in this manner:
A) We know that we can expect temperatures to be warmer now than they were in the 1880s. This is a firmly established change from the previous climate regime to the current one, one which is established by observation, to wit: the consistent, reasonably accurate recording of temperatures throughout the world over a long period of time.
B) We also know that there have been very few years throughout the climate record when a hurricane has NOT been observed in the North Atlantic by early October, and also very few when we have seen more than a dozen. (The numbers drop to 0 – 5 per season to this point when tracking major hurricanes.) Since, according to the records, the number (& strength) of the storms we’ve seen this year fits the bounds of what may be considered “normal” in any given year, no one of them (Joaquin included) can be used to logically demonstrate that anything out of the ordinary is happening, no matter how many buckets are needed to empty one’s basement.
Therefore, the Weather of Joaquin — though nasty, severe, destructive, deadly, and certainly atypical of what S. Carolinians expect of their usual October weather — cannot be considered evidence of an “abnormal” or “unusual” climate. In fact, since not only do our records only cover a finite period of time (who knows what storms were like in S.C. in October of 2015 BC?), but also since the event falls within previously established minima/maxima for such events already in our records, the Ghost of Joaquin can’t even be considered “abnormal” or “unusual” for events of its type within the current climate regime, let alone used as clear evidence of a changing climate.
***SHORT VERSION***
If you take nothing else away from my post, please take this: weather records of all kinds are set DAILY (hourly, really) around the world. They do not (cannot, really) necessarily mean anything significant scientifically beyond the fact that we have only recently begun recording them in a significant number of places with a significant degree of accuracy. As such, making a climate-spanning conclusion from a single (or even several) isolated weather event(s) is ALWAYS going to get shot down with statistical math from whatever side opposes your viewpoint, regardless of what the climate — regionally or globally — may actually be doing in the meantime.
The bottom line is that discussing climate means taking the really long view, so don’t get distracted by one pretty sunset OR one nasty storm, a serious flood OR a serious drought: both have happened before, and both will happen again. Rather than being swayed by the media image du jour, let science and the data itself drive your thinking and your positions on the issues of the day; everything else is just propaganda, regardless the of the nobility of the end goal. And if I may add one final, personal pet peeve, how often does “Pardon me, I’m John, and you know you’re going to Hell, right?” actually work on anyone??? If it doesn’t work on you, I would say you’re normal… so remember that, and instead of attacking or belittling people, use the data to show why they are mistaken and to support whatever solution you propose. There’s no need to hand folks a convenient excuse to dismiss you & ignore your position, just because you gave in to adrenaline &/or peer pressure and resorted to personal attacks & name-calling as a strategy.
Disclaimer:
In the above I do NOT argue the concept of “global warming,” nor do I assert that mankind has no impact on climate. I DO assert that climatic arguments cannot be proven from a small sampling of weather-related events. I have researched the points listed above for my own edification (in the peer-reviewed scientific literature, and elsewhere), and the statements made above have been shown to be factual to my satisfaction. Nevertheless, these statements are MY OWN: everyone else is welcome — nay, strongly encouraged! — to go look up the thousands of papers, articles and so forth addressing this subject on their own and arrive at their own conclusions.
I’m not going to argue with anyone over what I’ve written here (someone will want to, I’m sure), nor am I going to provide a bibliography to support my claims.(*) I was able to research the many sides of this topic just fine on my own without one, you can do it too. Sorry if that seems rude, but I can’t be bothered to do your own research for you, as it doesn’t pay enough for the effort expended and for the vilification received from either side of the “Alarmist”/”Denier” divide when they don’t like something I say. Screw both of those “ends-fits-the-means” religions with bloody syphilis, and carefully place the last bottle of penicillin pills on Earth in the no-man’s-land exactly between them, kthxbai.
(*) Of course, references should be expected from articles on such serious topics as might be published on reputable scientifically oriented sites like UT… soooo, if someone were willing to pay me to write such articles regarding such research, and also to respond to the inevitably outraged crazies, I’d certainly reconsider my position….